Expression-based Formatting in Power BI
If you have used SSRS, you know that paginated reports are very customizable, and you can make almost any property expression-based. Power BI is yet to deliver expression-based properties to change settings based on runtime condition, such as to change the font style based on the actual value or user selection. Currently, there are two places where you can use a DAX measure for expression-based formatting of colors:
Conditional formatting
You can use a DAX measure to change the fore color or background color when you apply conditional formatting to cells in Table and Matrix reports. To do so, when you configure the conditional formatting settings, choose the Field Value option. In the following report, I used a DAX measure to format the TaxAmount field with the following formula:
TaxColor = SWITCH(TRUE(), SUM(ResellerSales[TaxAmt])> 100000, “Red”, SUM(ResellerSales[TaxAmt])>50000,”Yellow”, SUM(ResellerSales[TaxAmt])>10000,”Green”, BLANK())
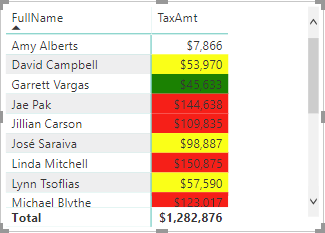
Although the measure defines three bands of colors, which you can do by just using rules, it can also check additional runtime conditions, such as what field is used on the report or what value the user has selected in a slicer. You can also specify custom colors by using the hex triplet notation, such as #00AA09.
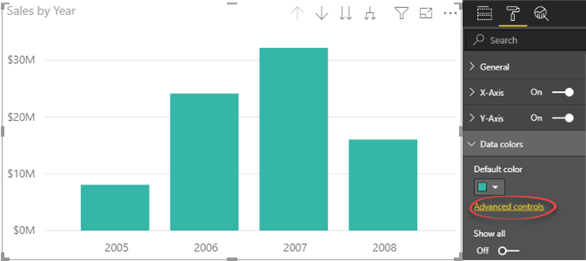
Chart data colors
Some charts with single data series, such as column and bar charts, support “Advanced controls” in the “Data colors” section of the Format tab in the Visualizations pane. This link brings you to the same window that you use to configure conditional formatting and you can use the “Field value” option to choose a DAX measure.