Prologika Newsletter Summer 2021
 Business Performance Management (BPM) is a methodology to help the company predict its performance. An integral part of a BPM strategy is creating and monitoring a scorecard with Key Performance Indicators (KPIs). In this newsletter, I’ll discuss how the newly released Power BI Goals can help you augmenet your BPM strategy. But before that, I’d like to share my excitement that Microsoft have recently awarded me FastTrack Recognized Solution Architect – Power BI! I’m one of the 33 individuals worldwide who got nominated by the Power Platform product engineering team for consistently exhibiting deep architecture expertise and creating high quality solutions for customers during project engagements.
Introducing Power BI Goals
A vital BI practice for every organization, performance management ensures that important metrics, such as Key Performance Indicators (KPIs), meet established goals. The typical artifact to do so is implementing a scorecard: a report that compares the current state with the desired state of these metrics. You might have also heard the term “balanced scorecard” which is an organization-wide scorecard that tracks several subject areas, such as Finance, Customer, and Operations. In the past, organizations would use different tools, such as the now deprecated PerformancePoint (included in SharePoint Server) to implement balanced scorecards. Realizing the importance of scorecards, Power BI introduced Goals that aim to simplify the process of implementing departmental and organizational scorecards. For more information on how Goals works, watch the “Goals in Power BI” presentation from the Microsoft Business Application Summit
What’s to like
As with anything Power BI, Microsoft has democratized scorecards so business users with no reporting experience can quickly assemble them from existing reports. Think of a goal as a line (or KPIs) in the scorecard. Here is scorecard with two goals:
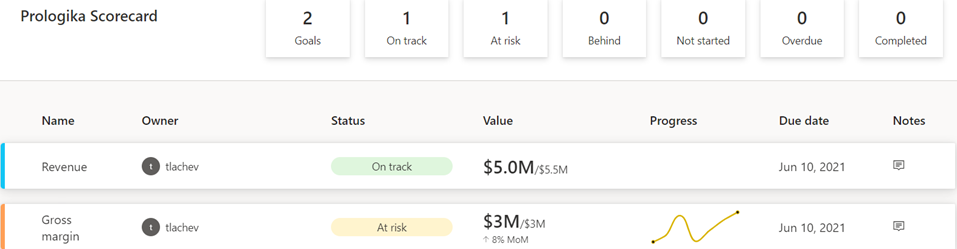
Currently, Power BI supports two goal types:
- Static – The goal creator manually enters and track the goal properties, such as current value, target value, and status. This could be useful for quick and dirty KPIs that are not backed by a data source, such as launching a new promotion campaign. In the scorecard above, I created the Revenue goal by entering 5M as the current value and 5.5M as the goal.
- Data-driven – The goal current value and/or target value can be data-driven and bound to metrics from existing report(s). Coming from Analysis Services, I was initially surprised that Power BI doesn’t require implementing KPI measures, but I get it: Microsoft decided to source the metrics from reports so business users can easily apply filters. If the goal owner chooses a metric from a visual that has a Date field, such as a time series chart, Power BI automatically shows a sparkline for the goal progress over time. And, of course, when the report dataset is refreshed, the goal values are updated.
So, no modeling or Power BI Desktop required assuming that someone else, such as a data analyst, has delivered functional reports with the metrics. Even better, the goal current and target values can come from different reports (even a report in a different workspace if you have permissions), e.g. a report with actuals and another report with targets. So, there is plenty of flexibility here. To mimic a balanced scorecard that spans multiple subject areas, the owner can create subgoals. For example, the main goal could be Finance with subgoals Revenue, Margin, etc. Because like dashboards, goals are “pinned” from reports, the end user can navigate to the underlying report to examine the data in more detail. Users can also add notes to explain the goal behavior to the teammates.
A scorecard is a first-class Power BI citizen, and as such, it can be secured, endorsed, secured with sensitivity labels, annotated, and shared, such as sharing the scorecard to a Microsoft Teams channel. The scorecard data is saved in a Power BI dataset that users can connect to build custom reports. Moreover, Power BI automatically adds daily snapshots to the dataset allowing users to build up a history of the goals. For example, if the underlying report is refreshed daily, the updated goal values will be appended to the dataset. Developers can use the Power BI REST APIs to implement programmatic scorecard management solutions.
What’s not to like
Besides navigating to the underlying report, a goal is a one-liner in the scorecard. I can’t define a goal that shows me a metric sliced by dimension members, such as business unit. Further, subgoals are not currently aggregable, such as to sum or average values when rolling up to the main goal. Like limitations with dashboards, there is no way to apply a global filter to the scorecard, e.g. to filter all goals for the prior month.
Besides current and target values, no other goal properties can be data driven. For example, unlike Analysis Services KPIs, the goal status can’t be currently bound to a DAX measure. Changing the status requires proactive manual “check ins” although Microsoft mentions a forthcoming feature that will let users define rules to change the status, like how you can define rules for dashboard tile alerts. Speaking of data-driven properties, I don’t understand why you must use a date field to get the progress as opposed to any other field, such as Month, in your Date table.
Finally and unfortunately, Goals require Power BI Premium. If we really want to democratize features, shouldn’t we make them available in Pro?
Conclusion
Goals are a Power BI Premium feature aimed at making it easier to create scorecards and monitoring metrics from existing reports. They promote a “bottom-up” culture, where business users can create departmental scorecards without reliance on IT. Microsoft plans more features by the end of the year to make Goals more appealing, such as integration with Power Automate to trigger actions, rolling up subgoals, changing the goal tracking cycle (DoD, MoM, YoY), custom goal formatting, Power BI Mobile experience optimized for phones, providing a scorecard visual, and cascaded goals (hierarchy of goals).
If you find Power BI Goals somewhat inflexible or you don’t have budget to upgrade to Premium, you don’t have to use the Goals feature to implement scorecards. You can define KPIs and create dashboard-looking reports where you have complete control over the scorecard presentation.

Teo Lachev
Prologika, LLC | Making Sense of Data
Microsoft Partner | Gold Data Analytics
![]()


