Interactive Excel Pivots in Power BI
A long-standing limitation of Power BI has been that Excel pivot reports connected to external Analysis Services models can’t be interacted with when uploaded to Power BI Service. You get the cached pivot report but any attempt to interact with the report online (that is in Excel Online), such as to change a slicer or filter, would result in an error complaining that the connection can’t be refreshed and there hasn’t been a workaround. Today, Microsoft partially lifted this limitation by supporting interactive pivots connected to Power BI datasets. Unfortunately, pivots connected to external Analysis Services models (both on-prem and cloud) still don’t support interactivity.
For some reason, this feature is called “connected PivotTable refresh” although a better name would be “interactive Excel pivots finally”. It works in Power BI Pro and Premium. Unlike the initial announcement that speculated that this feature would be available by simply uploading your Excel file to Power BI Service, it appears that it requires the Excel file to be uploaded to OneDrive or SharePoint Online. Here are the high-level steps that worked for me:
- Create your Excel pivot using the Analyze in Excel feature or directly from Excel. Assuming you have a recent Office 365 build, the latter option allows you to open Excel on the desktop and click Insert->Pivot Table->From Power BI to connect to a Power BI dataset from within Excel Desktop.
- Click Save As and save your workbook to OneDrive or SharePoint Online. Recall that you can specify a SharePoint site for storing workspace files in the Power BI workspace settings if you don’t want to upload the file to your personal folder.
- Use the Power BI Service “Get data” feature to upload (not import) the Excel workbook in a Power BI workspace. Again, the Excel workbook must be located either in OneDrive or SharePoint online.
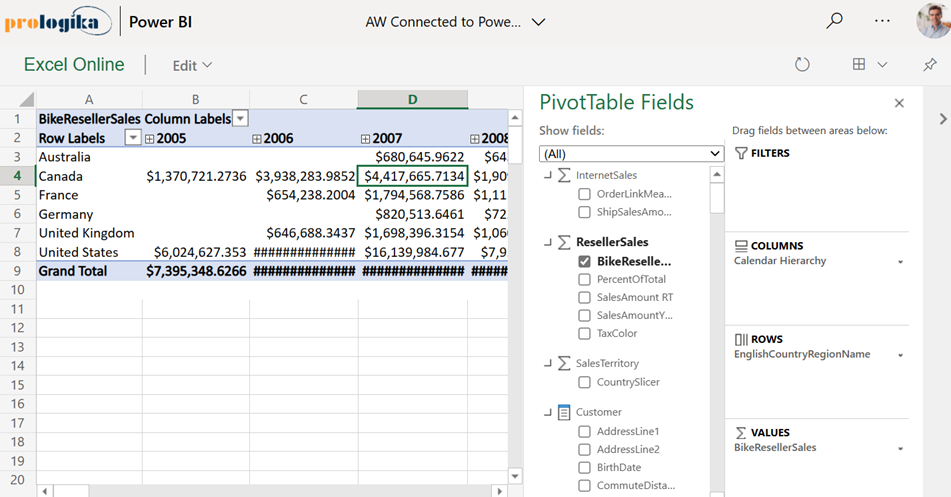
- Interact with the report in Power BI Service, such by drilling down, drilling through, or even rebinding the report to different fields! As a bonus, when the underlying dataset refreshes, your pivot report will show the latest data as it connects live to the dataset.
The “connected PivotTable refresh” is a much-needed enhancement that brings the same interactive features to Excel pivot reports that users previously had in SharePoint Server. Now users who favor Excel pivots for interactive exploration can share their reports and the interactive features would be preserved when the report is rendered online. The feature requires storing the Excel workbook in OneDrive or SharePoint Online and using an Analyze in Excel connection. Unfortunately, it doesn’t work with Analysis Services models that are external to Power BI (not deployed to Power BI Service) which is another incentive to move your semantic models to Power BI as I’ve been advocating for some time.