Prologika Newsletter Summer 2020
 More and more organizations are switching to Microsoft Teams mostly for online meetings. However, Microsoft Teams can deliver much more than that and it will be unjust to compare it with other popular meetings apps. In this newsletter you’ll learn how Prologika helped a public school district gain important insights from Microsoft Teams. Learn more and try an interactive Power BI report in the related case study.
Teams for Education
What Microsoft has done with Teams is amazing! Now that I got to study and program Microsoft Teams, I have found it a powerful and extensible platform. For example, Microsoft has provided add-ons for common verticals, such as Teams for Education. Microsoft Teams can be further enriched with apps and can be used to centralize all these Excel spreadsheets that are floating around. And the best of it: most of the Microsoft Teams data is exposed via a single data source: Microsoft Graph API, with the caveat that it is not that easy to get it out.
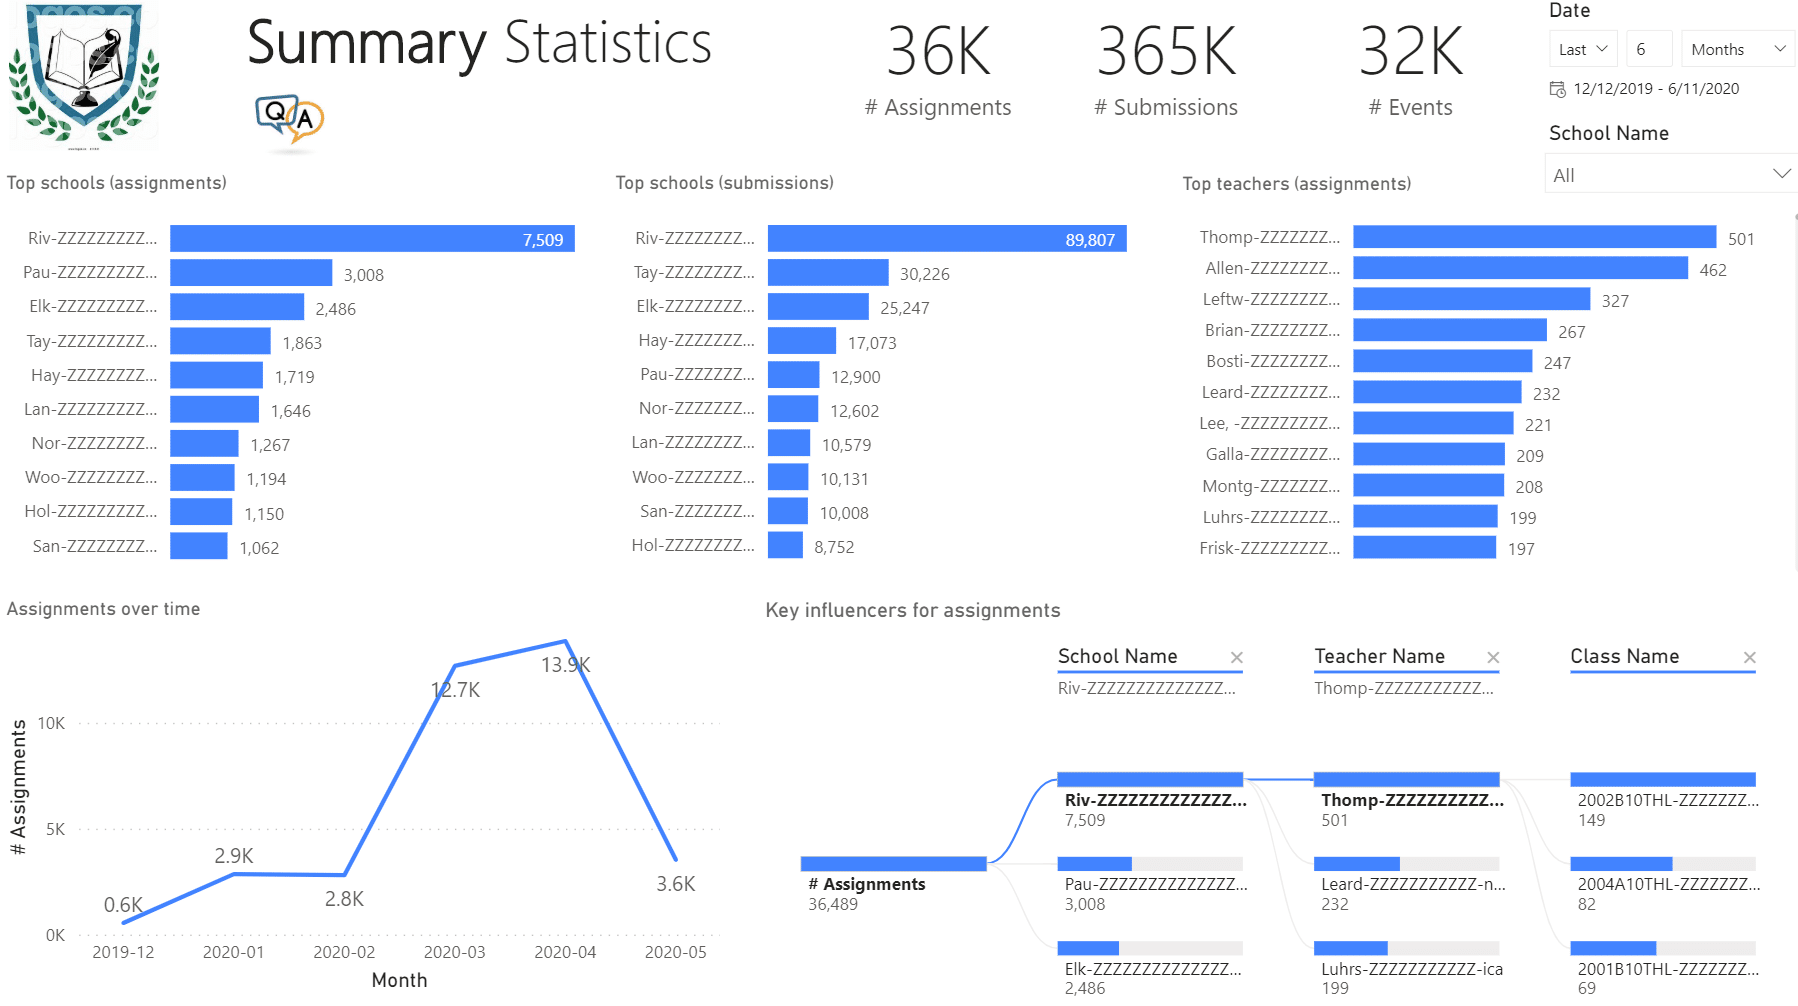
During the COVID-19 crisis, Fulton County Schools (FCS) transitioned from traditional classroom content delivery to online digital teaching and learning. FCS adopted Microsoft Teams for Education as an online platform to foster collaboration between teachers and students. However, FCS struggled for a long time trying to obtain the necessary data from Microsoft Teams to analyze how effectively teachers and students utilize Microsoft Teams in these challenging times. The Microsoft-provided Office 365 Usage Analytics for Power BI didn’t provide the depth of information FCS needed, such as to analyze counts of assignments that teachers give to students and submissions that students prepare for an assignment. FCS also wanted to understand about how often teachers and students meet and for how long.
Solution
Prologika developed a custom app to extract the required data by calling the Microsoft Graph APIs. The app supported a configurable degree of parallelism to process data in parallel. This reduced the duration for the full load to less than 7 hours. In addition, incremental daily ETL decreased the extraction time even further. The data was saved in a relational database consisting of several entities, such as Schools, Classes, Assignments, Submissions, and Events. Data availability led to data analytics. Power BI reports were implemented to deliver important insights, such as the report below.
Our BI solutions help clients implement a digital feedback loop and act upon the data. The process starts with acquiring the necessary data and designing a comprehensive data model that can answer important business questions. Then, the client applies the insights to improve their processes. This leads to a powerful feedback mechanism where outputs are routed back as inputs to business.


