Power BI Bookmarks
So far, Power BI has lacked the ability to navigate to particular report element, such as another report page, and to allow you to show/hide visuals. For example, Tableau allows you to add buttons to pages and navigate to another page on button click. Such navigation capabilities are important for story telling and for emphasizing elements on the screen.
This changes with the October release of Power BI Desktop which brings a set of navigation capabilities, including bookmarks, spotlight, and selection page.
Suppose you have a meeting and walk management through the sales performance of your company. You start with a bar chart. There is a decrease in sales in which you can explain by using the Analyze Increase/Decrease which I discussed here. Now you have two visuals on the same page:
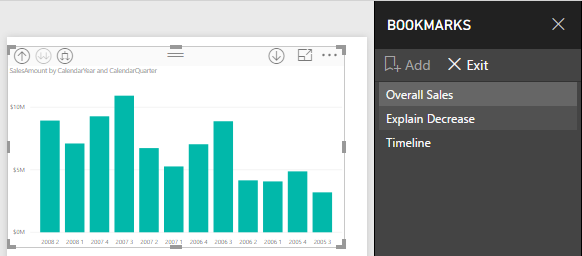
But at the beginning of your presentation, you’d want to bring focus on the bar chart, explain the overall trend, and then focus on why sales have decreased (the waterfall chart). You can use bookmarks to achieve this.
- Open the new Selection pane (in the View ribbon tab) and hide the Waterfall chart.
- While on the View ribbon tab, check the Bookmarks pane. Click Add to bookmark the state of the current page.
- Unhide the waterfall chart and create another bookmark.
Now you have two bookmarks that show/hide visuals on the same page. This is conceptually similar to the Power Point animation pane although bookmarks don’t come up with cool entry and exit animations. Now when you present, you can simply use the Bookmarks pane for navigation the way you can use a Table of Contents (TOC) in a Word document.
Bookmarks are a welcome new Power BI feature. They are important for data story telling and for improving the navigation experience in a busy report.


