SSAS Import Wizard to the Rescue
Sometimes, it’s better just to reset. I came across an issue concerning processing a partition whose containing measure group joins a dimension via another reference dimension. Specifically, when I attempt to process the partition, the server would error out with:
The binding for the ‘dimension key’ column is not a ColumnBinding type
What made this issue interesting is that I was able to repro the issue each time I would process the partition but the Microsoft support engineer, who was assigned to this issue, hasn’t been able to. After some digging we realized that the issue only happens in project mode, that is, when working with the project source in BIDS and deploying to the server.
How do we fix this horrible issue? We reverse-engineer the deployed cube using the SSAS Import Wizard to regenerate the source code.
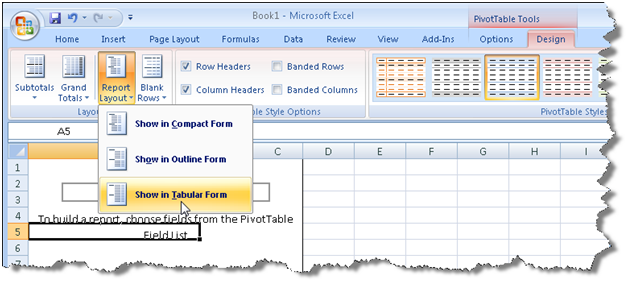
- In BIDS, click File->New->Project.
- In the New Project dialog, select Import Analysis Services 2008 (or 2005 depending on the version you have) Database.
- Specify the location of the deployed database. BIDS will reverse-engineer the database to its source code.
Magically, after this procedure the error went away although we are still working on finding out what caused the error with the original code.