I happy to announce my book “Applied Microsoft Analysis Services 2005” is now available as an Adobe PDF e-book. The first retailer that Google Alerts reported to sell it is Diesel Ebooks. It should soon pop up on all popular ebook retailer sites, such as ebooks.com. The suggested retail price for the ebook version is set to $39.95, which is ten bucks cheaper than the suggested retail price of the paper copy. The ebook is DRM-protected but fully functional with unlimited printing and copying capabilities. The DRM protection is handled by the retailer. Since the distributor is not set up to handle different pricing models, such as buy the paper copy and get the ebook free, there is no discount pricing model for the e-book version at this time.
Also, the same book is now available on Amazon Kindle. Since I don’t have an Amazon Kindle, I don’t know what the Kindle version looks like. Unfortunately, Amazon doesn’t support PDF. They use proprietary software that converts the book to the Kindle native format (AZW). If you buy the Kindle copy, please drop me a note to share your feedback.
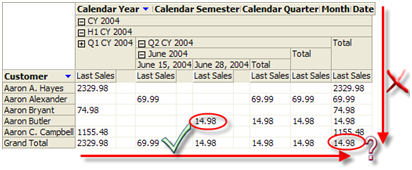
Enterprise Edition of Analysis Services 2005 and 2008 supports semi-additive functions, such as LastNonEmpty, LastChild, and so on, to facilitate working with semi-additive measures, such as account balances and inventory snapshots. For example, the screenshot below shows LastNonEmtpy in action. To demonstrate this, I added a Last Sales measure to the Internet Sales measure group in the Adventure Works cube and set its AggregationFunction property to LastNonEmpty. Of course, this doesn’t make much sense because sales amounts are fully additive but it’s OK for demo purposes.
As expected, the quarter and year totals show the last non empty sales. The customer totals are correct too because semi-additive measures sum across any dimension except Time. But what about the grand total of $14.98? Shouldn’t we get the sum of the quarter (or year) subtotals?
To answer this question, we need to understand how LastNonEmpty operates. LastNonEmtpy works across time and not across other dimensions. Because the last customer recorded sales are in June 2008, LastNonEmpty gives you Q2 total of $14.98 which becomes the YTD total as well. So, does it make sense to sum the totals vertically? The philosophical answer is “it depends”. If this was inventory balances, the question is why we have missing balances in the last day. In other words, to get the vertical sum right we need to record balances for each product for each period. One may say that in this case LastNonEmpty is correct because it makes no assumptions about what happened to the “missing” values for products, customers, etc. It could be that we didn’t record them or it could be that there we discontinued that their ending balance is indeed not applicable.
But, there could be cases when we need LastNonEmpty to sum vertically instead of getting the last values. For example, the cube may have test scores and you may need to get the last score, such as to calculate the average student or school score. To address this requirement, our first impulse could be to use a scope assignment that overwrites the (Root(Customer), Root(Date)) tuple to server SUM aggregate function (the one you specify in the AggregateFunction property). But, as it stands, SSAS doesn’t support plugging in server aggregate functions in scope assignments.
So, we will try the reverse approach:
Add a new fully-additive measure Sales with SUM aggregate function.
Overwrite the Sum with LastNonEmpty at the customer level.
this = [Measures].[Last Sales]; /*assign Last Sales to Sales to make it semi-additive at customer level*/
EndScope;
Note that [Customer].[Customer].[Customer]. Members exclude the Customer All member. Since the server uses the All member to aggregate up, aggregating at a higher level, such by product will work fine because All member will contain the SUM of the last sales.
It will be great if a future SSAS release supports:
Using server aggregate functions in scope assignments
Give the modeler an option to control the behavior of the semi-additive measures.
The Microsoft CAT team has released a new whitepaper Analysis Services Many-to-Many Dimensions: Query Performance Optimization Techniques.
“Many-to-many dimension relationships in SQL Server 2005 Analysis Services (SSAS) enable you to easily model complex source schemas and provide great analytical capabilities. This capability frequently comes with a substantial cost in query performance due to the runtime join required by Analysis Services to resolve many-to-many queries. This best practices white paper discusses three many-to-many query performance optimization techniques, including how to implement them, and the performance testing results for each technique. It demonstrates that optimizing many-to-many relationships by compressing the common relationships between the many-to-many dimension and the data measure group, and then defining aggregations on both the data measure group and the intermediate measure group yields the best query performance. The results show dramatic improvement in the performance of many-to-many queries as the reduction in size of the intermediate measure group increases. Test results indicate that the greater the amount of compression, the greater the performance benefits—and that these benefits persist as additional fact data is added to the main fact table (and into the data measure group).”
Here is a useful page from the SQL Server 2008 BOL that summarizes the SSAS performance improvements in Katmai pretty well. It also shows which functions are optimized. For example, the Lag function wasn’t optimized in 2005 but now is.
https://prologika.com/wp-content/uploads/2016/01/logo.png00Prologika - Teo Lachevhttps://prologika.com/wp-content/uploads/2016/01/logo.pngPrologika - Teo Lachev2007-11-26 04:01:122016-02-17 11:53:39Performance Improvements for MDX in AS 2008
An advanced SSAS performance-related feature is Non Empty Behavior (NEB) which has been discussed in many places including this Mosha’s blog. The issue with NEB in SSSAS 2005 is that you can very easily get it wrong. The server will trust you (this could be an optimistic assumption) and accept a NEB even if it’s not correct. Example:
CREATEMEMBERCURRENTCUBE.[Measures].[Profit Gap To Prior Period]
AS [Measures].[Profit]-([Date].[Calendar].PrevMember, [Measures].[Profit]),
FORMAT_STRING = “#,#;(#,#)”,
NON_EMPTY_BEHAVIOR = { [Measures].[Profit]},
VISIBLE = 1;
Here, the intention is to default the expression for the Profit Gap To PriorPeriod calculated member to NULL if Profit is NULL. But the expression may be not be NULL even if Profit is NULL. This can yield incorrect results in 2005. In 2008, optimizations were made that don’t use the NEB expression. The net effect is that some calculated members that use wrong NEBs can produce different, albeit correct, results in 2008. If I am not wrong, in this webcast, Donald Farmer mentioned in this webcast that NEBs will be de-emphasized in SQL Server 2008. Meanwhile, if you are to use NEBs be sure that they are right to save you many hours of testing and head-scratching.
SQL Server Magazine published the second part of my Protect UDM with Dimension Data Security article in the October issue of the magazine. In this article, I explain how to use MDX expressions to implement dynamic dimension security. I discuss two practical approaches for meeting advanced requirements for securing UDM data. First, I present a solution in which the security policies are stored in a factless fact table. Next, I explain how to leverage SSAS stored procedures to integrate UDM with an external security service.
The article is available for public access. Enjoy!
https://prologika.com/wp-content/uploads/2016/01/logo.png00Prologika - Teo Lachevhttps://prologika.com/wp-content/uploads/2016/01/logo.pngPrologika - Teo Lachev2007-09-21 20:39:262021-02-16 03:01:16Protect UDM with Dimension Data Security Reloaded
If your organization can afford SAN, here is another best practices article by Carl Rabeler from the SSAS team. The Scale-Out Querying with Analysis Services Using SAN Snapshots article “describes the use of virtual copy SAN snapshots in a load-balanced scalable querying environment for Microsoft SQL Server 2005 Analysis Services to increase the number of concurrent queries to Analysis Services servers with a rapid response time per query.”
https://prologika.com/wp-content/uploads/2016/01/logo.png00Prologika - Teo Lachevhttps://prologika.com/wp-content/uploads/2016/01/logo.pngPrologika - Teo Lachev2007-09-12 20:11:532021-02-16 03:01:13Scale-Out Querying with Analysis Services Using SAN Snapshots
Those of you preparing for Microsoft exam 70-445 Microsoft SQL Server 2005 Business Intelligence – Implementation and Maintenance may be interested to know that Microsoft Press has just published a training kit with the same title which I co-authored with Erik Veerman, Dejan Sarka, and Javier Loria from Solid Quality Learning. I wrote four of the SSAS chapters. I also took the actual exam prior to writing the content so I hope the book will help you to prepare and pass 70-445.
https://prologika.com/wp-content/uploads/2016/01/logo.png00Prologika - Teo Lachevhttps://prologika.com/wp-content/uploads/2016/01/logo.pngPrologika - Teo Lachev2007-09-12 12:04:412021-02-16 03:01:12MCTS Self-Paced Training Kit (Exam 70-445): Microsoft SQL Server 2005 Business Intelligence—Implementation and Maintenance
Performance is the most common incentive for using Analysis Services. Yet, despite the advances in the SSAS management tools, optimizing the MDX query performance is still considered as “black magic” by many. Graphical optimization tools similar to the SQL query optimizer and query showplan would definitely help but they are not expected anytime soon. Meanwhile, Microsoft has just published a 60-page whitepaper Identifying and Resolving MDX Query Performance Bottlenecks in SQL Server 2005 Analysis Services by Carl Rabeler and Eric Jacobsen. At first sight this resource looks like a must-read for anyone looking for tips to make that query execute a few seconds faster. From the article summary:
“To improve the performance of an individual MDX query that is performing poorly, you must first identify the source(s) of the performance bottlenecks in the execution of the query. This requires that you understand how to use Windows and SQL Server 2005 Analysis Services troubleshooting tools. This best practices article provides information about available troubleshooting tools and demonstrates how to use the most common of these tools to identify and resolve MDX query performance bottlenecks.”
Many report developers find the SSAS data provider too restrictive for authoring reports from UDM. Instead, they replace it with the native Microsoft OLE DB Provider for Analysis Services 9.0 which gives them maximum flexibility at the expense of convenience (the query has to be hand-generated, parameters are not supported, extended properties are not available, etc).
By default, the OLE DB provider doesn’t return the extended cell properties, such as format and color settings. Thanks to Robert Bruckner from the SSRS team, here is a precious tip to get the extended properties:
Append Extended Properties=”ReturnCellProperties=true” to the OLE DB connection string of your data source, e.g.:
Provider=MSOLAP.3;Data Source=localhost;Initial Catalog=”Adventure Works DW”;Extended Properties=”ReturnCellProperties=true”
Request the cell properties in your MDX query as the SSAS provider does, e.g.:
SELECT NON EMPTY { [Measures].[Internet Sales Amount], … } ON COLUMNS,
NON EMPTY { [Sales Territory].[Sales Territory Group].[Sales Territory Group].ALLMEMBERS , …. }
FROM [Adventure Works] CELL PROPERTIES VALUE, BACK_COLOR, FORE_COLOR, FORMATTED_VALUE, FORMAT_STRING, FONT_NAME, FONT_SIZE, FONT_FLAGS
Execute the query. The OLE DB Provider returns the extended properties as fields in the dataset.
You will notice that the OLE DB provider returns the cell colors as numeric values. To convert the SSAS numeric colors to RGB colors for use on your report, you can use this helper function in your report.
int intValue = ConvertToInt32(value, out isValid);
if (isValid) {
return String.Format(“#{0:x2}{1:x2}{2:x2}”,
(intValue & 0x000000ff),
(intValue >> 8) & 0x000000ff,
(intValue >> 16) & 0x000000ff);
}
https://prologika.com/wp-content/uploads/2016/01/logo.png00Prologika - Teo Lachevhttps://prologika.com/wp-content/uploads/2016/01/logo.pngPrologika - Teo Lachev2007-08-14 19:01:262016-02-17 12:24:32How to Get Extended Properties with SSAS OLE DB Provider