Posts

Using Profiler to Trace Azure Analysis Services

Scenario: You use Azure Analysis Services and you want to trace events in the SQL Server Profiler. However, you run the Profiler, connect to AAS, and you get greeted with “Unable to locate trace definition file Microsoft Analysis Services TraceDefinition 15.0.0.xml“. The prompt gives you an option to download the trace definition from the server, but nothing happens. You’ll encounter the same issue if you attempt to access a higher version of AAS or Database Engine from a lower version of Profiler, such as when you install SSMS 2012 on your laptop, but you connect to SQL Server 2016 or higher.

Workaround: While we’re waiting for Microsoft to provide the Azure AS trace definition, you can use this workaround:

  1. Navigate to the Profiler trace definition folder. In my case this folder is C:\Program Files (x86)\Microsoft SQL Server\140\Tools\Profiler\TraceDefinitions. Copy the latest trace definition file (in my case it was “Microsoft Analysis Services TraceDefinition 14.0.800.xml”) and paste it as Microsoft Analysis Services TraceDefinition 15.0.0.xml. You need admin privileges to do this.
  2. Start Notepad or Notepad++ with admin rights and open Microsoft Analysis Services TraceDefinition 15.0.0.xml from that folder.
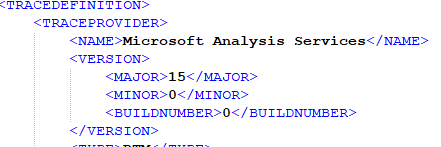
  3. Change the Major version to 15, minor version to 0, and build number to 0 at the top of the file and save the file.
  4. If you want the default trace templates so you don’t have to configure the trace from scratch, navigate to the Profiler’s Templates folder (C:\Program Files (x86)\Microsoft SQL Server\140\Tools\Profiler\Templates\Microsoft Analysis Services). Copy the 140 folder and paste it as 150 folder. This folder has the Replay and Standard template definitions.

As Analysis Services evolves, the version  number would increase. You can connect SSMS to AAS and check its version in the server properties. In this case, version 15.0.1.245 corresponds to 150. This why the folder name is 150.

Unblocking MDX Queries from SSRS Reports

I love performance optimization. It’s exciting to peek under the hood and take a deep dive in the mysterious world of how Microsoft designed things. And it always humbles me by bringing forth gaps in my knowledge.

Scenario: You have SSRS reports that query Analysis Services Multidimensional cubes. When users request reports in Report Manager (aka Web Portal starting with SSRS 2016) and … the report hangs sporadically, without even getting to the ReportViewer page… for minutes. The server doesn’t appear to be under resource pressure. The issue happens when the cube is being processed. And no, this is not about locking.

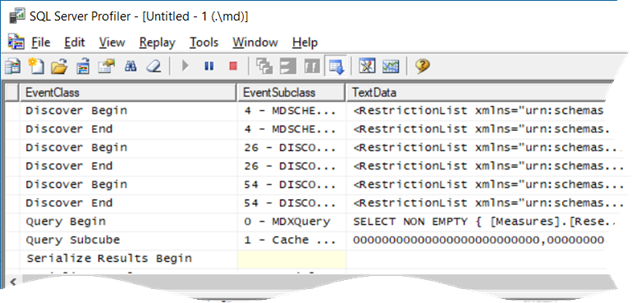
Solution: This one wasn’t trivial to figure out. The profiler showed that when the report is requested, SSRS fires the first MDX query (typically, a query that populates the parameter available values). The breakthrough came when I executed the same query in SSMS while the SSRS one was blocked, and it executed immediately. With some help from Microsoft, it turned out that flattened rowsets (SSRS requests flattened rowsets), are serialized by threads in the SSAS processing pool. Indeed, once I enabled the Serialize events in the profiler, I noticed that the Serialize Results Begin event fires but not Serialize Results End.

022418_0254_UnblockingM1.png

So, if there are not enough threads in the SSAS processing pool, the flattened queries are queued. You can use the MSAS11 Threads: Processing Pool Job Queue Length counter to confirm that processing threads are queued. In this case, the queue length was about 200 threads when fully processing the database!

The resolution depends on your specific situation. If you have plenty of CPU cores, try increasing the pool size by increasing the ThreadPool\Process\MaxThreads SSAS setting. The default value of this setting is 0, causing SSAS to allocate the maximum of (64, number of logical cores). So, if you have a two-socket server with 16 hyperthreaded cores (32 logical cores), the maximum number of processing threads would be 64. On the other hand, if you see a high CPU utilization during processing, try reducing the parallelism of the processing task by using one of these three approaches:

  1. Reduce the maximum number of connections in the SSAS data source properties.
  2. Set the MaxParallel setting on the processing batch command.
  3. Reduce the CoordinatorExecutionMode SSAS configuration settings.

Also, I recommend you load test your production server to ensure that it has enough capacity. I did a “Can Your BI Solution Scale” presentation at TechEd 2011 about load testing SSAS and SSRS that shows how this could be done.

Many thanks to Akshai Mirchandani from the SSAS product team for shedding light in dark places.

Deploying and Processing Azure AS

In the “Processing Tabular from Exotic Clients” blog, I said that if you Azure AS model retrieves data from an Azure database, such as Azure SQL Database, it should also be located in the same Azure data center for faster processing and to avoid data transfer fees between data centers. Let’s elaborate a bit on this and share some performance results from a real-life project.

We deployed two Azure AS instances to North Central and South Central Azure data centers, while the Azure SQL Database was deployed to the South Central data center. Here the stats for processing loading about 35 million rows in Tabular using the Full Process of the AS database. The Azure SQL Database was at P1 performance level and Azure AS was at S1 performance level.

  • South Central: 12 minutes or about 50,000 rows/sec
  • North Central: 19 minutes or about 30,000 rows/sec

As you can see, hosting Azure AS in a different center incurs not only data transfer fees but also increased processing times (more than 50% overhead). Your results will probably vary but just like with on-premises installations, it’s very important to fine tune your queries or SQL views. SSAS is capable of processing more than 100,000 rows/sec on a single thread. However, it can do this if rows from the data source arrive at that speed. If you use custom queries or SQL views, any join or inefficient code can potentially slow down processing times significantly. For example, I typically use SQL views to wrap fact tables to perform ad hoc calculations. Initially, for this project I used the T-SQL AT TIME ZONE clause to perform some time zone calculations in the view. As it turned out, AT TIME ZONE is very slow because it looks in the registry for information about when daylight savings time starts and ends, and needs to work out whether each individual value you’re converting is within that period or not. As a result, processing the model took 6 hours! Once I switched to using SWITCHOFFSET, it went down to 12 minutes.

To quickly test the database throughput, open SSMS (ideally in a VM in the same data region to ignore connection latency) and execute a query that selects a few million rows from a table (make sure to change the Discard Query Results option in the query properties to False to avoid SSMS running out of memory when loading all these rows from the grid and to ignore the time to visualize the data). Then divide the query execution time by the number of rows. This gives you the data retrieval throughput and that will determine how fast SSAS can read the source data.

Azure Analysis Services

Despite the mantra you might hear elsewhere, my experience shows that the best self-service BI is empowering users to create reports from trusted semantic models sanctioned and owned by IT. Most of the implementation work I do involves Analysis Services in one form or another. Analysis Services has a very important role in your BI ecosystem as I explain in the “Why Semantic Layer” newsletter.

Today, at the SQL PASS SUMMIT, Microsoft announced that Analysis Services Tabular is now available as an Azure PaaS service. As a participant in the prerelease program, I had the opportunity to test Azure Analysis Services and this is why I believe you should care:

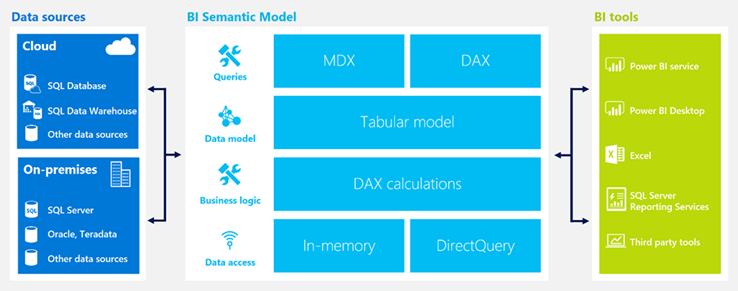
  1. If you develop cloud-based solutions, you might not have to provision a VM for Tabular anymore. Instead, you can provision an Analysis Services cloud service in seconds, just like you can provision an Azure SQL Database.
  2. You can easily scale up or down Azure Analysis Services, just like you can do this with Azure SQL Database. You can even pause it so that you don’t incur cost.
  3. You don’t have to set up a gateway for SSAS. You can use Power BI Desktop to connect to Azure Analysis Services and deploy the report to Power BI. However, you would need a gateway if your source data resides on premises so that you can process the model with on-premises data. Note that currently you can’t use Power BI Get Data to connect to Azure Analysis Services directly from Power BI. Instead, you must use Power BI Desktop.
  4. The service is highly available by default. SQL Server pros implementing highly available solutions know that this is not easy and not cheap. So, factor in high availability if you find Azure Analysis Services pricing is too high.

On the downside, as it stands Azure Analysis Services uses Azure Active Directory for security and it doesn’t support claim authentication. Power BI users will be able to authenticate but not Power BI Embedded (not yet).

Currently in preview, Azure Analysis Services is a very important addition to the Microsoft Azure BI stack that allows BI pros to implement cloud-based semantic models as they can currently do on premises.

102616_0114_AzureAnalys1.png

ADOMD.NET Connection Pooling

I helped a customer to implement ADOMD.NET connection pooling with the goal to increase significantly the query throughput. Their predictive service platform had to scale to thousands of queries per minute. However, as it stands, ADOMD.NET doesn’t have connection pooling. Normally, this is not an issue (see the implementation details of how SSAS handles connections here), but in this case the application was constantly opening and closing connections under a dedicated (trusted) account to send singleton DMX queries. Interestingly, performance counters wouldn’t show pressure on the SSAS server but for some reason the client has blocking for long periods after a certain number of open connections (could be related to TCP/IP port exhaustion).

The solution was to implement custom ADOMD.NET connection pooling. You can find the .NET source here. The code should be easy to follow. It uses a Queue class to cache up to 50 connections. When the client needs a connection, the pool manager dequeues the connection from the pool. When the client is done with the connection, it returns the connection to the pool (there is some sample code at the end that shows this). The connection manager had to be thread-safe as multiple threads could use the connection manager at the same time.

This code went to production and the customer reported remarkable results. “The first of the month is by far our biggest day: we are calling this service at rates approaching 1500 calls/min!”

Load Testing Tabular

I while back I did a TechEd presentation “Can Your BI Solution Scale?”, when I discussed a methodology for load testing SSAS and SSRS. A customer wanted to ensure that its Tabular model can scale to thousands of deployed users when it goes live.

You can still use the excellent Microsoft-originated AS Load Sim framework that I demonstrated in the presentation to load test Tabular. And you can use it can send both MDX and DAX queries.

One aspect that deserves more attention is how to tweak the framework to parameterize DAX queries. The framework was design to parameterize MDX queries with tupples. For example, if you want to parameterize an MDX query by month, you can specify the set NonEmpty( [Date].[Calendar].[Month].Members, [Measures].[Internet Sales Amount] ). Then, the framework executes the set and assigns tupples from the set in random so you don’t just get cached results from the same query.

However, you need to make a small change to the framework to parameterize DAX queries. Because DAX queries doesn’t support the MDX UniqueName syntax for filtering, you can’t parse the UniqueName of the tupple member to extract only the name. Instead, you can use the DAX MID function for this purpose. For example, if I want to filter the Customer[Customer Name] column on the actual name, e.g. Acme, you can use the following expression:

Customer[Customer Name] = MID(“([Customer].[Customer Name].&[Acme])”, SEARCH(“&[“, “([Customer].[Customer Name].&[Acme])”) + 2, SEARCH(“])”, “([Customer].[Customer Name].&[Acme])”) – SEARCH(“&[“, “([Customer].[Customer Name].&[Acme])”) – 2)

Basically, this expression extracts the string “Acme” from ([Customer].[Customer Name].&[Acme]). Since, the customer names will vary. it’s a generic and a rather convoluted expression to extract a string surrounded by “&[” and “])”.

041716_2018_LoadTesting1.jpg

Power BI Hybrid Architecture

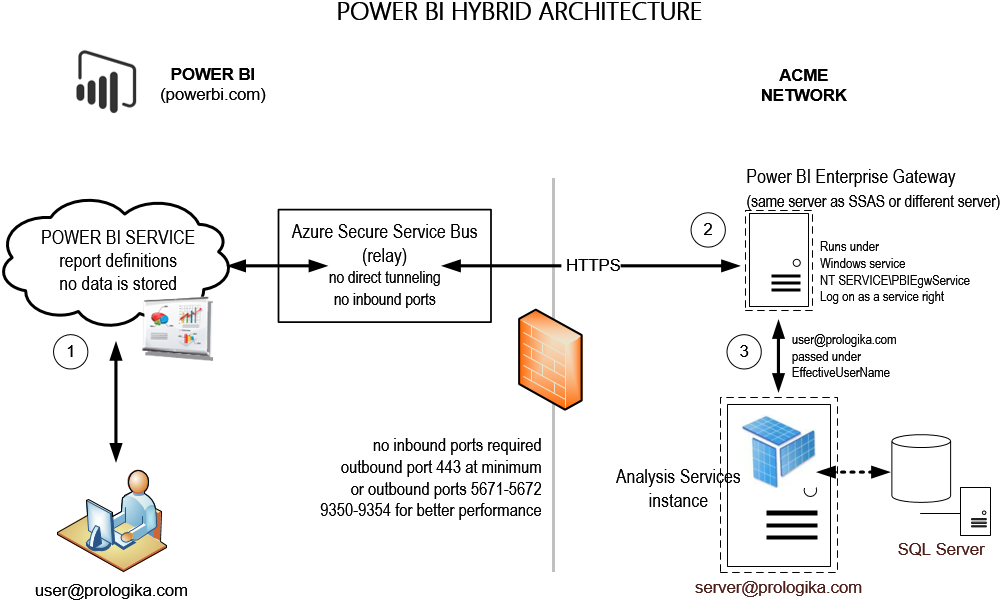
A unique and tremendously useful Power BI feature allows you to implement hybrid solutions where your data remains on premises (SSAS, SQL Server, Oracle, and other data structures) but only report and dashboard definitions are deployed to powerbi.com. This hybrid architecture gives you the best of both worlds: cutting edge cloud-based visualizations with on-premises security, scale, and single version of truth. Since no cloud application can connect directly to your network, a connectivity software, called Power BI Enterprise Management Gateway, acts as a bridge between powerbi.com and your data sources.

I’m wrapping up a Power BI Hybrid Architecture proof of concept (POC) for a large organization and I want to recap some important lessons learned:

  1. I’m really astonished by the roundtrip speed! It’s remarkable that the round trip completes so fast given that powerbi.com (a data center in Virginia for East Cost I believe) connects to a data center in Atlanta. Granted, not much goes across the wire. Power BI sends a DAX query and SSAS sends summarized results. Still, latency is not an issue. As another customer puts it, “the Power BI reports have better performance than our on-premises SharePoint reports”.
  2. Power BI Enterprise Gateway uses the Azure Secure Service Bus relay connection. What this means for you is that you don’t have to open any incoming ports on your company’s firewall. When the gateway establishes an outbound connection, it scans the available outbound ports. If the only port open is 443 (HTTPS), then it uses this port. Because port 443 might be heavily used, you can open outbound ports 5671-5672 and 9350-9354 for better performance. However, I didn’t see any performance degradation with port 443. This is another remarkable performance observation given that this organization has thousands of computers that use this port when connecting to Internet.
  3. The only setup snag I encountered was this organization uses a proxy that is configured for Basic Authentication only and gateway failed to connect on a first try. I had to create a .NET assembly that returns the credentials of an account with permissions to the proxy using the module configuration element. If your organization doesn’t use a proxy or it does, but the proxy supports NTLM security, you won’t have this issue.
  4. The gateway can be installed on the same machine as the data source or another machine. I recommend installing it on a different machine for an additional level of security. Since one gateway can access multiple data sources, a dedicated gateway server makes more sense. Currently, the gateway service is not fault tolerant but you can install another gateway instance on another machine that services the data sources that need to be highly available.
  5. By default, the gateway runs under a NT SERVICE\PBUEgwService account that the gateway setup creates. You can use another Windows account of course. It needs to have a “Log on as service” right and it needs to be a member of the Performance Log Users local group. The gateway should have no issue running as another low-privileged account, such as LocalService.
  6. Besides the setup requirements and limitations when connecting to SSAS, creating a data source requires hardcoding the credentials of a Windows account that has admin rights to SSAS to delegate the user identity via EffectiveUserName so that SSAS data security works. This might present an issue if your organization has a password expiration policy for service accounts (typically this is not the case bus this organization has to comply to regulations and customer service contracts). I suggested to Microsoft to support another option that would allow connecting to SSAS using the gateway service account via NTLM security. This would allow you to use a managed service account for the gateway service whose password expiration is managed by the domain controller.

powerbi-hybrid

Power BI Report Embedding on the Horizon

For years I’ve been harassing Microsoft to support embedding interactive reports connected to SSAS on custom apps. This feature has been sorely missing in the Microsoft BI stack. Yet, it’s a must-have feature that enables a wide range of integration scenarios, such as customer-facing reporting. Imagine your customers being able to ask natural questions for data exploration. This is a killer feature!

It looks like Power BI might finally bring some relief. I while back, I posted an Embedding Reporting feature wish on the Power BI discussion list. It now has 643 votes and it’s one of the most voted for features. Recently, when asked to provide feedback, I communicated to Microsoft how I envision report embedding to work:

  1. Developers must have the ability to embed reports/dashboards in applications. This should be conceptually similar to how they can do this now with ReportViewer. However, instead of an ASP.NET control, I’d imagine REST APIs with jQuery.
  2. The tricky part is security. It is paramount to be able to pass the user identity to on-premises SSAS models. Ideally, we don’t want to ask external users to register in Power BI. Instead, some kind of bulk licensing needs to be supported to allow requests to Power BI to go under a single trusted account but yet pass the user identity to SSAS.
  3. In a nutshell, the external user goes to the customer website and he’s authenticated using whatever authentication mechanism the app uses. Then, a call is made to Power BI to authenticate using a trusted account. When the user requests a report, the call must allow somehow passing the user identity. And, then this identity needs to flow to SSAS. Previously, to achieve this scenario and circumvent the SSAS limitation of supporting Windows security only, developers would add a CustomData connection string to the SSAS connection so that SSAS can use it for row-level security.

Recently, Lukasz Pawlowski (a Senior Product Manager formerly on the SSRS team and now heading the Power BI APIs) responded:

“Quick update here. While it’s not report embedding, we just announced a preview of an API to integrate dashboard tiles into applications. Read about it on the Power BI Developer blog”

So, it looks like the first wave of the embedding APIs has arrived. While it’s not what we need, I think we can expect full-featured embedding to arrive soon.

Microsoft Acquires Datazen to Bring On-premise Mobile BI

Microsoft announced today that it acquired Datazen Software. This is a great news because an on-premise mobile dashboard solution has been a big pain point with Microsoft BI. SharePoint Excel Services and Reporting Services are mobile-friendly but Power View is still Silverlight-based. And, customers have been skeptical about the time it will take for Microsoft to deliver a true mobile-ready on premise solution that complements its cloud-based Power BI.

I haven’t personally used Datazen but its looks very promising especially considering that “In particular, SQL Server customers love Datazen, because it is optimized for SQL Server Analysis Services and the overall Microsoft platform, enabling rich, interactive data visualization and KPIs on all major mobile platforms: Windows, iOS and Android”. And, the price is right: “As of today, SQL Server Enterprise Edition customers with version 2008 or later and Software Assurance are entitled to download the DataZen Server software at no additional cost. This means millions of people around the world will now be able to visualize and interact with data on their mobile devices, using the native mobile apps available at no charge at the respective app stores.”

The Datazen architecture is server-based and installs on Windows Server IIS.

Power BI vNext SSAS Connector and Security Reloaded

To follow up on my previous post on the same subject, a customer was eager to jump on the Power BI->On Prem SSAS bandwagon and try the simplified security model. But “omne initium difficile est” (every beginning is difficult). Their SSAS server was installed on a domain acme.com while their e-mail addresses were using a different scheme, e.g. user@contoso.com, although both server and accounts were under the same acme domain. As we’ve quickly found out, Active Directory had an issue with this setup which manifested with the following error in the SQL Server Profiler connected to SSAS.

“The following system error occurred: The name provided is not a properly formed account name.”

If you see this error, follow these steps to confirm the issue:

  1. Remote in to your SSAS server.
  2. Open Command Prompt and enter:
    Whoami/upn
  3. If you see that your login domain name is different that the e-mail you use to sign up to Power BI, you’ll have the same issue. For example, your e-mail address might be user@contoso.com while whoami might show user@acme.com.

The workaround is to bridge the two identity schemes by adding an alternative UPN suffix in Active Directory Users and Trusts, as Greg Galloway explained here. This of course will require help from your AD administrator (one of the most important persons to befriend on your BI quest) so some coercing is to be expected.

Thanks to Jen Underwood, Will Thompson, Mini Nair and Giri Nair from Microsoft who helped us troubleshoot the issue.