Using Profiler to Trace Azure Analysis Services
Scenario: You use Azure Analysis Services and you want to trace events in the SQL Server Profiler. However, you run the Profiler, connect to AAS, and you get greeted with “Unable to locate trace definition file Microsoft Analysis Services TraceDefinition 15.0.0.xml“. The prompt gives you an option to download the trace definition from the server, but nothing happens. You’ll encounter the same issue if you attempt to access a higher version of AAS or Database Engine from a lower version of Profiler, such as when you install SSMS 2012 on your laptop, but you connect to SQL Server 2016 or higher.
Workaround: While we’re waiting for Microsoft to provide the Azure AS trace definition, you can use this workaround:
- Navigate to the Profiler trace definition folder. In my case this folder is C:\Program Files (x86)\Microsoft SQL Server\140\Tools\Profiler\TraceDefinitions. Copy the latest trace definition file (in my case it was “Microsoft Analysis Services TraceDefinition 14.0.800.xml”) and paste it as Microsoft Analysis Services TraceDefinition 15.0.0.xml. You need admin privileges to do this.
- Start Notepad or Notepad++ with admin rights and open Microsoft Analysis Services TraceDefinition 15.0.0.xml from that folder.
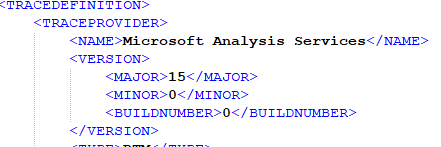
- Change the Major version to 15, minor version to 0, and build number to 0 at the top of the file and save the file.

- If you want the default trace templates so you don’t have to configure the trace from scratch, navigate to the Profiler’s Templates folder (C:\Program Files (x86)\Microsoft SQL Server\140\Tools\Profiler\Templates\Microsoft Analysis Services). Copy the 140 folder and paste it as 150 folder. This folder has the Replay and Standard template definitions.
As Analysis Services evolves, the version number would increase. You can connect SSMS to AAS and check its version in the server properties. In this case, version 15.0.1.245 corresponds to 150. This why the folder name is 150.


