Thanks to the Robert Bruckner’s blog, I’ve learned that Microsoft has published the Reporting Services 2008 Information Aggregator. It is a cool dashboard page that aggregates a variety of resources related to Reporting Services, such as training content, white papers, blogs and more. I’m proud to be featured as an MVP J The page also includes to my most recent books and training videos I’ve authored.
Kudos go to the Reporting Services user education team who worked hard to implement this page. Check out the SSRS aggregator and add it to your favorites.
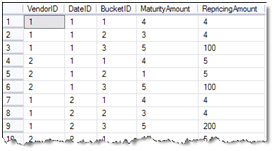
Let’s say you need a way to unpivot the results in the following format which is more suitable for OLAP:
In this way, you eliminate the repeating measure columns with a single column. Here, the BucketID column is introduced so you could join the results to a dimension to let the user cross-tab the results on columns.
Solution
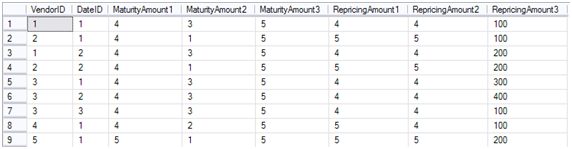
Usually, ETL processes would take care of transforming data in format suitable for analysis especially with large data volumes. However, with smaller fact tables and an OLAP layer directly on top of the operational database, such as having SQL views directly on top of the source database, you may need an ad-hoc approach to unpivot the results. Assuming you are fortunate to have SQL Server 2005 or above, you can use the SQL Server UNPIVOT function to unpivot on multiple columns. The following query does the trick:
SELECT VendorID, DateID, CAST(REPLACE(Maturity, ‘MaturityAmount’, ”) as int) as BucketID,
RepricingAmount1, RepricingAmount2, RepricingAmount3 FROM pvt) p
UNPIVOT
(MaturityAmount FOR Maturity IN (MaturityAmount1, MaturityAmount2, MaturityAmount3)) AS UnPivotedMaturity
UNPIVOT
(RepricingAmount FOR Repricing IN (RepricingAmount1, RepricingAmount2, RepricingAmount3)) AS UnPivotedRepricing
WHERE REPLACE(Maturity, ‘Maturity’, ”) = REPLACE(Repricing, ‘Repricing’, ”)
Notice that a WHERE clause is needed to join the two unpivoted sets so you don’t end up with a Cartesian set. The net result is that the number of rows in the unpivoted dataset is:
Number of Rows in Pivoted (original) Table * Number of Repeated Columns
So, in our case, the dataset will have 9 * 3 = 27 rows.
On Friday, Microsoft released chart controls for Microsoft .NET Framework 3.5. These are re-tooled Dundas .NET chart controls which are now baked in the .NET framework. This is important because you can add the same stunning Dundas chart features to your Windows Forms and ASP.NET applications without external dependencies or licensing fees. It also minimizes your learning curve, as the Dundas controls share the same object model across technologies, e.g. Windows Forms to ASP.NET to Reporting Services.
Currently, only the Dundas chart control has made the cut to .NET. There is a sticky post at the top of the forums that has all of the links. Keep an eye on the PDC announcements today for more BI goodies.
https://prologika.com/wp-content/uploads/2016/01/logo.png00Prologika - Teo Lachevhttps://prologika.com/wp-content/uploads/2016/01/logo.pngPrologika - Teo Lachev2008-10-27 16:09:542016-02-17 10:45:14Dundas Chart Controls for .NET Available
A quick update on my book Applied Microsoft SQL Server 2008 Reporting Services. I am happy to announce that the work on the manuscript is over and the manuscript RTM’d (released to manufacturing). The paper copy should be available on the reseller sites and brick and mortar stores around the publication date (August 15th). Expect the ebook version around that time as well. Of course, the good thing about the ebook version besides being searchable and portable is that it includes color images. As you would probably agree, color is a good thing when you are studying report design. Video demos are even better, of course, which brings me to the next topic.
While waiting, take a look at the book web page that just went live and check the available resources. Among other things, you’ll find two sample chapters (chapters 1 and 3), the book source code, and video demos, which I captured using the awesome TechSmith Camtasia. The videos are bonus material and are an experimental feature. Video demos are provided for a subset of the report authoring practices covered in the book. I am looking forward your feedback about this feature. Enjoy and I hope you don’t mind my thick as a brick accent J
Finally, the book web page includes a link to a discussion list, where you can make comments about the book and ask book-related questions. The new discussion list will replace my Reporting Services in Action discussion list, which will retire at the end of this month after four years of service. I hope you liked my participation and will consider “upgrading” to the new discussion list and book.
Chris Webb, a fellow MVP and MDX guru, who’s blog is a must-read for all SSAS junkies, was kind enough to let me take a look at the Intelligencia Query product he’s been working on for a while with Andrew Wiles. Chris announced the product back in April which is now selling as a commercial offering.
Now, lots of things have been said about the current state of the SSRS-SSAS integration, which is to say the least wanting. In a previous blog, I wrote “In my opinion, the biggest challenge the Microsoft BI initiative faces today is the inadequate support for Analysis Services.” Alas, we won’t witness an improved SSRS-SSAS integration in SQL Server 2008 as Microsoft decided to focus on other areas and priorities.
Rest assured though that Microsoft understands the importance of this integration scenario. I personally have voiced my concerns on a few occasions and have put this on the top of my wish list which I shared with the Reporting Services team. There are good things happening already which make me believe that SQL Server.NEXT (post-SQL Server 2008) will materialize this wish. What’s really needed is Excel-like support of SSAS in Reporting Services, plus calculated members which are already supported.
Then, the question is what to do meanwhile if you target Analysis Services (and you should). One approach is to take the “I’ll stick with Microsoft” approach. This may require you find workarounds for the static schema and other limitations, such as using the Microsoft OLE DB Provider for Analysis Services instead of the built-in SSAS provider. This is not as bad as it seems as little out-of-box thinking usually gets the job done. By the way, I wrote some 50 pages in my next book to cover integrating SSRS with SSAS in as much detail as possible.
The second approach is to look at third-party offerings, such as Radius Producer and Intelligenca Query. What I liked about Intelligenca Query is that it doesn’t require throwing the baby with the water. You can still keep the Microsoft Report Designer but use Intelligenca Query to replace the built-in SSAS provider. This works because just like the built-in provider, Intelligenca Query is implemented as a data extension. I tested Intelligenca Query with SQL Server 2008 and it worked without any issues with the BIDS Report Designer and Report Builder 2.0 (aka Report Designer Preview).
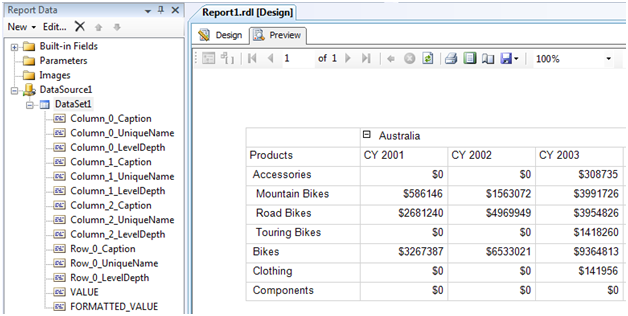
The good thing about Intelligenca Query is that it lets you plug in an arbitrary MDX query. Behind the scenes, it pulls out a little trick where it rewrites the report dataset by transposing columns to rows. Consequently, you have to use the matrix region to rotate the rows back to columns to recreate the original query results. Now, my ideal provider would support a dual mode where I can tell it not to rewrite anything but just to give me the results. Of course, if another dimension member is added, it won’t show up on the report columns (assuming a table with fixed columns) but I can see this being useful for notice users that create ad hoc reports or when the columns are fairly static.
Another thing I liked, of course, about Intelligenca Query is that it eliminates the nagging issue of server aggregates which are the aggregates for the dimension All members. With the built-in provider, you have to explicitly request them by using the Aggregate function but they won’t be retuned if you hand-code your query. Intelligenca Query simply brings them as additional rows. What if you don’t want them, such as when you need a group footer? No problem, just exclude them from the query and group on the rest of the rows.
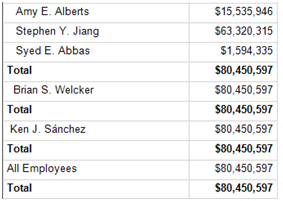
Another cool thing is working with parent-child hierarchies. The MS built-in provider takes this strange design pattern where it dumps all members in a single column, thereby making it virtually impossible to create subtotals per level. With Intelligence Query this issue disappears:
I also liked the graphical query designer which is pretty much in par with the Microsoft graphical MDX Query Designer. On the downside, some outstanding work is required to handle parameters and synchronize the text query with the graphical designer.
If the SSAS built-in provider is driving you nuts, I encourage you to take a look and evaluate Intelligenca Query.
I happy to announce my book “Applied Microsoft Analysis Services 2005” is now available as an Adobe PDF e-book. The first retailer that Google Alerts reported to sell it is Diesel Ebooks. It should soon pop up on all popular ebook retailer sites, such as ebooks.com. The suggested retail price for the ebook version is set to $39.95, which is ten bucks cheaper than the suggested retail price of the paper copy. The ebook is DRM-protected but fully functional with unlimited printing and copying capabilities. The DRM protection is handled by the retailer. Since the distributor is not set up to handle different pricing models, such as buy the paper copy and get the ebook free, there is no discount pricing model for the e-book version at this time.
Also, the same book is now available on Amazon Kindle. Since I don’t have an Amazon Kindle, I don’t know what the Kindle version looks like. Unfortunately, Amazon doesn’t support PDF. They use proprietary software that converts the book to the Kindle native format (AZW). If you buy the Kindle copy, please drop me a note to share your feedback.
I have to admit that my preoccupation with Reporting Services and Analysis Services don’t leave me much bandwidth nowadays to tackle other Microsoft BI (far less third-party) offerings. One of the products I know I need to catch up is the planning component of PerformanceServer, formerly known as Biz#. Fortunately, Nick and Adrian followed up on their The Rational Guide To Planning with Microsoft Office PerformancePoint Server 2007, which I wrote about, with a new book The Rational Guide To Planning with Microsoft Office PerformancePoint Server 2007. Initially, they were planning a single PerformancePoint book but they decided to split it because of book size limitations that the publisher has.
The planning piece of PerformancePoint requires more than solid knowledge of Analysis Services because of its strong financial focus. You need to know quite a bit about budgeting, planning, chart of accounts, and other financial concepts. Fortunately, The Rational Guide To Planning with Microsoft Office PerformancePoint Server 2007 fills in the gap and bridges the implementation and business audiences by providing an essential coverage of the product accompanied with practical examples, all in a portable light-size format.
https://prologika.com/wp-content/uploads/2016/01/logo.png00Prologika - Teo Lachevhttps://prologika.com/wp-content/uploads/2016/01/logo.pngPrologika - Teo Lachev2008-03-15 22:46:212016-02-17 11:33:37The Rational Guide To Planning with Microsoft Office PerformancePoint Server 2007
As you know, business scorecards are the latest BI craze. Nick Barclay was kind enough to send me a copy of his new book Monitoring and Analyzing with Microsoft Office PerformancePoint Server 2007 by Rational Press which he co-authored with a co-worker and friend Adrian Downes. This is one of these relatively-small and very practical books which helps you hit the ground running quickly. As its name suggests, the book focuses only on the monitoring and analyzing piece of PerformancePoint which was previously known as Business Scorecard Manager. Nick and Adrian wrote another book, the Rational Guide to Planning with Microsoft Office PerformancePoint Server 2007, which covers the Biz# portion of the product.
I liked the author style and the practical examples included in the book. The authors show you how to build scorecards from a variety of data sources and deploy them to SharePoint or Reporting Services reports. I didn’t know that you can create a Visio strategy map and hook it to the scorecard. Too bad that the ProClarity stuff didn’t get integrated into BSM. I guess we have to wait for another release to get the cool decomposition tree when you click on a KPI. Until then, Visio strategy maps J
https://prologika.com/wp-content/uploads/2016/01/logo.png00Prologika - Teo Lachevhttps://prologika.com/wp-content/uploads/2016/01/logo.pngPrologika - Teo Lachev2007-12-16 03:59:002016-02-17 11:50:10Relational Guide to Monitoring and Analyzing with Microsoft Office PerformancePoint Server 2007