Posts

Radius Producer "Produces" No-nonsense SSAS Support

In my opinion, the biggest challenge the Microsoft BI initiative faces today is the inadequate support for Analysis Services. The premimum Microsoft reporting tools claim to support SSAS but they all take an idependent view about what features they should support or not. To make things worse, even supported features turn out to be not “supported” enough and subsequenly declared as “by design” or known limitations. This cripples UDM and forces customers to look outside the Microsoft BI stack, hoping to find third-party tools to fill in the gap.

112107_0304_RadiusProdu1

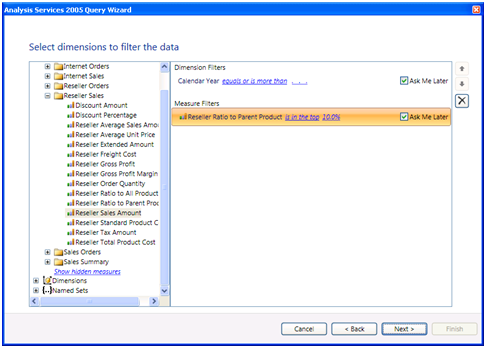
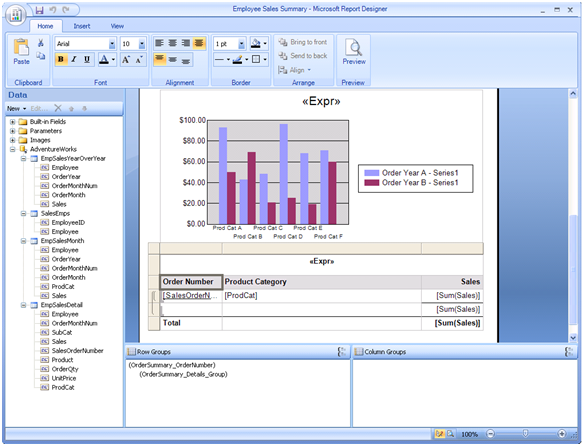
Recently, I had the pleasure to take a look at the pre-release bits of the Radius Producer by 90 Degree Software. Those of you who installed the November CTP of SQL Server 2008 and played with the standalone Report Designer, will undoubtedly find many similarities between both tools, in terms of artchitecture, designer experience, even look and feel. One feature that Radius Producer excells in is end-user reporting from SSAS. For example, the snapshot shows the Radius Producer filtering support which I particularly liked. The user can filter on multiple dimension and measures and the tool provides common filter conditions that business users would appreciate, such as top, bottom, greater than, less than, etc. When the user selects the Ask Me Later option, the filter is promoted to a report parameter. Based on what I’ve seen, Radius Producer generates very clean and efficient MDX although I am yet to test with larger cubes. I was able to produce reports succesfully from both SSAS 2005 and 2008.

Radius Producer is more ambitious than being a reporting tool only. It promotes colleboration among information workers. Users can save queries and report snippets, and subsequently share them on the Radius network. Think Zune but instead of music you share report gadgets. If you are on a lookout for a third-party reporting tool that generates RDL and provides a good support for SSAS, take a moment to evaluate the forthcoming release of Radius Producer.

SQL Server 2008 November CTP Is Out

The November CTP (CTP5) of SQL Server 2008 is out. Here are the most significant BI-related highlights that caught my attention.

Reporting Services

The standalone Report Designer has undergone a major facelift. It now sponsors a shiny Office 2007 ribbon interface. It will surely charm end users who are planning to use the standalone Report Designer for ad hoc reporting. The bad news is that there is still much integration work ahead. For example, the Analysis Services and custom data processing extensions are not integrated yet. Further, only the Dundas chart component has made the CTP5 cut. Nevertheless, I am very excited about the standalone Report Designer and its long-term potential to unite professional and end-user reporting needs.

111907_1814_SQLServer201

Analysis Services

The block computation enhancements debut in CTP5. Based on my experiments, they result in 50-60 percent and more improvement in query response times. For example, a highly inefficient Report Builder query that filters on a measure would take hours with SSSAS 2005. With CTP5 of SSAS 2008, the same query finishes under a minute! Put in highly technical terms, the nastier the query is, the faster it will with SSAS 2008. There are also optimizations in MOLAP write-back that remove the need to query ROLAP partitions although I haven’t given them a try.

Integration Services

CTP5 brings lookup performance enhancements. Are the SSIS guys lazy or what? J

Relational Engine

One BI-related enhancement with a great potential is Change Data Capture (CDC). When enabled, this features tracks changes to data, including inserts, deletes, and updates. This means that ETL process can quickly detect what changes have been made to a given table by just querying the CDC internal tables. For example, you query CDC to return only the new records that have been added to a table after a given data. As you can imagine, this baby will be a welcome enhancement with large data warehouses and can help you optimize the ETL processes.

July CTP of SQL Server 2008 Is Out

July CTP of SQL Server 2008 (Katmai) is out. On the BI side of things:

  1. New SSRS Report Engine
    “Improvements represent the two major infrastructure changes for Reporting Services. Reporting Services enhances the processing engine and rendering extensions to enable new functionality, such as Tablix support, and scalability as well as remove the dependency on IIS. Additionally, new report designer and configuration tool are provided that improve usability and workflow for RS customers.”
  2. Analysis Services Time Series
    This improvement adds a new time series forecasting algorithm (ARIMA: Auto Regressive Integrated Moving Average) to the data mining algorithm suite that provides more stable long term predictions.

TechEd 2007 US Memoirs

I am back from an one-week vacation to Clearwater, Florida followed by TechEd 2007 US in Orlando. Overall, nothing earth – shattering on the BI arena from TechEd 2007. Product groups are between releases so most of the content was SQL Server 2005-based with a few sneak previews of some of the good stuff to come in Katmai.


My presentation attracted a fairly large crowd. Almost 500 folks joined my presentation “Applied Microsoft Reporting Services 2005” which was scheduled for the first breakout slot after the keynote on Monday. Thank you! I’ve made the source code and slides available for download on my website. Courtesy to Marco Russo, I’ve also uploaded a couple of photos to capture the moment of glory.


Now that I can open my mouth about some of the cool features coming up in the Katmai release of Reporting Services that were officially announced, here are the most important ones:


  1. Standalone report designer – both the VS.NET Report Designer and the Report Builder will share the same full-featured designer. Note that “standalone” doesn’t mean “embeddable”. While a post-Katmai release may bring us a designer which can be hosted in a custom application this will probably not happen in Katmai. Sigh…

  2. Tablix region – The table and matrix regions unite and give a birth to a brand new region called tablix. This versatile control can handle it all. By changing a few properties, the tablix can morph itself into a table, crosstab, or list report! The tablix region will enable reports that were not possible or required hacks in the past to get around the matrix limitations, such as stacked columns in a crosstab reports, multiple subtotals, and multiple pivot columns. I wish I had this baby a year ago…

  3. RDL Object Model – The Katmai release will ship with public RDL Object Model. This is a great news for developers (myself included) that need to generate RDL programmatically.

  4. Acquisition of the Dundas RS controls – MS acquired the Dundas chart, gauge, and map for Reporting Services. This will sure spice up the report graphical experience and position MS to compete better with other report vendors.

  5. Acquisition of the Soft Artisans Office Writer technology – This will let business users embed reports in Microsoft Word and Excel documents.

  6. Many designer enhancements – HTML inline support, better designer experience, export to Word 2000-2007, etc.

I hope I haven’t missed something important. The first Katmai CTP build to include some of the new RS enhancement is due in July.


Nothing too exciting on the SSAS side of things as the main team of the next release is “don’t rock the boat”. It will focus mainly on improving the server performance, manageability, and robustness.

The Rational Guide to Microsoft Office Business Scorecard Manager 2005

Nick Barclay is telling us that the book The Rational Guide to Microsoft Office Business Scorecard Manager 2005 that he co-wrote with Adrian Downes is out! You can use BSM to design scorecards that can be published to SharePoint dashboards or SSRS reports. As far as I know, this is the first BSM book which makes it even more appealing.

Designing SQL Server 2005 Analysis Services Cubes for Excel 2007 PivotTables Whitepaper

A bit outdated announcement perhaps but the Office team has released a Designing SQL Server 2005 Analysis Services Cubes for Excel 2007 PivotTables whitepaper. Instead of pestering you with how-to PivotTable questions, now your users can have proper documentation. A great deal of it discusses UDM implementation details but who is to say that you didn’t travel the extra mile… As for me, well I still wait for the Office team to implement a few more goodies like pre-filtering support for large dimension, before I get impressed by Excel 2007 as an SSAS browser.

Excel Web Access Drill-through to SSRS Report

I’ve been having fun lately with a dashboard page which has an Excel Web Access (EWA) web part connected to a PivotTable report. The PivotTable report is nothing to brag about. It displays a few KPI-related measures coming from an SSAS cube. PivotTable was converted to formulas to achieve a free-form report layout. So far, pretty straightforward stuff. That is, until the customer wanted the ability to drill through the chart to see a more detailed view from the cube.

Since to my understanding cross-EWA drillthrough is not possible because Excel Services is not URL-addressable (shame [:@]), I implemented this scenario by allowing the user to drill through from the Excel spreadsheet to an SSRS report. To implement this, I converted the Excel cell to a hyperlink which has the URL address of the SharePoint report using the Excel HYPERLINK function:

=HYPERLINK(“http://” & CUBEVALUE(“<connection name>”,”[Measures].[ServerName]”) & “:8080/ReportServer?http://” & CUBEVALUE(“<connection name>”,”[Measures].[ServerName]”) & “/Reports/ReportsLibrary/Top 50 Customers.rdl&DateCalendar=[Date].[Calendar].[Calendar Year].%26[” & PreviousPeriod & “]&rs:Command=Render”, “Growth in Customer Base”)

There are a few interesting things going on in this nasty expression that deserve more explanation. First, instead of hardcoding the server name, I added a ServerName calculated member to the cube that is mapped to the following SSAS stored procedure:

public static string ServerName() {

     return Context.CurrentServerID;

}

Second, note the URL address of the report. Since SSRS is configured for SharePoint integration, the report path points to the WSS library where the report is deployed. Finally, I had to solve the nasty issue with ampersands in the member names b/c the drillthrough SSRS report takes a member as a parameter. If I just use & the Report Server will choke b/c it will think that it is a parameter placeholder. The hack is to escape & to %26 .

Here is what the link looks when rendered in the browser.

Dundas Chart for SharePoint

Dundas is currently developing a Dundas Chart for SharePoint 3.0/MOSS 2007 (currently in Beta). The chart is designed to work in ASP.NET and supports binding to ADO.NET datasets. A step-by-step tutorial for configuring the chart can be found here.


SQL Server 2005 Service Pack 2 is Born

As an update to my previous post, SQL Server 2005 SP2 is now officially available. The SP2 build is 9.00.3042. A SP2 landing page is available too that includes links to the SP2 release, KB articles, marketing information about the benefits of SP2.


As a personal contributor to Service Pack 2 (mainly in the areas of Reporting Services SharePoint integration and Analysis Services), I hope you enjoy it!

SharePoint Services 3.0 Released

Download location: http://www.microsoft.com/technet/windowsserver/sharepoint/download.mspx

Demo: http://office.microsoft.com/en-us/sharepointtechnology/HA102055631033.aspx