Your Data Warehouse in the Cloud?
I spoke with a customer today that has implemented Salesforce.com. For those who are not familiar with Salesforce, it’s a popular cloud-based, customer relationship management (CRM) product. As it usually happens, just when you’re done with the Salesforce implementation, you’re immediately faced with the challenge of consolidated reporting. It won’t be long before the Vice President of Sales asks you to integrate sales data residing in Salesforce.com and your on-premise data sources. In this case, the customer went to Dreamforce (the Salesforce premier conference) in search for integration options and was advised to solve the report consolidation issue by … migrating their multi-terabyte data warehouse to Salesforce.com!
I’m sure that this approach makes perfect sense to Salesforce.com, but it’s hardly in the customer’s best interest. First, although Salesforce is extensible and you can add custom objects (tables), Salesforce.com is not designed to host relational databases. As far as I know, it doesn’t have ETL tools, an analytical layer, and comprehensive reporting capabilities. Second, even with the enormous recent strides in cloud computing and ever decreasing storage prices, it’s hard to imagine anyone moving a data warehouse to the cloud. It’s just cost-prohibitive to do so. Third, there are data logistics challenges to populate a cloud-based data warehouse, such as to upload gigabytes of data from on-premises databases to the cloud over Internet.
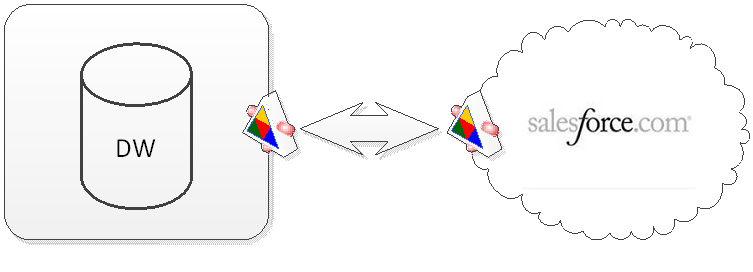
At Prologika, we advise our customers to keep data where it belongs: operational data in the on-premise data warehouse and sales data in the Salesforce.com cloud. By design, the data warehouse is an enterprise repository for storing and consolidating data from operational data sources. We design Integration Services packages to retrieve data by integrating with the Salesforce.com web service and importing the data into the data warehouse. This opens all kinds of interesting data analytical possibilities, such as implementing forecasting reports that combine actual and opportunity revenue.
When the customer requires reports that source data from the data warehouse, we implement a web service end point residing on the customer’s premises that allows Salesforce.com to pull data from the data warehouse and cubes. Or, if it’s acceptable for the sales people to be logged to the customer’s network, we extend Salesforce to pass parameters to operational reports hosted on premise, such in SharePoint. This bi-directional integration allows our customers to keep data where it belongs but allows each system to obtain data from the other system.
Sometimes, it’s better to keep your head and data out of the cloud no matter how modern and exciting this might sound.