Power BI Hybrid Architecture
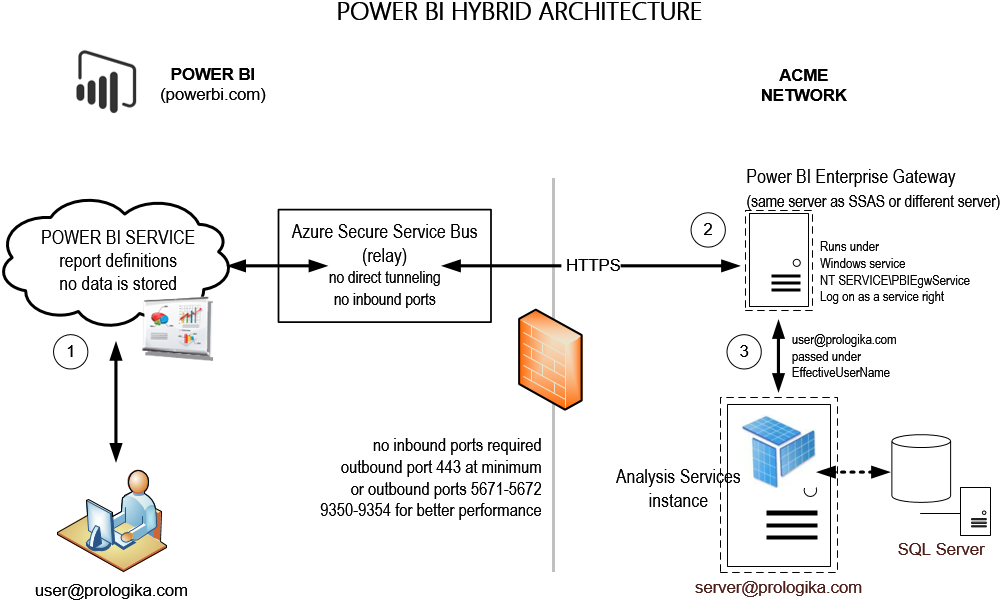
A unique and tremendously useful Power BI feature allows you to implement hybrid solutions where your data remains on premises (SSAS, SQL Server, Oracle, and other data structures) but only report and dashboard definitions are deployed to powerbi.com. This hybrid architecture gives you the best of both worlds: cutting edge cloud-based visualizations with on-premises security, scale, and single version of truth. Since no cloud application can connect directly to your network, a connectivity software, called Power BI Enterprise Management Gateway, acts as a bridge between powerbi.com and your data sources.
I’m wrapping up a Power BI Hybrid Architecture proof of concept (POC) for a large organization and I want to recap some important lessons learned:
- I’m really astonished by the roundtrip speed! It’s remarkable that the round trip completes so fast given that powerbi.com (a data center in Virginia for East Cost I believe) connects to a data center in Atlanta. Granted, not much goes across the wire. Power BI sends a DAX query and SSAS sends summarized results. Still, latency is not an issue. As another customer puts it, “the Power BI reports have better performance than our on-premises SharePoint reports”.
- Power BI Enterprise Gateway uses the Azure Secure Service Bus relay connection. What this means for you is that you don’t have to open any incoming ports on your company’s firewall. When the gateway establishes an outbound connection, it scans the available outbound ports. If the only port open is 443 (HTTPS), then it uses this port. Because port 443 might be heavily used, you can open outbound ports 5671-5672 and 9350-9354 for better performance. However, I didn’t see any performance degradation with port 443. This is another remarkable performance observation given that this organization has thousands of computers that use this port when connecting to Internet.
- The only setup snag I encountered was this organization uses a proxy that is configured for Basic Authentication only and gateway failed to connect on a first try. I had to create a .NET assembly that returns the credentials of an account with permissions to the proxy using the module configuration element. If your organization doesn’t use a proxy or it does, but the proxy supports NTLM security, you won’t have this issue.
- The gateway can be installed on the same machine as the data source or another machine. I recommend installing it on a different machine for an additional level of security. Since one gateway can access multiple data sources, a dedicated gateway server makes more sense. Currently, the gateway service is not fault tolerant but you can install another gateway instance on another machine that services the data sources that need to be highly available.
- By default, the gateway runs under a NT SERVICE\PBUEgwService account that the gateway setup creates. You can use another Windows account of course. It needs to have a “Log on as service” right and it needs to be a member of the Performance Log Users local group. The gateway should have no issue running as another low-privileged account, such as LocalService.
- Besides the setup requirements and limitations when connecting to SSAS, creating a data source requires hardcoding the credentials of a Windows account that has admin rights to SSAS to delegate the user identity via EffectiveUserName so that SSAS data security works. This might present an issue if your organization has a password expiration policy for service accounts (typically this is not the case bus this organization has to comply to regulations and customer service contracts). I suggested to Microsoft to support another option that would allow connecting to SSAS using the gateway service account via NTLM security. This would allow you to use a managed service account for the gateway service whose password expiration is managed by the domain controller.