Posts

Crescent on the Horizon

Now that the official word got out during the Ted Kummert’s keynote today at SQL PASS, I can open my mouth about Crescent – the code name of an ad-hoc reporting layer that will be released in the next version of SQL Server – Denali. Crescent is a major enhancement to Reporting Services and Microsoft Self-Service BI strategy. Up to now, SSRS didn’t have a web-based report designer. Denali will change that by adding a brand new report authoring tool that will be powered by Silverlight. So, this will be the fifth report designer after BIDS, Report Builder 1.0 (not sure if RB 1.0 will survive SQL 11), Report Builder 3.0, Visual Studio Report Designer.

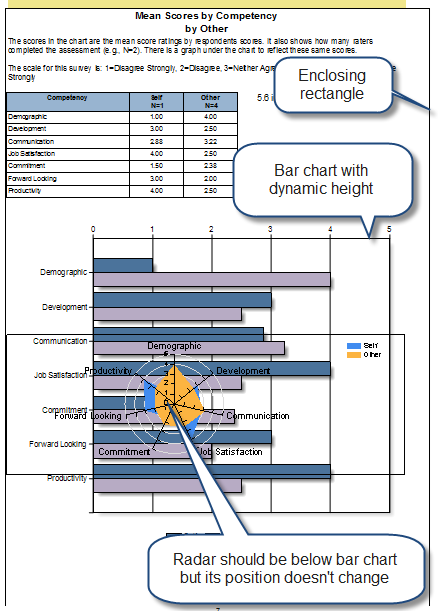
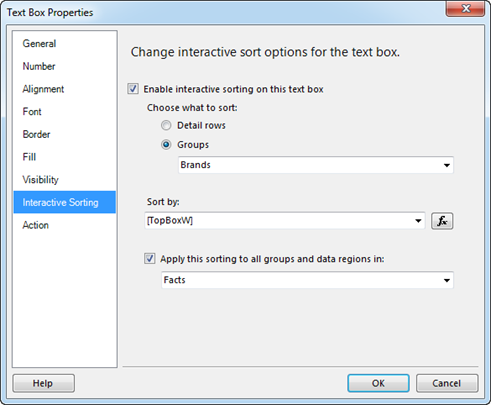
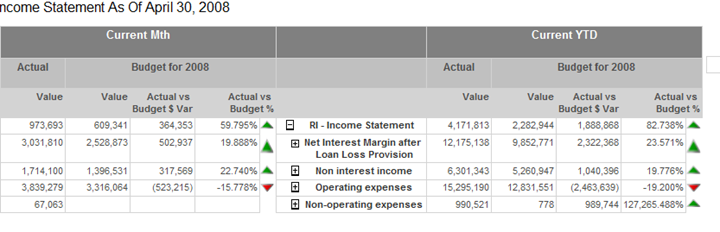
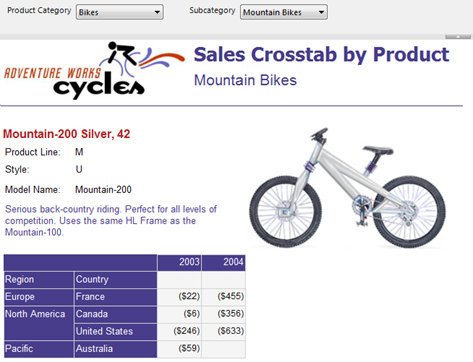
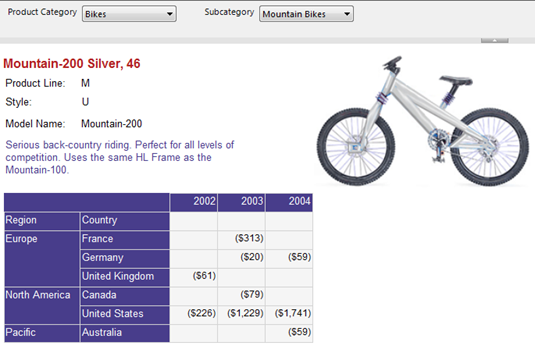
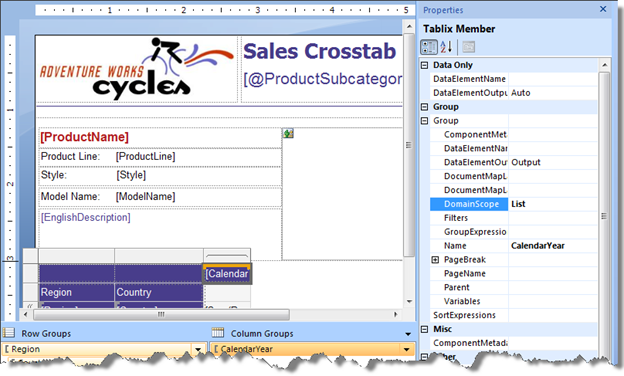
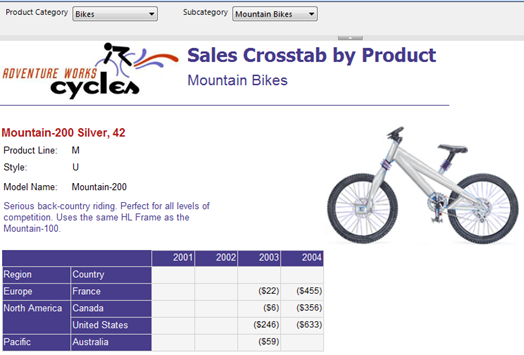
Besides brining report authoring to the web, what’s interesting about Crescent is that it will redefine the report authoring experience and even what a report is. Traditionally, Reporting Services reports (as well as reports from other vendors) have been “canned”, that is, once you publish the report, its layout becomes fixed. True, you could implement interactive features to jazz up the report a bit but changes to the original design, such as adding new columns or switching from a tabular layout to a crosstab layout, requires opening the report in a report designer, making the changes, and viewing/republishing the report. As you would recall, each of the previous report designers would have separate design and preview modes.

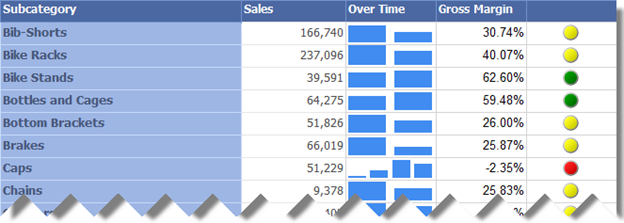
Crescent will change all of this and it will make the reporting experience more interactive and similar to Excel PivotTable and tools from other vendors, such as Tableau. Those of you who saw the keynote today got a sneak preview of Crescent and its capabilities. You saw how the end user can quickly create an interactive report by dragging metadata, a-la Microsoft Excel, and then with a few mouse clicks change the report layout without switching to design mode. In fact, Crescent doesn’t have a formal design mode.

How will this magic happen? As it turns out, Crescent will be powered by a new ad-hoc model called Business Intelligence Semantic Model (BISM) that probably will be a fusion between SMDL (think Report Builder models) and PowerPivot, with the latter now supporting also relational data sources. The Amir’s demo showed an impressive response time when querying billion rows from a relational database. I still need to wrap my head around the new model as more details become available (stay tuned) but I am excited about it and the new BI scenarios it will make possible besides traditional standard reporting. It’s great to see the Reporting Services and Analysis Services teams working together and I am sure good things will happen to those who wait. Following the trend toward SharePoint as a BI hub, Crescent unfurtantely will be available only in SharePoint mode. At this point, we don’t know what Reporting Services and RDL features it will support but one can expect tradeoffs given its first release, brand new architecture and self-service BI focus.

So, Crescent is a code name for a new web-based fusion between SSRS and BISM (to be more accurate Analysis Services in VertiPaq mode). I won’t be surprised if its official name will be PowerReport. Now that I picked your interest, where is Crescent? Crescent is not included in CTP1. More than likely, it will be in the next CTP which is expected around January timeframe.

DynamicHeight Bug

The chart region in Reporting Services 2008 introduced the ability to dynamically size charts by setting the DynamicHeight and DynamicWidth properties, as Robert Bruckner explained in his blog. This feature is really useful and I hope one day it makes to the other regions as well. A customer recently reported an issue with their reports where regions would overlap when the report is previewed in Print Layout mode or exported to a hard page renderer, such as PDF. For example, in the report below the radar chart is positioned after the bar chart in RDL. However, in Print Layout preview the radar chart overlaps the bar chart. The customer tried every possible combination to enclose one or more regions in rectangles which helped avoiding the overlapping issue to some degree but introduced other issues.


After some digging, I discovered that the issue is caused by the fact that the bar chart is configured for dynamic height and managed to confirm that this is a bug. I will post an update when I learn more. Meanwhile, one possible workaround is to re-arrange the report so the region with dynamic height (hopefully, it’s only one) appears last on the report.

UPDATE (9/18/2010)

Robert Bruckner provided the following workaround which fixed the DynamicHeight issue for me:091610_1142_DynamicHeig1

1. Add a table with a single static cell (one row and one column).

2. Delete the table Details group.

3. Nest the chart in the table.

Yet Another Report Timeout Solved

Every now and then, I run into mysterious report timeouts. This time the client had a farm of two report servers integrated with MOSS with long running reports that would time out after two minutes or so. Normally, you shouldn’t have such report monsters but life is not perfect, right? The client did a due diligence and had checked/changed every possible timeout setting, including:

  1. Report Processing Timeout in the Reporting Services Server Defaults settings in SharePoint Central Administration.
  2. The httpRuntime settings on all SharePoint farm servers’ web.config files:

    <httpRuntime maxRequestLength=”51200″ executionTimeout=”9000″ />

  3. The “databaseQueryTimeout” value in the RSReportServer.config file from 120 to 900 (15 minutes).

    <Add Key=”DatabaseQueryTimeout” Value=”900″/>

  4. The connection timeout in IIS for the web site on each MOSS server from 120 to 240 seconds.

Alas, no help. Reports would still time out. After much investigation, we discovered a server timeout setting on the load balancer which was set for 2 minutes. After increased it to 15 minutes, the problem went away. So many timeout settings, so little time…

Want more timeout tips? Check out this blog which I wrote four years ago.

Interactive Sorting and Matrix

A customer requested the ability to interactively sort a matrix on rows and columns. When they click the sort indicator in a row, the matrix should sort columns based on that row. For example, if the first rows is clicked and we are in an descending sort mode, the following screenshot shows the desired behavior.

062010_1331_Interactive1

When they click on a column sort, all row groups would sort within the column clicked. Sounds simple? I’ll be quick to point out that interactive sort is currently not supported directly inside a matrix with dynamic row groups and column groups. The only supported scenario for interactive sort with matrix is a sort indicator in the matrix corner which sorts based on overall column aggregates when a dynamic row group is present. That case is supported because the interactive sort doesn’t reach across from the column to the row axis of the matrix; it just sorts column groups relative to each other based on the overall aggregate of an entire column group instance. Robert Bruckner explains this in the discussion forum and provided a sample report.

So, column sort is out of the question unless you get really innovative and post back to the report by following the approach I presented in my Remembering Report Parameters blog and change the actual query once you know the row and column coordinates. As far as sorting on rows, I got this working somewhat by making the following changes.

062010_1331_Interactive2

I set the Choose What To Sort option to the name of the column group, Sort By to the data field (measure), and Apply This Sorting to the name of the dataset. I said this works “somewhat” because a subsequent sort on another row doesn’t work. The user must refresh the report to go back to unsorted state before they click on another row.

It will be nice if tablix tells you upfront that this isn’t supported so folks don’t trash time thinking that they didn’t get the options right.

Attend One BI Training Class – Get One Consulting Hour Free!

I am back from vacation in Florida and I am all rested despite the intensive sun exposure and the appearance of some tar from the oil spill. I have scheduled the next two runs of my online training classes:

Applied Reporting Services 2008 Online Training Class
Date: June 28 – June 30, 2010
Time: Noon – 4:30 pm EDT; 9 am – 1:30 pm PDT

Applied Analysis Services 2008 Online Training Class
Date: July 7 – July 9, 2010
Time: Noon – 4:30 pm EDT; 9 am – 1:30 pm PDT

Yes, I am also tossing in an hour of consulting with me to spend it any way you want absolutely FREE! This is your chance to pick up my brain about this nasty requirement your boss wants you to implement. So, sign up while the offer lasts. Don’t forget that you can request custom dates if you enroll several people from your company.

Fixing Indicator Images

Indicators, a new feature of Reporting Services 2008 R2, let you show images for state values on your reports and avoid using custom images and expressions. Sean Boon’s recent blog shows you how to scale the indicator images. One annoying issue business users reported when working with indicators is that the indicator image stretches if the text grows and spills to the next row. For example, on the report below the second row spans two lines and its indicator images are stretched vertically.

052110_2222_FixingIndic1

Unfortunately, the indicator region doesn’t have a property to “fix” the image size. The only workaround for now is to enclose the entire indicator region in a rectangle: a kludgy hack especially for business users.

Upgrading To Report Viewer 2010

Visual Studio 2010 ships with updated ReportViewer controls which Brian Hartman discusses in his blog. One issue I recently run into with the Visual Studio 2008 ReportViewer ASP.NET control with a chart configured for a dynamic height (DynamicHeight property) where the chart image wouldn’t size properly. I found that the issue got fixed in the Visual Studio 2010 ReportViewer. However, in my case we weren’t ready to move to Visual Studio 2010 yet. This is what I had to do to upgrade the web application to use the Visual Studio 2010 ReportViewer control:

  1. Install the Report Viewer 2010 redistributable from http://www.microsoft.com/downloads/details.aspx?FamilyID=a941c6b2-64dd-4d03-9ca7-4017a0d164fd&displaylang=en. The setup program will install the Visual Studio 2010 ReportViewer assemblies in GAC as version 10.0.0.0 assemblies.
  2. Updated the web page as follows (changes in bold):


<%@ Page language=”c#” Codefile=”Demo.aspx.cs” AutoEventWireup=”false” Inherits=”Prologika.Demo” %>

<%@ Register Assembly=”Microsoft.ReportViewer.WebForms, Version=10.0.0.0, Culture=neutral, PublicKeyToken=b03f5f7f11d50a3a” Namespace=”Microsoft.Reporting.WebForms” TagPrefix=”rsweb” %>

<!DOCTYPE html PUBLIC “-//W3C//DTD XHTML 1.0 Transitional//EN” “http://www.w3.org/TR/xhtml1/DTD/xhtml1-transitional.dtd”>

<html xmlns=”http://www.w3.org/1999/xhtml”>

    <head runat=”server”>

        <title>Demo</title>

    </head>

    <body>

        <form id=”form1″ runat=”server”>

            <div>

        <asp:ScriptManager ID=”ScriptManager1″ runat=”server”></asp:ScriptManager> <!–Required for AJAX –>

            <rsweb:ReportViewer ID=”reportViewer” runat=”server” Height=”100%” Width=”100%” Font-Names=”Verdana” Font-Size=”8pt”
ProcessingMode=”Remote” InteractiveDeviceInfos=”(Collection)” WaitMessageFont-Names=”Verdana” WaitMessageFont-Size=”14pt”>

</rsweb:ReportViewer>

</div>

</form>

    </body>

</html>  

  1. In web.config, replace all 9.0.0.0 version references to Report Viewer to 10.0.0.0.

Of course, if you have Visual Studio 2010, it will take of care of making the required changes for you. Finally, by upgrading to the 2010 ReportViewer as an added bonus besides fixing the dynamic height issue, you will also get the new AJAX support which eliminates page reposts and improves the end user experience.

Synchronizing Reporting Services Groups

One new R2 feature that I discovered while reading the Reporting Services Recipes book, is group data synchronization. Consider the following report (download the two sample reports here):

050310_2342_Synchronizi1

In this report, the matrix region is nested inside a list region. The list region pages (groups) on product while the nested matrx region displays the sales for the current product grouped by region and year. As you can see, Mountain-200 Sliver, 42 has data for years 2003 and 2004 but if you move to the next page, you will see that Montain-200 Silver, 46 has sales for 2002, 2003, and 2004.

050310_2342_Synchronizi2

What if you want to synchronize the instances of the matrix region to return the same number of columns, which in this case would it all available years in the dataset? In R2, this takes a few clicks.

  1. In design mode, click anywhere inside the nested matrix region so the Groups pane shows its groups.
  2. Select the CalendarYear column group on which the matrix region pivots.
  3. Expand the Group section in the Properties window and enter the name of the outer region in the DomainScope property. In this case, the outer region is the list region whose name is List.

050310_2342_Synchronizi3

Now, when you run the report, all instances of the matrix region are synchronized and have the same number of columns irrespective of the fact that they might not have data for given years.

050310_2342_Synchronizi4

DomainScope is similar to expression scope but not the same. DomainScope can be set on a group leaf member only. So, if the matrix region was grouping on years and quarters, you can synchronize quarters only in which case each year would show four quarters. You cannot synchronize the Year level because it’s a parent group. In addition, the domain scope can be an outer group or region. Unlike expression scopes, you cannot synchronize on a dataset.

Group synchronization comes also handy when you work with sparklines. For example, the following report includes an Over Time column that shows a bar sparkline for product category sales over years.

050310_2342_Synchronizi5

As you can see, the Caps category has sales for four years (The AventureWorksDW2008 database has data for years 2001-2004), while Bib-Shorts category has data for two years. However, the sparklines groups are not aligned. For instance, you can’t tell which two years Bib-Shorts have sales for. To fix this:

  1. Double-click the sparkline region to show the Chart Data window.
  2. Click the CalendarYear group and set the DomainScope property to the name of the containing tablix region, Tablix1 in this case.

050310_2342_Synchronizi5

Now, when you run the report, you’ll see that the sparkline group ordinal position reflects the year. Thus, knowing the range of available years (2001-2004) which for clarity you can display on the report, e.g. as a subtitle, Bib-Shorts have data for years 2002 and 2003, while Bike Racks have data for 2003 and 2004.

050310_2342_Synchronizi7

Book Review – Microsoft SQL Server Reporting Services Recipes

This is a review of the latest addition to the long repertoire of Reporting Services books – Microsoft SQL Server Reporting Services Recipes (ISBN: 978-0-470-56311-3). When you learn a new technology you suggest you pick up several books covering this product because every author writes from his own experience. Thus, even books covering the same technology are not competing by completing each other. Some books target novice users, others are more advanced; some have a strong practical connotation while others are designed to be used more as a reference.

In my opinion, this book will benefit mainly readers who have worked with Reporting Services and have already some report authoring experience under their belt. If you fit this profile, you probably find yourself occasionally wanting a report sample that addresses a specific requirement, a tip for better implementation, or a trick to get around a given limitation. Continuing this line of thought, another title for this book might have been “Reporting Services Tips and Tricks”.

Two author names appear on the book cover – Paul Turley and Robert Bruckner – and both names should be familiar to you. Both authors have been heavily involved with Reporting Services since its inception. Paul is a SQL Server MVP and BI architect for Hitachi Consulting. Robert is a technical lead with the Reporting Services team and when he speaks I take a note. Both authors have helped the community tremendously by answering questions on the Reporting Services discussion list, writing and blogging about Reporting Services, and speaking at industry events. Some of the book material has been contributed by other Hitachi employees and SQL Server experts. The foreword is written by Thierry D’hers – Group Program Manager with the Reporting Services team.

The good thing about this book is that it’s not tied to a particular release of Reporting Services. What I particularly liked is that in some cases the authors have provided examples that work with previous editions of Reporting Services, coupled with versions that benefit from the latest features found in 2008 or R2. The book is organized in the following parts:

  • Introduction (80 pages) – Provides the necessary foundation for report authoring.
  • Part 1: Columnar and Grouped Reports (50 pages) – This part covers features that every report author should know, including alternative row colors, dynamic groups, conditional column visibility, and resetting page numbers.
  • Part 2 : BI Dashboards and Elements (30 pages) – This is where you would learn to work with indicators, sparklines, charts, and other elements to author dashboard pages that are becoming increasingly popular. You will also learn interesting tips to integrate your reports with Analysis Services.
  • Part 3: Chart and Gauge Reports (60 pages) – Think of this part as how to get the most out of the Reporting Services data visualization features. It walks you through the cornucopia of chart types that SSRS 2008 made possible, such as histogram, Peretto, bullet graphs, and gauges. It teaches you how to enhance these charts with custom color palettes and exception highlighting.
  • Part 4: Interactive Reporting (40 pages) – Reporting Services has supported interactive features since the beginning, such as drillthrough, toggled visibility, links, bookmarks, etc. This part takes the interactive features to the next level by showing you how to implement conditional linking, breadcrumbs, dynamic pivoting and document maps.
  • Part 5: Integrated Reporting Applications (35 pages) – This part shows you how to build report solutions that go beyond a single report, such as conditional subreports, changing the data behind the report, and embedding reports in .NET applications.
  • Part 6: Enhanced Report Content (100 pages) – This part covers advanced report authoring techniques, including mailing labels, barcodes, custom aggregation, dynamic page breaks, external images, checkbox list and mapping (a new feature of R2).
  • Part 7: Filtering and Parameterization (70 pages) – Report parameters is one area that takes a lot of criticism from the community and it’s one of the weakest links of Reporting Services. The authors present several workarounds for common requirements and limitations, such as advanced filtering, handing multi-valued parameters, top ranking, and custom sorting.
  • Part 8: Custom and Dynamic Data Sources (30 pages) – This section shows advanced techniques for data retrieval, such as obtaining data from a web service, SharePoint lists (2008 and R2), and Dynamics AX.
  • Part 9: Games (15 pages) – Now that you’ve learned all these cool tricks, it’s time to chill out. If Xbox is not cool anymore, Reporting Services is here for you to play and delight your users with games such as hangman, and sea battle. Hallo is coming soon… just kidding.

In a nutshell, pick up this book. You’ll find yourself reaching for it on a regular basis.

043010_2244_BookReviewM1

Feeding Reports by Code

In a previous blog, I introduced one of the new SSRS 2008 R2 feature: reports as data feeds. As I said, the R2 release will include a new Atom Data Feed renderer to produce an Atom service document (*.atomsvc) which defines a feed(s) per data region. I also said that the main scenario for report feeds was to let the PowerPivot add-in for Excel (previously known as Gemini) consume report data. Recently, I’ve watched the interesting Pablo Castro’s “ADO.NET Data Services: What’s new with the RESTful data services framework” presentation which got me inspired to find a way to consume a report data feed programmatically outside PowerPivot. Since the Atom feed format is pre-defined, a custom application could benefit from this scenario to retrieve and manipulate the report data. In this case, an atom feed may be preferable than other format, such as CSV, because data is exposed as properties instead of columns.

So, I embark on a journey to write a small Silverlight app, RSFeedReader, that reads and displays a report feed. You will need Visual Studio 2010 to open the RSFeedReader source code. Before running the application, you may need to deploy the clientaccesspolicy.xml file included in the source to the IIS root, such as c:\inetpub\wwwroot or C:\inetpub\wwwroot\wss\VirtualDirectories\80 if you have SharePoint installed on port 80, to grant the application rights to connect to Reporting Services. If you don’t, Silverlight would treat the application URL, which runs under the local ASP.NET IIS server, and Report Server URL as two different domains and it will throw a security exception.

You can enter a report feed in the textbox and hit Fetch. The data feed results are shown in the grid. Similar to PowerPivot, each row represents a row in the report data region but the properties are stacked vertically instead of horizontally. The first column shows the entry identifier which identifies the row in the data region and the second column shows the values in that row. The Generating Data Feeds from Reports BOL topic covers the technical details of report feeds pretty well. Basically, the feed URL must include a unique identifier which you obtain from the Atom service document when you export the report to the Atom Data Feed format. The default feed URL points the matrix region in the Company Sales report although you can’t tell this from the feed URL. Again, you need to get the DataFeed identifier for the region from service document after exporting to Atom. If you request the report data feed in the browser, you will see the resulting XML. The most interesting information is included in the m:properties element.

Unlike SharePoint, Reporting Services doesn’t provide a WCF endpoint, such as ListData.svc, so you can’t generate a Visual Studio proxy (unless you do it manually). Instead, RsFeedReader, uses WebClient to submit the URL request to Reporting Services to obtain the feed.

protected void LoadFeed(string uri)

{

WebClient wc = new WebClient();

wc.OpenReadCompleted += new OpenReadCompletedEventHandler(wc_OpenReadCompleted);

Uri feedUri = new Uri(uri, UriKind.Absolute);

wc.OpenReadAsync(feedUri);

}

private void wc_OpenReadCompleted(object sender, OpenReadCompletedEventArgs e)

{

if (e.Error != null)

{

txtFeedLoc.Text = “Error load report data feed. “ + e.Error.Message;

return;

}

using (Stream s = e.Result)

{

SyndicationFeed feed;


using (XmlReader reader = XmlReader.Create(s))

{

// read the feed

feed = SyndicationFeed.Load(reader);

var posts = from item in feed.Items

select new FeedEntry(item.Id, (XmlSyndicationContent)item.Content);


// show feeds in grid

dGrid.ItemsSource = posts;

dGrid.Visibility = Visibility.Visible;

}

}

}


Once the asynchronous call completes, RsFeedReader loops through the feed entry elements and populates a collection of FeedEntry objects which I bind to the grid. The FeedEntry class parses the content element of the entry (where the properties are located) and exposes them as a ContentProperties object (not shown) which I bind to the nested grid in the LoadingRow event of the outer grid.

It probably won’t be long before various custom applications start popping up that lets end users subscribe to feeds, such as to let the end user get notified when report content changes.