Posts

Running ReportViewer Under Trusted Account

Scenario: You have an Internet-facing web application that uses the Visual Studio ReportViewer control to render reports. The application takes care of authenticating the users. You want all report requests to the report server to go under a single (trusted) Windows account. There are at least two approaches to implement this scenario:

Basic Authentication

You can configure ReportViewer for basic authentication by implementing the Microsoft.Reporting.WebForms.IReportServerCredentials interface, as follows:

[Serializable]

public class MyReportServerCredentials : IReportServerCredentials

{

public MyReportServerCredentials()

{

}

public WindowsIdentity ImpersonationUser

{

get

{

return null;

}

}

public ICredentials NetworkCredentials

{

get

{

return new NetworkCredential(

ConfigurationManager.AppSettings[“reportUser”],

ConfigurationManager.AppSettings[“reportPassword”]

, “<your domain here>” – comment out this line if a domain account is used as a trusted account

);

}

}

public bool GetFormsCredentials(out Cookie authCookie, out string user, out string password, out string authority)

{

authCookie = null;

user = null;

password = null;

authority = null;

return false;

}

}

Specifically, you need to implement the NetworkCredentials property of IReportServerCredentials. In my case, I read the trusted account credentials from web.config. Once IReportServerCredentials is implemented, you need to configure ReportViewer to use it. This takes one line of code:

reportViewer.ServerReport.ReportServerCredentials = new MyReportServerCredentials();

The advantage of using IReportServerCredentals if flexibility. You can retrieve the account credentials from any place, such as security service, configuration file, database, etc. In addition, the impersonation is scoped for ReportViewer only. Other network calls made by the applications are unaffected.

Process Identity

The issue with IReportServerCredentals is the application must deal with the credentials of the trusted account, including the password. For added level of security, I try my best to avoid handling passwords and use Windows authentication whenever I can. Therefore, my preferred approach is to change the process identify of the web application. One way to do this is to change the identity of the IIS application pool the web application is running under, as follows:

  1. If you don’t have a domain account to use as a trusted account, create a new domain account.
  2. On the web server, add the account to the IIS_WPG local Windows group to give it the necessary rights to be used as an application pool account.
  3. In the IIS Manager, expand the server name, right-click the Application Pools folder, and click New Application Pool.
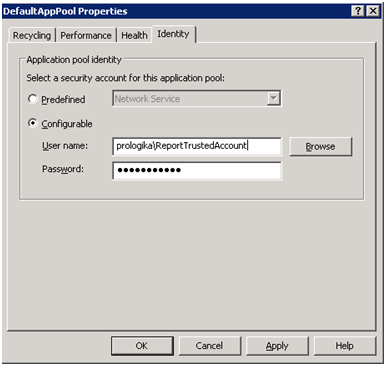
  4. Give the new pool a name. In the pool Properties page, click the Identity tab, select the Configurable option, and enter the credentials of the trusted account.121609_0031_RunningRepo1
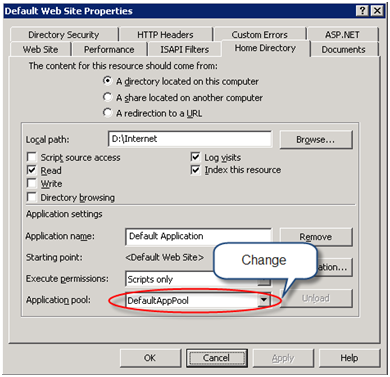
  5. Open the web application properties and change its application pool to the pool you just created.121609_0031_RunningRepo2
  6. If present, remove <identity impersonate=”true”/> element from the application web.config file so the network calls are made under the process identify instead of the anonymous user account, such as IUSR_<MACHINE_NAME>.
  7. At this point, if you run the web application, you may get a permission error because the domain account doesn’t have the necessary rights to specific folders, such as the web application folder and the temp folder. Using Windows Explorer, grant the domain account (or IIS_WPG group) rights to these folders. The error message should include the path of the folder you need to grant access to.
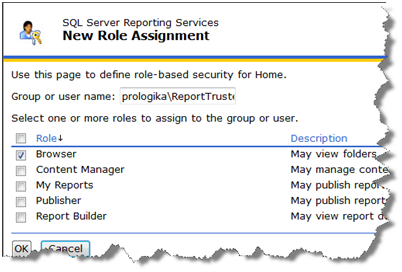
  8. Finally, use the Report Manager to grant the necessary rights to the trusted account, such as Browser, to the required folders.121609_0031_RunningRepo3

SharePoint List Data Extension

R2 brings several SharePoint enhancements, including:

  • Support for multiple SharePoint zones – Previously, SSRS supported access from SharePoint URLs in the default zone, as I explained before.
  • Support for the SharePoint Universal Logging service – Reporting Services introduced a new server interface called IRSSetUserToken. When this interface is implemented, the report server calls the UserToken Set property on this interface and passes the SharePoint user token to the data extension.
  • Scripting with the rs utility – The rs utility now supports servers configured in SharePoint integrated mode. This lets you create scripts that automate management tasks that target report servers in SharePoint mode.
  • New SharePoint List Data Extension – Lets you report from SharePoint lists

The last on the list, the new SharePoint List data extension, probably picked up your interest and deserves more explanation. Previously, if you had to use the XML Data Provider to call the SharePoint web service if you wanted to report off SharePoint lists. The new extension simplifies this by supporting SharePoint lists natively. But before you get too excited about it, I have to dampen your enthusiasm by mentioning two limitations:

  1. The extension supports querying a single list only.
  2. It doesn’t support folders if the list organizes items in folders.

The SharePoint List data extension is supported with both modes – native and SharePoint integrated. It supports Windows SharePoint Services 3.0 and 2010, as well as MOSS. Next, I’ll demonstrate the SharePoint List extension by setting up a dataset that retrieves items from the Issues list of a SharePoint site. The SharePoint list extension is available both in the BIDS Report Designer and Report Builder 3.0. For the purposes of this demo, I’ll use the BIDS Report Designer.

Configuring the data source

Start by setting up the data source as you would normally do when you author a report.

  1. Set up a data source that uses the Microsoft SharePoint List provider.
  2. In the Connection String field, enter the URL of the SharePoint site that has the list you want to query.
  3. Switch to the Credentials tab and select the Use Windows Authentication option. Click OK to close the Data Source Properties dialog.

112409_1416_SharePointL1

Configuring the dataset

Once the data source is in place, the next steps will be to set up a dataset. The SharePoint List data extension supports a graphical query designer that lets you select and filter a list.

  1. Add a new dataset that uses the data source you’ve just created. On the Dataset Properties, click the Query Designer button.

Report Designer loads the graphical query designer. The SharePoint Lists pane shows all lists in the library. You can check a list to get all fields of the list or select individual fields. You can hover on a field to see additional properties as tooltips, such as Name, Identifier, Field Type and Hidden properties.

You can also filter the list. In this case, the Issues list is associated with a My Issues view. Since I don’t have any issues assigned to me, I had to overwrite the list filter by supplying a non-empty query filter. For demo purposes, I decided to set up a filter where the Title column contains the word “parameter” and the Modified date is after 10/1/2009.

112409_1416_SharePointL2

  1. Click the Run Query button to execute the query and see the data and the OK button to close the Query Designer and generate the dataset.

In case you are curious what the actual query looks like, click the Edit As Text query button. If you want to get all fields, the query can omit the ViewFields element.

<RSSharePointList xmlns:xsi=”http://www.w3.org/2001/XMLSchema-instance” xmlns:xsd=”http://www.w3.org/2001/XMLSchema”>

<ListName>Issues</ListName>

<ViewFields>

<FieldRef Name=”ID” />

<FieldRef Name=”ContentType” />

. . .

</ViewFields>

<Query>

<Where>

<And>

<Contains>

<FieldRef Name=”Title” />

<Value Type=”Text”>parameter</Value>

</Contains>

<Gt>

<FieldRef Name=”Modified” />

<Value Type=”DateTime”>2009-10-01T00:00:00</Value>

</Gt>

</And>

</Where>

</Query>

</RSSharePointList>

The SharePoint List data extension is a new R2 feature that simplifies the process of authoring reports from SharePoint lists. Although it doesn’t support all features of third-party data extensions for SharePoint, it’s a welcome enhancement that lets you retrieve and filter items from a single SharePoint list.

Report Parts

The major new R2 feature that debuts in CTP 3 (November CTP) of SQL Server 2008 R2 Reporting Services is report parts. A report part is a fragment of a report definition that you can publish to the report server to facilitate best practices and reuse. Just like a developer can refactor and share some piece of code, the report author can re-factor a portion of a report and publish it to the server so that end users can use it as it-is. The following report items can be published as report parts:

  • Charts
  • Gauges
  • Images
  • Maps
  • Parameters
  • Rectangles
  • Tables
  • Matrices
  • Lists

A notable exception to this list is page headers and footers which are probably the most likely candidates for reuse but at this point they didn’t make the list. It’s important to note that if a data region uses a report-specific dataset (not a shared dataset), publishing the region as a report part will publish its dependent dataset. Report parts can best understood by example, so let’s walk through the workflow of publishing, using, and changing a report part.

Publishing report parts

You can use the BIDS Report Designer or Report Builder 3.0 to publish a report part. The following steps assume you use Report Designer. Let’s say I decided that the tablix with sparklines, which I discussed in a previous blog, is a darn good and it should be promoted as a published report part that other users could enjoy for educational or other purposes.

  1. Start by setting the server folder where report parts will be published on deploy. In the project properties, set the TargetReportPartFolder (a new deployment setting) to the name of the server folder, such as Report Parts, or a SharePoint library URL for SharePoint integrated mode.
  2. With the report open in design mode, expand the Report main menu and click Publish Report Parts. If you use Report Builder 3.0, click the Report Builder 3.0 button (the round button in the topmost left area) and select Publish Report Parts.
  3. The Publish Report Parts dialog box shows the items on the report that are supported as report parts. Check the Tablix report item.
  4. You can rename a report part by double-clicking its name and typing the new name in place. Click the arrow next to it to expand the Tablix section. Enter a description, such as “A table with sparklines” and click OK to close the dialog box.

112409_0139_ReportParts1

5.  So far, you have configured which items will be promoted to report parts but you haven’t actually published them. To do so, you need to publish the containing report. In Solution Explorer, right-click the report and click Publish.

At this point, you should see messages in the BIDS Output Window informing that the report and the report parts you defined are being published.

Deploying report part ‘Tablix’ to ‘/Report Parts’…

Deploying report parts complete — 1 succeeded, 0 failed, 0 skipped

6.   Open Report Manager (or SharePoint) and navigate to the Report Parts folder. You should see the Tablix report part.

112409_0139_ReportParts2

If you go to its properties and download its definition, you will see that the file name has an *.rsc extension and that the report part is represented by a ComponentItem element in RDL. Notice also that the report part definition includes all datasets that report part uses. Once the report part is published, you can manage it just like you can manage a published report. For example, you can change its name, description, or security settings.

Using report parts

End users can consume published report parts. Notice that I said “end users” because more than likely this will be the most common scenario. In fact, the BIDS Report Designer doesn’t support referencing report parts, only publishing them. The Report Builder 3.0 has been extended to support this feature.

112409_0139_ReportParts3

  1. Open Report Builder 3.0 and create a blank report.
  2. Click the Report Builder 3.0 button, click Options and verify that the report server URL is set.
  3. Click the Report Part Gallery tab of the Properties window. Click the Search button to show all report parts that you have access to.
  4. Select the Tablix report part and notice that Report Builder 3.0 shows its properties below.
  5. Drag the Tablix report part and drop it on the report canvas.

Report Builder 3.0 adds the tablix region, the dataset is bound to and report parameters. From here, the report part takes a life of its own. You can make changes to the report as needed including changes to the report part elements. The layout changes you make are not reflected to the published part. If you want to re-publish the changed report part, you can click the Report Builder button and click Publish Report Parts. This will prompt you if you want to re-publish with default settings or review and make changes which will bring you to the Publish Report Parts dialog box.

Changing report parts

The original report part author or another user which appropriate permissions can make changes and re-publish a report part. End users can check if a report part has changed and choose to accept or not the changes. To do this, they have to poll the server for updates. Currently, there is no way for the server to push the changes to all reports who consume the report part in order to force the changes.

112409_0139_ReportParts4

  1. In Report Designer or Report Builder 3.0, open the report that has the Tablix report part. Make changes to the tablix region and deploy the report to re-publish the report part.
  2. In Report Builder 3.0, open a report that uses that report part.
  3. Click the Report Builder 3.0 button and click Check for Updates. Notice that Report Builder 3.0 detects the changes and displays a message that it has found one changed part.
  4. Click the View Updates button to see what report parts have changed. In the Update Report Parts dialog box, select the Tablix report part and click the Update button to refresh it.

Report Builder 3.0 replaces the tablix region the published version. However, Report Builder 3.0 keeps the existing dataset and parameters, even if they are not changed, and appends new datasets and parameters each time the part is refreshed. So, if you have a dataset called Main, refreshing a part will add a new dataset called Main2 and bind the refreshed part to Main2.

Report parts are a new feature of SSRS R2. They promote consistency and reuse by letting you re-factor sections of a report and make them available for public consumption.

Sparklines and Data Bars

Besides indicators, R2 adds sparklines and data bars to the arsenal of data visualization features. Sparklines are small graphics embedded in a context of words, numbers, and images. They help end users visualize simple trends. You could implement sparklines and simple data bars in the previous versions of Reporting Services but you had to go through many steps to strip down the chart or gauge regions. R2 makes the process much simpler. Let’s see what it takes to author a sparkline report with R2 that is similar to the Sparklines report included in my book source code. [View:https://prologika.com/CS/cfs-file.ashx/__key/CommunityServer.Blogs.Components.WeblogFiles/blog/6175.Sparklines-R2.rdl]

112009_1322_Sparklinesa1

This report helps the user visualize the performance of the Adventure Works sales persons. For each person, the report shows the employee’s trend based on the reseller sales made over four quarters and his performance ratio which is defined as the actual sales made by the employee divided by his sales quota. The report gets the data from the Adventure Works 2008 Analysis Services cube.

Configuring Sparklines

In Reporting Services, a sparkline is a scaled-down chart region. Configuring a sparkline takes a few simple steps.

1. Right-click on a tablix cell and click Insert ð Sparkline.

2. In the Select Sparkline Type dialog box that follows, select the Line sparkline type.

112009_1322_Sparklinesa2


3.  Double-click the sparkline region to open the Chart Data panel which is another new design feature in R2.

112009_1322_Sparklinesa3

4.  Click the plus sign in the Values pane and select the Reseller_Sales_Amount to configure the sparkline series.

5.  Click the plus sign in the Category Groups pane to add the Category_Quarter_of_Year field to configure the category groups.

That’s it! I’ve made a few more minor adjustments to finalize the sparkline, such as removing the chart border, setting the chart background for the “green bar” effect and increasing the line width.

Configuring Data Bars

To demonstrate data bars, I implemented the employee’s performance ratio using a data bar region. Similar to a sparkline, a data bar is a simplified chart.

  1. Right-click on a cell and click Insert ð Data Bar. I actually, configured the data bar outside tablix first by embedding it inside the rectangle and copying and pasting it inside the tablix cell. I did that to make the bar narrower so it doesn’t occupy the entire cell height.
  2. On the Select Data Bar Type, leave the default Bar type selected.

112009_1322_Sparklinesa4

3.  In the Chart Data panel, click the plus sign in the Value pane to add the PerformanceRatio field and set its aggregation function to Avg.

112009_1322_Sparklinesa5

That’s pretty much it to set up the initial data bar although I had to go through a few more steps to configure the bar labels and appearance.

Although not revolutionary features, Indicators, sparklines and data bars will save you time when you need to enhance your report with simple graphics. Sean Boon from the Reporting Services team has written an interesting blog post that demonstrates more sparkline features to implement a win-loss sparkline.

Indicators

Often, reports need to show images that represent discrete values, such as an image that shows a KPI status. Previously, you didn’t have another option but to use images that are dynamically changed based on the field value. Indicators, a new R2 feature, make this much simpler. In Reporting Services, an indicator is a simplified gauge region that lets you associate images with states. Although you can use indicators as stand-alone regions, you would typically nest them in a tablix, as the following report [View:https://prologika.com/CS/cfs-file.ashx/__key/CommunityServer.Blogs.Components.WeblogFiles/blog/8712.IndicatorDemo.rdl] demonstrates. The right-most column of this report shows the Gross Margin KPI status as an indicator.

111909_0245_Indicators1

Authoring this report takes a few simple steps:

  1. Add a dataset that requests the Status property of the Financial Gross Profit Margin KPI from the Adventure Works 2008 Analysis Services cube grouped by Year and Quarter.
  2. Use a tablix region to show the KPI status with Year and Quarter row groups.
  3. Right-click the cell in an empty column and click Insert ð Indicator.
  4. In the Select Indicator Type dialog that follows, select the indicator type. In this case, I chose the default directional type.

111909_0245_Indicators2

  1. Once the indicator region is added to tablix, right-click on it and click Indicator Properties. In the Indicator Properties dialog box, select the Value and States tab.
  2. Since in this case I display numeric values and not percentages, change the States Measurement Unit drop-down list to Numeric.


    By default, the default directional indicator lets you defined three states, as shown below. However, you can add or delete states and use custom images if needed. In my case, I defined a range from -1 to 0.-99 for underperformance, 0 – 0.99 as acceptable performance, and 1 as good performance.


    111909_0245_Indicators3


    Indicators are simple but very useful enhancement to Reporting Services. They lets you visualize discrete values on reports.

Pagination and Rendering Enhancements

R2 brings more control over pagination and rendering. A question that pops every now and then on the discussion list is how to name Excel worksheets for each instance of a row group. This scenario wasn’t supported before R2. In R2, there are addition page break options, as shown in the screenshot below. One of them is PageName.

111709_1350_Paginationa1

In this case, I set the PageName property of the ProductCategory row group to the Category field. Then, I set up the BreakLocation of the ProductCategory row group to break when the product category changes. The screenshot below shows what the exported to Excel report looks like. As you can see, each worksheet is now named. If the row group spills on the next page, a new worksheet is added with the same name.

111709_1350_Paginationa2

Another welcome enhancement is the ability to reset page numbering. Suppose you have a master report that includes a subreport and you want to reset the page numbering before the subreport is rendered. This is another commonly requested scenario which wasn’t supported before R2. In the screenshot below, I have a report package that includes two subreports. I want to reset the page number after the first subreport renders. Since the subreport region doesn’t have page break properties, I enclosed the first subreport in a rectangle and set the rectangle PageBreak ð BreakLocation to End and PageBreak ð ResetPageNumber to True. In the page footer, I added Globals!PageNumber of Globals!OverallTotalPages. Since you can reset the page number, the RS team has added also OverallPageNumber and OverallTotalPages built-in fields to the Globals collection. Given this setup, the report will increase the page number for each page in the Company Sales 2008 report. Once Company Sales 2008 has rendered, the server will reset the page number but it will show the overall number of pages.

111709_1350_Paginationa3

Notice that there is also a Disabled page break property. Suppose that when exported to other formats you want your report to break on each row group instance but when exported to Excel you want the entire report to export to a single worksheet. R2 has added two additional built-in fields to the Globals collection, RenderFormat.Name and RenderFormat.IsInteractive, that lets you support such scenarios. In this case, I had to define the following expression for the PageBreak ð Disabled property:

=Iif(Globals!RenderFormat.Name=“EXCEL”, True, False)

If the user exports the report to Excel, the expression turns on the Disabled property and no page breaks are generated. However, if the user exports the report to another format, the report breaks on each instance of the row group.

Finally, to round up the rendering enhancements, you have now the option to rotate text 270 degrees as shown in the report below. This can be easily achieved by setting the textbox WritingMode property to Rotate270. You probably would want to set also TextAlign to Center and VerticalAlign to Middle.

111709_1350_Paginationa4

Shared Datasets

When the Reporting Service team asked my opinion about shared datasets, a new feature in the forthcoming SQL Server Reporting Services R2, I was somewhat skeptical. I preferred them to focus on more important in my mind features, such as the ability to join datasets at report level. But the more I look at the way shared datasets got implemented, the more real-life scenarios I think may benefit from this enhancement.

Think of a shared dataset a hybrid between a shared data source and report execution. Similar to a shared data source, a shared dataset is a report dataset that can be managed independently and shared among reports. A shared dataset must use a shared data source. The shared datasets can be parameterized and reports that use it can pass parameters to it. Similar to report executions, a shared dataset can also be cached and refreshed on a schedule. In my opinion, there are two main scenarios where shared datasets can be useful:

  • Easier maintenance – Suppose you have a dataset that you can re-use across reports, such as a dataset that populates the parameter available values. You want all reports to reuse the dataset and pick up the dataset query changes automatically.
  • Improved report performance – You may have query that takes very long to execute. You want to execute the query in an unattended mode, such as outside working hours, perhaps for different set of parameters, and cache the dataset for a specific duration.

Creating Shared Datasets

Creating a shared dataset is easy. Both BIDS Report Designer and Report Builder 3.0 are capable of creating shared datasets. In Report Designer, you right-click on the new Shared Datasets folder in Solution Explorer, and click Add New Dataset. In Report Builder 3.0, you click the Create Dataset option on the main Create Report or Dataset popup screen.

You can easily convert a report-specific dataset to a shared dataset. Just right-click any dataset in Report Data Window and click Convert to Shared Dataset. Consequently, Report Designer will re-factor the dataset as a shared and it will add its definition to as an *.rsd file to the Shared Datasets folder in Solution Explorer. In the screenshot below, I have converted the EmployeeSalesDetails dataset in the Employee Sales Summary 2008 report to a shared dataset. Notice that the EmployeeSalesDetails dataset reference inside the report has a special icon.

111609_1413_SharedDatas1

As I mentioned in a previous post, the project properties dialog get enhanced to support new deployment settings that are specific to shared datasets. Specifically, the OverwriteDatasets setting specifies if the shared dataset definition will overwritten on deployment if it exists and the TargetDatasetFolder specified in which folder the dataset definitions will be deployed to.

Once the dataset is configured as shared, you can set up its properties, which include the dataset query, fields, and filters. Then, you can configure the dataset reference inside the report to pass parameters to the shared dataset or to have its own filters. This is similar to how to you configure a subreport. What if you want to use row-level security and you need to pass the user identify to the dataset query (User!UserID)? Just add a query parameter to the shared dataset, such as LoginID, and configure the dataset reference inside the report to pass User!UserID as a parameter to the shared dataset.

111609_1413_SharedDatas2

Managing Shared Datasets

Once the shared dataset is deployed, it can be managed just like any other published item using Report Manager or SharePoint. Common management tasks include setting the data source reference, caching, and security. The most interesting of these is caching. Just like report executions, you can cache a shared dataset. When a shared dataset is configured for caching, the report server will cache a dataset copy for each parameter combination. The same restrictions apply as with caching report executions. Specifically, the data source cannot use Windows Security or Prompt for Credentials authentication options. You can configure cache expiration options. For example, if data latency of 30 minutes is acceptable, you can configure the dataset cache to expire in 30 minutes.

111609_1413_SharedDatas3

Let’s say you a dataset query that takes very long to execute. You can set up a cache refresh plan to warm up the dataset cache on a set schedule. Cache refresh plans are also a new R2 feature. Previously, you pre-execute reports by creating a subscription using the NULL delivery provider. Moving to R2, you don’t need to use the NULL provider anymore and you can refresh shared datasets independently from reports. In the process of setting up a cache refresh plan, you need to specify an item-specific or shared schedule and default values for each parameter, just like you would do with snapshot caching or subscriptions.

111609_1413_SharedDatas4

As you can see, shared datasets can help you implement some interesting scenarios when you need to reduce the management effort or improve the report performance.

Aggregates of Aggregates

Aggregates of aggregates is a new feature in SQL Server R2 Reporting Services. It can be better understood by the sample Aggregates.rdl report ([View:https://prologika.com/CS/cfs-file.ashx/__key/CommunityServer.Blogs.Components.WeblogFiles/blog/2474.aggregates.rdl]). It shows sales grouped by year and quarter. The Year group subtotals use the Sum aggregation function to sum the quarter sales. The report footer total averages the year subtotals.

111209_0151_Aggregateso1

Prior to R2, authoring such a report would require dividing the total sales by the number of quarters, which you can obtain by using the CountRows function. You cannot just use the Avg function in the footer as the Bad Sales measure shows:

=Avg(Fields!Internet_Sales_Amount.Value)

If you do so, the Avg function would operate on the detail rows (all quarter rows) and it would produce 2,258,360. R2 lets you nest aggregate functions. The Sales footer total uses the following expression:

=Avg(Sum(Fields!Internet_Sales_Amount.Value, “Year”))

In this case, the Average function operates over the aggregated year subtotals. Note that not all aggregate functions can be nested. For example, you cannot define an aggregate over the Aggregate, RunningValue and Previous functions.

BIDS 2008 and R2 Project Support

Continuing my intrepid journey in the SQL Server 2008 R2 land, I will discuss the new features of the recently-released CTP3. In this blog, I’ll talk about the first new feature that caught my attention – BIDS support for 2008 and R2 projects.

After hearing the outcry from many developers about project compatibility, in R2 Microsoft has decided to support both SQL Server 2008 and R2 report server projects. Similar to Analysis Services, Reporting Services now lets you target a server version in the project deployment settings. There is even a cool Detect Version link that would detect the SQL Server version based on the TagetServerURL setting.

111009_1959_BIDS2008and1

So, you can have a project that targets either edition. What happens when you use R2-specific features, such as the map control, but set the TargetServerVersion to SQL Server 2008?

The map, Map1, was removed from the report. SQL Server 2008 Reporting Services does not support map report items.

I hope this message got improved before R2 ships because BIDS doesn’t actually remove the map control from the report; you just get a build error.

You should know that as with previous versions, you can deploy older RDLs to the server so you don’t have to upgrade your report definitions to R2. For instance, you can deploy RDL 2005 and the server will render the report via the compatibility interfaces without upgrading it to R2 RDL. Notice also that now we have more deployment settings, such as TargetDatasetFolder and TargetReportFolder but that’s a subject for another blog.

SQL Server 2008 R2 November CTP (CTP3)

Microsoft announced release on SQL Server 2008 R2 November CTP (CTP3) with a build number of #1352.12. MSDN, TechNet Subscribers and TAP customers can download the SQL Server 2008 R2 November CTP today. Non-subscribers will be able to access the CTP on Nov. 11th. This should be a feature-complete build that includes all SQL Server R2 functionality.

Reporting Services

The new Reporting Services features include:

SharePoint Integration

SharePoint Integration has several new features that include the following:

  • Support for multiple SharePoint Zones.
  • Support for the SharePoint Universal Logging service.
  • A new data extension.
  • A query designer for SharePoint Lists as a data source.
  • Support for right-to-left text with Arabic and Hebrew in the SharePoint user interface.
  • In a report, the data extension supports include data from SharePoint lists for SharePoint Foundation 2010, SharePoint Server 2010, Windows SharePoint Services 3.0, and Office SharePoint Server 2007.
  • Report Parts.

Shared Datasets and Cache Refresh Plans

Shared datasets are a new type of report server item that can retrieve data from shared data sources that connect to external data sources.

Cache refresh plans let you cache reports or shared dataset query results on first use or from a schedule.

New Data Visualization Report Items

The November CTP introduces several new report items that depict data:

  • Sparklines and data bars are simple charts that convey a lot of information in a little space. These are often used in tables and matrices. Their impact comes from viewing many of them together and being able to quickly compare them, instead of viewing them singly.
  • Indicators are minimal gauges that convey the state of a single data values at glance.

Enhancements to Reporting Services Features

The November CTP provides the following enhancements to Reporting Services features that were released in earlier SQL Server 2008 R2 CTPs or SQL Server 2008:

  • Configuring a Map Layer—The Map wizard displays data from both the spatial data source and the analytical data source to help you choose the field on which to match.
  • Calculating Aggregates of Aggregates—You can create expressions that calculate an aggregate of an aggregate.
  • Enhanced Support for Expressions—New globals and a new property for report variables provide support for overall page numbering, naming pages, and information that is specified in the renderer.
  • Rotating Text 270 Degrees—Text boxes can now be rotated 270 degrees.
  • Report Pagination—Page breaks on tablix data regions (table, matrix, and list), groups, and rectangles give you better control of report pagination.
  • Naming Excel worksheet tabs—You can set properties on the report to name worksheet tab when you export the report to Excel.

Business Intelligence Development Studio Support for
SQL Server 2008 Reports and Report Server projects

Business Intelligence Development Studio supports working with both SQL Server 2008 and SQL Server 2008 R2 reports, and with Report Server projects in the SQL Server 2008 R2 version of Business Intelligence Development Studio.

New Web Service Endpoint

The report server includes a new management endpoint named ReportService2010.ReportingService2010. This endpoint merges the functionalities of both the ReportService2005.ReportingService2005 and ReportService2006.ReportingService2006 endpoints, and can support management operations of the report server in both native mode and SharePoint integrated mode. It also includes new features that are introduced in SQL Server 2008 R2, such as shared datasets and cache refresh.

Analysis Services

The Analysis Services new features are centered around Gemini and include:

PowerPivot for Excel

PowerPivot Field List Enhancements

Numerous enhancements have been added to the PowerPivot field list. These include the following:

  • Automatic detection of relationships when columns from unrelated tables are used in a PivotTable.
  • Support for searching fields by name.
  • Support for named sets.

PowerPivot Data Source Editing

Support is available for the following data source editing tasks:

  • Refreshing data for table, for all tables from a data source, or for all the tables in the PowerPivot window.
  • Editing data source information such as server name, database name, and credentials.
  • Editing table settings such as data source table or query used, columns imported, and filters.

Support for More Types of Data Sources

Targeted support has been introduced for importing data from the following sources:

  • Microsoft Access 2003, 2007, 2010
  • Microsoft SQL Server 2005, 2008, 2008 R2 Analysis Services
  • PowerPivot workbooks published to Analysis Services running in SharePoint Integrated Mode
  • Text files
  • Excel 97-2003, 2007, 2010
  • Microsoft SQL Azure
  • Oracle 9i, 10g, 11g
  • Teradata V2R6, V12
  • Sybase
  • Informix
  • IBM DB2 relational databases 8.1

Enhanced Data Analysis eXpressions (DAX)

DAX functionality has been significantly expanded in the following ways:

  • User interface enhancements include better propagation of errors and easier creation of DAX formulas.
  • Several functions have been added, including a set of functions that operate on textual data, as well as those that provide common Date and Time manipulations.
  • Several performance and functional capabilities have been introduced, including automatic recalculation.
  • Support for handling referential integrity violations between related tables has been introduced.
  • Automatic selection of data types for expressions is available.
  • For more information, see the topic “Data Analysis Expression Language Reference” in SQL Server 2008 R2 Books Online.

DAX is also documented in the online Help of the PowerPivot for Excel add-in. For more information, see the Help file that is installed with the add-in.

PowerPivot for SharePoint

Management Dashboard

A management dashboard for IT has been introduced. This dashboard provides visibility into PowerPivot use on a SharePoint farm that includes information about the following areas, as well as a rich PowerPivot workbook that can be used to build custom reports:

  • Published PowerPivot workbooks, including number of queries executed, number of users and size per workbook in the dashboard.
  • Hardware resource utilization for the PowerPivot service, including CPU and memory, is reported on a daily basis to the dashboard.
  • Data refresh activity is reported for all PowerPoint workbooks that are accessed through the same PowerPivot service application.

For more information about this feature, see the topic “PowerPivot Management Dashboard” in SQL Server 2008 R2 Books Online.

Enhanced Infrastructure

The following enhancements to infrastructure are available:

  • Claims-aware support to enable a user’s identity to flow between SharePoint components in a secure manner.
  • Parallelized refresh of PowerPivot data.
  • Performance optimizations.