Posts

SharePoint Integrated with Reporting Services on Windows Vista

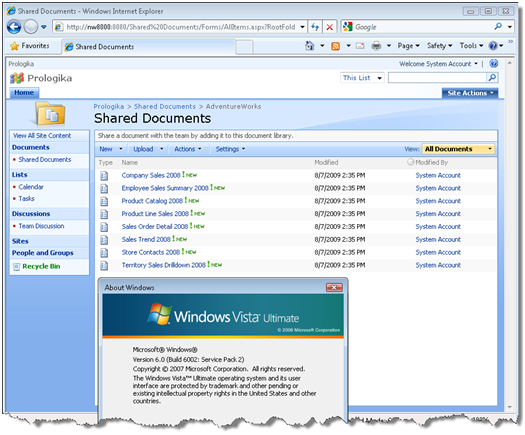
So, how’s this not cool? Running SharePoint integrated with Reporting Services on Windows Vista! I’ve always had a grudge with SharePoint that it doesn’t run on a desktop OS. This forces you to install Windows Server or use a virtual image, both options far from ideal. When I went to TechEd I blurted by disappointment to a couple of SharePoint gurus who clued me in (this is why we go to conferences, right, to learn the latest hacks) but I didn’t have time to try it … until today.

The solution is to use the Bamboo’s workaround (OK, an ingenious hack) but it works like a charm. What about Windows 7 which has recently RTM’ed? Bamboo took care of that as well. I hope Microsoft will take a note and finally support officially SharePoint on a desktop OS. If SQL Server can scale down all the way to mobile devices, so should SharePoint.

Bamboo made my day today!

080709_2315_SharePointI1


Nevron Charting for Reporting Services

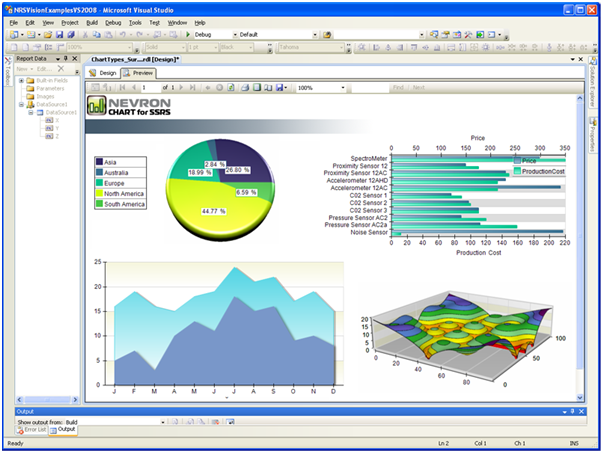
Reporting Services charting not enough? Nevron Software has released a Nevron Charting for Reporting Services which I haven’t personally tested yet. According to the vendor, here are the major features where Nevron excels in comparison with Reporting Services charting:

– Speed – Nevron Chart for SSRS is the fastest rendering chart inside Reporting Services – in both 2D and 3D modes.

– 3D Charting – Nevron Chart for Reporting Services has the best layout in 3D and the most advanced feature set in 3D – including: 11 predefined lighting modes, ability to specify element materials (control the way in which elements reflect light), largest charting types set in 3D, biggest set of shapes in 3D (applicable to pies, bars, markers, areas etc.).

– 2D Charting – Nevron Chart for Reporting Services is the only chart for Reporting Services to provide Adobe Photoshop like image filter effects, which are applicable to all chart elements – these include bevel, emboss, lighting filters etc. When it comes to shadows it is the only chart for Reporting Services which has soft shadows (based on Gaussian and Radial blur image filters).

– 2D/3D Consistency – Nevron Chart for Reporting Services is consistent in 2D/3D modes. For example you can map gradients, textures to elements in both 2D and 3D. Colors specified in 2D are inherited by materials in 3D. You can mix 2D and 3D chart areas in a single chart control.

– Visual Effects – Nevron Chart for SSRS introduces numerous Lighting Models; Orthogonal Projection with Depth Offset (perfect for creating 2D half imitation charts); Soft Shadows based on image filters; Blur, Glow, Lighting, Bevel and Emboss image filters.

– Numerous XY and XYZ scatters – Nevron Chart for SSRS includes the industry leading support for XY and XYZ scatters inside Reporting Services.

– XML Formatted Texts – Nevron Chart for Reporting Services supports XML Formatted Texts. This feature is applicable to all elements which display text. It allows you to mix fonts, mix bold, italic underline formatting and many other advanced features like different fill styles, shadows, image filters etc. – all inside a single label, title etc. XML formatted texts use a format similar to HTML, but with many more advanced options.

– Multithreaded UI – The user interface in design time is multithreaded. This allows for very quick editing of the component, regardless of the preview complexity

– Save/Load Templates (available in Vol.2).

– Ability to inject custom code and to author the generated chars programmatically (code editor) (available in Vol.2).

Unique charting types:

– Surface Chart Series (Grid, Mesh and Triangulated).

– XYZ Scatter Series (Bar, Line, Point, Bubble, Float Bar).

– Financial charting types Renko, Kagi, Three Line Break, Point and Figure (available in Vol.2).

Major Chart Axis Features:

– Multiple X and Y Axes.

– Axes can be docked or crossed.

– Many scale options including support for Categorical, Hierarchical, Logarithmic, Numeric, Date/Time and Time Line scales.

– Control over the range and appearance axes.

– Scale sections

080109_1500_NevronChart1

Nevron is also working on SharePoint charting which will combine their charting technology with the new Nevron Pivot Data Aggregation engine.

Applied Reporting Services 2008 Online Training Class with Teo Lachev

Some of you shared with us your frustration with training budgets cut in half. Many of you couldn’t attend industry conferences this year. Many of you asked how we can help.

We are excited to offer online Business Intelligence classes – no travel, no hotel expenses, just 100% content delivered right to your desktop!

Our first class is Applied Reporting Services 2008. This three-day intensive event teaches you the knowledge and skills you need to master Reporting Services to its fullest.

072809_2347_AppliedRepo1Applied Reporting Services 2008 Online Training Class
with Teo Lachev

Date: August 31 – September 2, 2009
Time: Noon – 4 pm EDT; 9 am – 1 pm PDT
12 training hours total for only $799!

072809_2347_AppliedRepo2

Attend this class for only $799 and get a free paper copy of the book Applied Microsoft SQL Server 2008 Reporting Services by Teo Lachev!

For more information or to register click here!

Excel Page Numbering Issue

An issue was reported about page numbering and exporting reports to Excel with Reporting Services 2008. Specifically, if the page header or footer uses a placeholder for the page number, when exported and previewed in Excel, the report will show Page 1 on all pages.

Page [&PageNumber] of [&TotalPages]

While waiting for Microsoft to fix this, use an expression that concatenates the PageNumber member of the Globals collection.

= “Page” & Globals!PageNumber & ” of “ & Globals!TotalPages

To enter the expression, select the textbox item, right-click and choose Expression.

How to Test SSRS MDX Queries in SQL Server Management Studio

I often need to capture an MDX query that a report sends to Analysis Services and execute it in SQL Server Management Studio (SSMS). I usually do this to understand what parameters the report passes to the query and to troubleshoot the query itself. Unfortunately, SSMS doesn’t support parameterized MDX queries so you have to resort to the following technique:

Capturing MDX Queries

The easiest way to capture an MDX query is to use the SQL Server Profiler.

  1. Start SQL Server Profiler from the Microsoft SQL Server <version>-> Performance Tools program group.
  2. Click File -> New Trace or press Ctrl+N.
  3. In the Connect To Server dialog box, choose Analysis Services, enter your server name, and click Connect.
  4. In the Trace Properties dialog box, click the Event Selection tab. Check the Show All Events and Show All Columns checkboxes.
  5. Optionally, if you want to see only your events, that is events triggered by your actions only, click the Column Filters button. In the Edit Filter dialog box, select NTUserName. Expand the Like tree node on the right and enter your Windows login surrounded by %, e.g. %t_lachev%.
  6. Back to the Trace Properties dialog box, click Run to start the trace.
  7. Now run the report whose queries you want to capture and watch the profiler output for a Query Begin event.

Typically, a report would execute several MDX queries because there will be queries for the report parameters. You can use the profiler find function (Ctrl+F) to search for the query text you need in the TextData column in order to find the report main query (that one that supplies the report with data).

  1. Selec t the Query Begin event of the query you want. In the lower pane of the profiler, you will see the query MDX statement followed by Parameters and PropertyList nodes, such as:

    WITH MEMBER MyKPI as StrToMember( @KPISelector)

    SELECT NON EMPTY {MyKPI} ON COLUMNS,

    NON EMPTY StrToSet(@Dataset)

    * StrToMember(@StartPeriod) : StrToMember(@EndPeriod) ON ROWS

    FROM Viking

    WHERE (StrToMember(@Organization) )

    CELL PROPERTIES VALUE, BACK_COLOR, FORE_COLOR, FORMATTED_VALUE, FORMAT_STRING, FONT_NAME, FONT_SIZE, FONT_FLAGS

    <Parameters xmlns:xsi=”http://www.w3.org/2001/XMLSchema-instance” xmlns:xsd=”http://www.w3.org/2001/XMLSchema” xmlns=”urn:schemas-microsoft-com:xml-analysis”>

    <Parameter>

    <Name>KPISelector</Name>

    <Value xsi:type=”xsd:string”>[Measures].[Return On Average Assets]</Value>

    </Parameter>

    <Parameter>

    <Name>StartPeriod</Name>

    <Value xsi:type=”xsd:string”>[Date].[Month].&amp;[20060101]</Value>

    </Parameter>

    <Parameter>

    <Name>EndPeriod</Name>

    <Value xsi:type=”xsd:string”>[Date].[Month].&amp;[20061201]</Value>

    </Parameter>

    <Parameter>

    <Name>Dataset</Name>

    <Value xsi:type=”xsd:string”>{ [Dataset].[Dataset].&amp;[-2],[Dataset].[Dataset].&amp;[-1] }</Value>

    </Parameter>

    <Parameter>

    <Name>Organization</Name>

    <Value xsi:type=”xsd:string”>[Organization].[Organization Hierarchy].&amp;[-1]</Value>

    </Parameter>

    </Parameters>

    <PropertyList xmlns=”urn:schemas-microsoft-com:xml-analysis”>

    <Catalog>VANTAGE_CUBE_M_BASELINE DEV</Catalog>

    <LocaleIdentifier>1033</LocaleIdentifier>

    <Format>Tabular</Format>

    <Content>SchemaData</Content>

    <Timeout>0</Timeout>

    <ReturnCellProperties>true</ReturnCellProperties>

    <DbpropMsmdFlattened2>true</DbpropMsmdFlattened2>

    </PropertyList>

  2. Click anywhere in the lower pane and press Ctrl+A to select all text, then Ctrl+C to copy it to the clipboard.

Testing MDX Queries

Now that you have the query, you are ready to test it in SSMS.

  1. Open SSMS and connect to the Analysis Services server.
  2. Right-click on the SSAS database and click New Query -> MDX to open and create a new MDX query. Press Ctrl+V to paste the query text that you captured in the profiler.
  3. Since the profiler escapes certain characters, first you need to unescape them. For example, replace (Ctrl+H) all &amp; with &.
  4. One by one, go through the parameters listed in Parameters node and replace the parameter placeholder in the MDX query with the actual value. For example, press Ctrl+H to search for
    @KPISelector (note that the parameters are prefixed with @ in the MDX query) and replace all occurrences (Replace All option) with the actual parameter value. Since typically SSRS MDX queries use StrToMember or StrToSet functions, you need to surround the parameter values with quotes, e.g. “[Measures].[Return On Average Assets]”.
  5. Once you replace all parameters, comment the Parameters and PropertyLists nodes by selecting all text in these nodes and clicking the Comment Out the Selected Lines toolbar button. The only text that it not commented should be the MDX query text.

At this point, you can execute the query by pressing Ctrl+E or clicking the Exclamation toolbar button.

UPDATE

When things get tedious, the developer writes a program. As Greg Galloway pointed out, Darren Gosbell has already written a small but incredibly useful utility, SSAS Query Capture, that automates the process of capturing the queries and replacing the parameters. Moving forward to Visual Studio 2008 and SQL Server 2008, you need to:

  1. Upgrade the source code to Visual Studio. To do so, just open the C# source project in Visual Studio 2008 and accept the defaults.
  2. Delete the Microsoft.AnalysisServices and reference Microsoft.AnalysisServices.dll which you can find in the \Program Files\Microsoft SQL Server\100\SDK\Assemblies\ folder.
  3. Build the project and run QueryCapture.exe in the bin\debug folder.

A cautionary note: The utility always encloses the parameter values in quotes because it assumes that they will be inside the StrToMember and StrToSet functions which SSRS MDX Query Designer generates when you add parameters. If you reference parameters literally, as I demonstrated in this blog, remove the quotes surrounding these parameter values. Otherwise, the chances are that the query will return no data.

I couldn’t imagine how much time Darren’s Query Capture utility could have saved me if I only knew about it! I hope he adds it to the BIDS Helper project.

Maintaining State in Reporting Services 2008

Sometimes, more advanced reporting needs may require maintaining state using custom code. Recently I had to implement a rather involved report consisting of two sections: a detail section that used a recursive sum, Sum(Fields!SomeField.Value, , True), and a summary section with additional calculations which would reference some of the aggregated values in the detail section. Since Reporting Services is not Excel, you cannot reference arbitrary fields on a report. So, I had to cache the values from the detail section in a hashtable using custom code so the summary section could obtain these values when needed. The following embedded code gets the job done:

Friend Shared _hashtable As New System.Collections.Hashtable()

Function GetKey(ByVal id as Long, ByVal column as String) as String

return Report.User!UserID & id & column

End Function

Function AddValue(ByVal id as Long, ByVal column as String, ByVal value As Object) As Object

Dim key as String = GetKey(id, column)

If _hashtable.ContainsKey(key)=False Then

            _hashtable.Add(key, value)

End If

Return value

End Function

Function GetValue(ByVal id as Long, ByVal column as String) As Object

Dim key as String = GetKey(id, column)

If _hashtable.ContainsKey(key) Then

    Return _hashtable(key)

End If

Return Nothing

End Function

Protected Overrides Sub OnInit()

Dim keys As String() = New String(_hashtable.Keys.Count – 1) {}

_hashtable.Keys.CopyTo(keys, 0)

For Each key as String In keys

         If key.StartsWith(Report.User!UserID) Then

         _hashtable.Remove(key)

        End if

Next key

End Sub

In my scenario, tablix cells in the detail section would call the AddValue function to cache the dataset field values. Then, cells in the summary section would call GetValue to obtain these cached values. This technique is not new and you’ve probably used it to solve similar challenges.

What’s new is that moving to Reporting Services 2008 you may need to revisit your custom code and make changes. First, in prior version of Reporting Services, you probably declared the hashtable variable as an instance variable and that worked just fine. However, Reporting Services 2008 introduced a new on-demand processing engine where each page is processed separately. Consequently, you may find that the report “loses” values. Specifically, if the report fits on one page, everything will work as expected. But if the report spills to more pages, the hashtable collection will lose the values loaded on the first page. The solution is to declare the hashtable object as a static (Shared in Visual Basic) object so it survives paging.

Friend Shared _hashtable As New System.Collections.Hashtable()

But because a static object is shared by all users running the report, you need to make the hashtable key user-specific, such as by using the User!UserID variable which returns the user identity.

Function GetKey(ByVal id as Long, ByVal column as String) as String

return Report.User!UserID & id & column

End Function

Are we done? Well, there is a nasty gotcha that you need to be aware of. If the report takes parameters, you will surprised to find out that the custom code returns the cached values from the first report run and changing the parameters (report data) doesn’t change the values in these cells that call the GetValue function. To make the things even more confusing, testing the report in the BIDS Report Designer or Report Builder 2.0 will work just fine. But you will get the above issue after you deploy and run the server report, such as when you request the report in Report Manager or SharePoint.

What’s going on? As it turns out, the hashtable object survives report requests as a result of parameter changes. Consequently, the code that checks if the hashtable key exists will find the key when the report is reposted and it will not add the new value.

If _hashtable.ContainsKey(key)=False Then

_hashtable.Add(key, value)

End If

The solution is to clear the user-specific hashtable items each time the report is run. This takes place in the OnInit method. The OnInit method is a special method which gets executed before the report is processed. You can use this method to do initialization tasks or, in this case, clear state held in global variables.

Are we there yet? Almost. As the reader samsonfr pointed out in a blog comment, we’ll need to make this code thread-safe because the chances are that multiple users may be running the report at the same time so concurrent threads may need to write and read to/from the static hashtable variable at the same time. As the Hashtable documentation explains “Hashtable is thread safe for use by multiple reader threads and a single writing thread. It is thread safe for multi-thread use when only one of the threads perform write (update) operations, which allows for lock-free reads provided that the writers are serialized to the Hashtable. To support multiple writers all operations on the Hashtable must be done through the wrapper returned by the Synchronized method, provided that there are no threads reading the Hashtable object. Enumerating through a collection is intrinsically not a thread safe procedure. Even when a collection is synchronized, other threads can still modify the collection, which causes the enumerator to throw an exception. To guarantee thread safety during enumeration, you can either lock the collection during the entire enumeration or catch the exceptions resulting from changes made by other threads.”

Although the code adds and removes user-specific values only (the collection key uses User!UserID), Robert Bruckner from the SSRS dev team clarified

“Everytime you have code like this in a multi-threaded environment, there is potential for a race-condition:

if (!_hashtable.ContainsKey(“abc”)) _hashtable.Add(…)

In this case you have to take a lock to ensure ContainsKey and Add are run as an atomic piece of code.”

Keeping this in mind, my proposal for making the code thread-safe code follows (concurrent experts, please comment if you find anything substantially wrong with my attempt to make a hashtable access thread-safe).

Friend Shared _hashtable As New System.Collections.Hashtable()

Dim _sht as System.Collections.Hashtable = System.Collections.Hashtable.Synchronized(_hashtable)

Function GetKey(ByVal id as Long, ByVal column as String) as String

return Report.User!UserID & id & column

End Function

Function AddValue(ByVal id as Long, ByVal column as String, ByVal value As Object) As Object

If id = -1 or id = -2 or id=-3 Then

Dim key as String = GetKey(id, column)

If _sht.ContainsKey(key)=False Then

    _sht.Add(key, value)

End If

End If

Return value

End Function

Function GetValue(ByVal id as Long, ByVal column as String) As Object

Dim key as String = GetKey(id, column)

If _sht.ContainsKey(key) Then

    Return _sht(key)

End If

Return Nothing

End Function

Protected Overrides Sub OnInit()

SyncLock _hashtable.SyncRoot

Dim keys As String() = New String(_hashtable.Keys.Count – 1) {}

_hashtable.Keys.CopyTo(keys, 0)

For Each key as String In keys

     If key.StartsWith(Report.User!UserID) Then

         _hashtable.Remove(key)

    End if

Next key

End SyncLock

End Sub
Suppressing Auto-generation of MDX Parameter Datasets

There is an unfortunate issue with the MDX Query Designer in SSRS 2008 Report Designer and Report Builder 2.0 where changing the main dataset overwrites the parameter datasets. This is a rather annoying issue because often you need to make manual changes to the parameter datasets. However, when you make a change to the main dataset, the MDX Query Designer wipes out the manual changes and auto-generates the parameter databases from scratch. According to the feedback I got from Microsoft, the issue will be fixed in SQL Server 2008 R2.

Meanwhile, there is a simple workaround which requires manually changing the dataset definition in RDL. Basically, you need to add a SuppressAutoUpdate designer switch to the parameter dataset, as follows:

<Query>

<DataSourceName>Viking</DataSourceName>

<CommandText> …

<rd:SuppressAutoUpdate>true</rd:SuppressAutoUpdate>

<rd:Hidden>false</rd:Hidden>

</Query>

Overwriting Parameter Defaults

Issue: An interesting question popped today on the discussion list about overwriting the default of a cascading parameter. In this particular case, the report has two parameters: Frequency and HireDate. The HireDate parameter is dependent on the Frequency parameter. Specifically, when the user changes the Frequency parameter, custom code changes the default of the HireDate parameter. Sounds easy, right? Well, not so fast.

This requirement calls for smashing the HireDate default. However, smashing values that the user selected (either explicitly or implicitly by not changing the default) is usually considered to be a bad thing. There exist uncommon cases such as this one where the author of the report can reasonably know the user would expect their previously selected value will be overridden. Unfortunately, Reporting Services doesn’t not currently have a feature which would allow the report author to distinguish the common case from the uncommon case. As a result, the current design handles the common case. (Note: In SQL 2000, SSRS defaulted to smashing the user’s selection with the default when an upstream parameter value changed. And, this resulted in a large volume of customer complaints.

Solution: So, what’s the solution? One option you may want to explore, which the sample report demonstrates (attached), if the Valid Values list changes (as a result of the upstream parameter value changing) and it no longer contains the user’s selection, SSRS is forced to re-evaluate the default. Careful use of the Valid Values list can in many cases simulate the desired behavior of always overriding the user’s selection back to the default. This is I set the HireDate available values to the same expression, so its available value always changes.

[View:/CS/cfs-file.ashx/__key/CommunityServer.Blogs.Components.WeblogFiles/blog/parameter_5F00_default.zip]

Microsoft SQL Server 2008 Reporting Services Add-in for Microsoft SharePoint Technologies, April 2009

As I mentioned in a previous blog, one very important SSRS enhancement in the recently released SQL Server 2008 SP1 is Report Builder 2.0 ClickOnce. This lets you reconfigure the native and SharePoint integration modes to let the user use Report Builder 2.0 instead of Report Builder 1.0.

Note that in SharePoint integration mode, installing SP1 only is not enough. That’s because there are actually two instances of RB2.0 ClickOnce. If you install SQL Server 2008 SP1, this will provide an update for native mode only. For SharePoint integration mode, you must refresh the Microsoft SQL Server 2008 Reporting Services Add-in for Microsoft SharePoint Technologies. This is necessary because the ClickOnce bits must reside on the SharePoint server. The April 2009 version of the add-in can be downloaded from here.

Report Builder – Past, Now and Future

The Report Builder technology made its debut in SQL Server 2005. It targeted business users who wanted to author their own (ad-hoc) reports but they were not necessarily technically savvy, meaning that no technical knowledge about database schemas or query syntax was assumed. The Report Builder technology includes a Report Builder Model and Report Builder Client. Similar to other ad-hoc reporting tools, such as Impromptu, the solution developer was required to implement a Report Builder model that is layered on top of the database and deploy it to the server. This model would receive the reports authored by the end users, which were described in an abstract language (SMDL), and automatically translate them to native queries for the supported data sources (SQL Server, Oracle, and Analysis Services).The initial vision, which didn’t materialize, was to make the query generator open, so developers can plug in custom query generators for other data sources. The Report Builder Client is a ClickOnce desktop report designer which was capable of producing very simple template-based reports.

As Brian Welcker, a former Group Program Manager on the SSRS team, explained in his blog, the Report Builder technology itself enjoyed good acceptance but it wasn’t perfect. To start with, many business users found the Report Builder Client too limiting. Targeting Analysis Services as a data source was problematic to say the least as essentially you had to “wrap” the cube with the Report Builder model layer while a direct access to the cube was preferred. As a result, SQL Server 2008 brought in Report Builder 2.0 which was targeted to supersede the Report Builder Client. As I explained, besides its name Report Builder 2.0 has very little to do with its predecessor as it’s much closer to the BIDS Report Designer than Report Builder 1.0. It provides a full RDL support and shares the same design layout with the BIDS Report Designer but runs outside Visual Studio as a desktop application (ClickOnce-enabled in SQL Server 2008 Service Pack 1).

So, does this mean that the Report Builder technology itself is outdated moving to SQL Server 2008? Absolutely not. If you are looking for an ad-hoc solution that targets small to medium-size SQL Server and Oracle databases, you should definitely evaluate Report Builder. In fact, future releases are expected to bring exciting changes to the Report Builder model which I cannot discuss as they are under NDA. On the report authoring side, business users should evaluate both Report Builder 1.0 (still available in SQL Server 2008) and Report Builder 2.0. Based on my experience, even non-technical users, such as these who struggle with copy and paste, would prefer Report Builder 2.0, so I’d definitely encourage my users to switch to it.

That said, remember that Report Builder is not the only ad-hoc technology that Microsoft provides. As many of you know, I am a big fun of Analysis Services for OLAP and ad-hoc reporting. If you are willing to invest time to learn Analysis Services and MDX (and you should), another approach is to implement a cube instead of a proprietary Report Builder model. If the user needs traditional (banded) reports, they can use the Report Builder 2.0 MDX Query Designer to author such reports from the cube. Of course, one of the advantages of this approach is that Analysis Services enjoys broader client support so you are not limited to Report Builder 2.0 only as a reporting tool. For example, business users can use Excel, ProClarity, and third-party tools. So, choosing a Report Builder model or SSAS is an important decision that requires carefully evaluating your reporting requirements, implementation effort, and skill set.

What may not be so obvious is that if you decide to use a Report Builder model, you can have the best of both worlds: Report Builder model on the server that abstract the database and Report Builder 2.0 client that supports all report authoring features. Unlike the BIDS Report Designer, with Report Builder 2.0 the user doesn’t have to (in fact the user can’t) create a data source that points to the model. Instead, the user wold point to a server Report Builder model when defining the report data source:

  1. In the Report Data pane, click New –> Data Source. Notice that the Data Source Properties dialog says “Use a shared connection or report model”.
  2. Browse to the Report Builder model on the server and click OK.

Once in the query designer, notice that it shows the same Report Builder metadata as in Report Builder 1.0. You have the same entity navigation that guides the user to the entities that are related to the selected entity. From here, authoring a report is a matter of dragging and dropping entities and fields. One thing that is not working in Report Builder 2.0 though, which is likely to be fixed in a future release, is filter prompts. Report Builder Client 1.0 would automatically populate the parameter available values if you select a filter as a prompt. Report Builder 2.0 would generate a report parameter but you have manually set up a dataset for the available values and bind it to the parameter.