Atlanta MS BI and Power BI Group Meeting on January 9th (Integrating Azure Synapse Analytics and Power BI)

The Atlanta MS BI and Power BI Group is resuming in-person meetings! Please join us for the next meeting on Monday, January 9th, at 6:30 PM ET.  Elayne Jones (Data Engineer at 3Cloud) will show you how to integrate Synapse with Power BI. For more details and sign up, visit our group page.

WE ARE RESUMING IN-PERSON MEETINGS AT THE MICROSOFT OFFICE IN ALPHARETTA. WE STRONGLY ENCOURAGE YOU TO ATTEND THE EVENT IN PERSON FOR BEST EXPERIENCE. PLEASE NOTE THAT GUESTS ENTERING MICROSOFT BUILDINGS IN THE U.S. MUST PROVIDE PROOF OF VACCINATION OR SELF-ATTEST WITH HEALTHCHECK (HTTPS://AKA.MS/HEALTHCHECK). ALTERNATIVELY, YOU CAN JOIN OUR MEETINGS ONLINE VIA MS TEAMS. WHEN POSSIBLE, WE WILL RECORD THE MEETINGS AND MAKE RECORDINGS AVAILABLE AT HTTPS://BIT.LY/ATLANTABIRECS. PLEASE RSVP ONLY IF COMING TO OUR IN-PERSON MEETING.

Presentation: Integrating Azure Synapse Analytics and Power BI

Date: January 9th

Time: 6:30 – 8:30 PM ET

Place: Onsite and online


ONSITE

Microsoft Office (Alpharetta)

8000 Avalon Boulevard Suite 900

Alpharetta, GA 30009

ONLINE

Click here to join the meeting


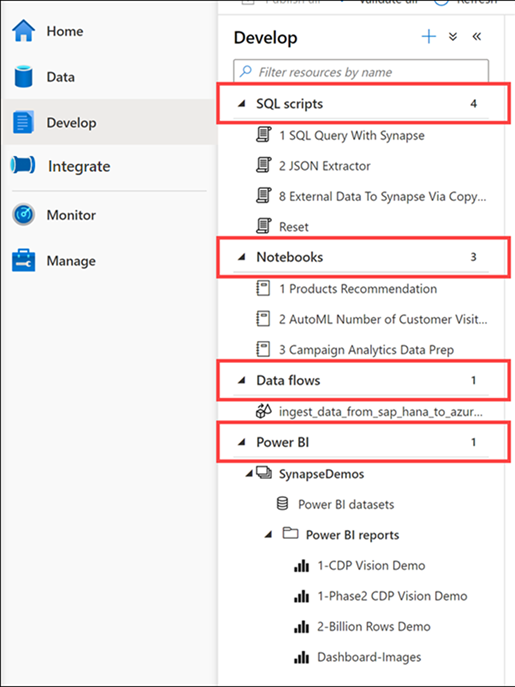
Overview: Combining the forces of Azure Synapse Analytics and Microsoft Power BI allows you to weave together the full lifecycle of data ingestion, transformation, and visualization. Synapse encompasses the traditional processes of data warehousing, cleansing, and visualizing all within Synapse Studio, fostering unity among teams and driving efficiency across organizations.

Speaker: Elayne Jones is a Data Engineer at 3Cloud. She specializes in data visualization and data modeling using Power BI. She has expertise developing Power Apps and creating Power Platform solutions that drive efficiency within organizations. Elayne is also experienced querying data using the DAX and SQL languages. Elayne has delivered numerous BI trainings and written blog posts on various BI and reporting topics.

PowerBILogo

Report-enable Internal Portals with Power BI Reports

Expanding on my previous blog on this subject, there are three options to report-enable your Intranet portals with Power BI reports:

  • Report link – This is the link to the report that you obtain from the browser address bar. If you want to report in full screen viewing mode (hiding the Power BI chrome), you can append the chromeless=1 query parameter to the URL, such as https://app.powerbi.com/groups/689c8ae3-0e22-44d1-9803-b6afdba4e583/reports/b60eaab4-9a85-47c3-8cde-e3a17e8f3dae/ReportSection?chromeless=1. If the “Display report pages as tabs along the bottom of the report” report setting is disabled, the report will be rendered with a few buttons at the bottom. Clicking “Go back” or exiting the full-screen view, will “restore” the Power BI portal chrome, allowing the user to gain access to the report action bar, such as to get report insights. This is the only option to have access to all commands in the report action bar. In addition, the users can store the link in the browser favorites and potentially customize it. However, a report link doesn’t allow the report to be “embedded” in a page. Attempting to put the link on an iframe won’t work because of content security policy (specifically Microsoft sets the Content-Security-Policy tag to frame-ancestors ‘self’ in the response payload, I guess to prevent organizations from circumventing the Power BI portal).
  • Embed for Website or Portal – This is the iframe code you get from the report’s File -> Embed for Website or Portal. This is your easiest option to provide an embedded experience for your coworkers, but it doesn’t currently support the report action bar. There isn’t a way to customize the report link.
  • Power BI Embedded REST API – This option includes server-side and client-side APIs to let you customize the embedding experience, such as to replace the default Filter pane with your own implementation. This is the option most organizations take to provide embedded experience for external customers, but it could be used if you want full control over embedding reports internally. Microsoft added recently an option to show the action bar, however, only a subset of commands are available. This is the only option for single sign-on (SSO) experience, but it’s the most difficult to implement, as it requires extending your app with custom code.

This table summarizes the three options discussed in this blog.

FeatureReport linkEmbed for Website or PortalPower BI Embedded REST API
Embedded content experienceNoYesYes
Single sign-onNoNoYes
Action barNoNoPartially
ShortcutYesNoNo
Developer APINoNoYes
Integration effortLowLowMedium to High

Prologika Newsletter Winter 2022

A few days ago an exalted customer shared that they’ve acquired Synapse and now they’re ready for Power BI modeling. He just wasn’t sure how to give business users access to Synapse so cool self-service BI can finally start. In the process of the conversation, it became clear that he opened Synapse Studio and was left with the impression that Synapse has semantic modeling features. This is what happens when Marketing gets involved and people get confused about what a tool actually does. This newsletter attempts to clear up this confusion.

What’s Synapse?

Think of Synapse (aka Azure Synapse Analytics) as a marketing name that spans multiple unrelated (or rather loosely) related services that are sold separately but are bundled together to fulfill a vision of a “unified analytical platform”. This vision is further emphasized by Synapse Studio – an online tool to work with and monitor the Synapse services.

Like a red giant star, Synapse seems to engulf everything in its path.

Let’s explain each service in the order it’s listed in the Azure pricing calculator. Again, each service has its own pricing model, and the “bundle” doesn’t give you any price break.

  • Data Integration – This is Azure Data Factory, which is typically acquired and installed as a standalone service. Why would you want to create ADF pipelines inside Synapse Studio instead of ADF Studio is beyond me. Another caveat to watch for regarding data integration is that Microsoft seemingly emphasizes the role of ADF data flows (at least there is a separate “Data flows” section in Synapse Studio) despite that the ELT pattern is a best practice to load data into the SQL dedicated pool.
  • Data Warehousing – Synapse comes with a preconfigured “serverless” pool that can be used to virtualize data stored in Azure Data Lake. This is a very useful service that allows you to query data in ADLS files using T-SQL. Check this case study to learn how Prologika used this feature in a real-life project. This tab also provides pricing for a dedicated SQL pool but since there is a separate tab for it, I’ll cover it further down.
  • Big Data Analytics – You can optionally provision an Azure Spark pool to process data or apply ML at scale using the Microsoft implementation of Apache Spark.
  • Log and Telemetry Analysis – A recently introduced type of pool for analyzing large volumes of data streaming (i.e. log and telemetry data) from applications, websites, or IoT devices using Kusto Query Language (KDL).
  • Dedicated SQL Pool – This is your SQL Server (or rather Azure SQL Database) on steroids for storing and querying massive data volumes that was previously known as Azure SQL DW. While you gain scalability, you lose various T-SQL features so don’t think that you can seamlessly migrate your on-prem SQL databases to Synapse. Also, for now, a dedicated pool is limited only to a single database.
  • Azure Synapse Link – Another recently introduced service to automatically synchronize data from Azure Cosmos DB and SQL Server 2022 (without using change data capture).

What Synapse is not?

Despite that Synapse Studio might trick you otherwise, Synapse is not:

  • Synapse is not a semantic modeling tool. Although you’ll see a Power BI section in the Develop tab of Synapse Studio, modeling is still done with Power BI Desktop (or other professional tools) and published to Power BI. As with ADF, why would a developer want to register your Power BI artifacts in Synapse Studio is another thing that escapes me.
  • Synapse is not a data integration tool, master data management tool, or data cataloging tool.
  • Synapse shouldn’t be your default option for data warehousing in the cloud. In my experience, Synapse would be an overkill for data processing needs of most companies because there are more cost-effective options for SQL Server in the cloud with less data.


Teo Lachev
Prologika, LLC | Making Sense of Data
logo

What Exactly is Microsoft Synapse?

The other day an exalted customer shared that they’ve acquired Synapse and now they’re ready for implementing semantic models with Power BI. The client wasn’t sure how to give business users access to Synapse so cool self-service BI can finally start. In the process of the conversation, it became clear that they opened Synapse Studio and were left with the impression that Synapse has semantic modeling features. This is what happens when Marketing gets involved and people get confused about what a tool actually does. Let’s attempt to clear this confusion.

What’s Synapse?

Think of Synapse (aka Azure Synapse Analytics) as a umbrella name that spans multiple unrelated (or rather loosely) related services that are sold separately but are bundled together to fulfill a vision of a “unified analytical platform”. This vision is further emphasized by Synapse Studio – an online tool to work with and monitor the Synapse services.

Let’s explain each service in the order it’s listed in the Azure pricing calculator. Again, each service has its own pricing model, and I don’t think that bundling them together gives you any price break.

  • Data Integration – This is Azure Data Factory, which is typically acquired and installed as a standalone service. Why would you want to create ADF pipelines inside Synapse Studio instead of ADF Studio is beyond me. Another caveat to watch for regarding data integration is that Microsoft seemingly emphasizes the role of ADF data flows (at least there is a separate “Data flows” section in Synapse Studio) despite that the ELT pattern is a best practice to load data into the SQL dedicated pool.
  • Data Warehousing – Synapse comes with a preconfigured “serverless” pool that can be used to virtualize data stored in Azure Data Lake. This is a very useful service that allows you to query data in ADLS files using T-SQL. Check this case study to learn how Prologika used this feature in a real-life project. This tab also provides pricing for a dedicated SQL pool but since there is a separate tab for it, I’ll cover it further down.
  • Big Data Analytics – You can optionally provision an Azure Spark pool to process data or apply ML at scale using the Microsoft implementation of Apache Spark.
  • Log and Telemetry Analysis – A recently introduced type of pool for analyzing large volumes of data streaming (i.e. log and telemetry data) from applications, websites, or IoT devices using Kusto Query Language (KDL).
  • Dedicated SQL Pool – This is your SQL Server (or rather Azure SQL Database) on steroids for storing and querying massive data volumes that was previously known as Azure SQL DW. While you gain scalability, you lose various T-SQL features so don’t think that you can seamlessly migrate your on-prem SQL databases to Synapse. Also, for now, a dedicated pool is limited only to a single database.
  • Azure Synapse Link – Another recently introduced service to automatically synchronize data from Azure Cosmos DB and SQL Server 2022 (without using change data capture).

What Synapse is not?

  • Synapse is not a semantic modeling tool. Although you’ll see a Power BI section in the Develop tab of Synapse Studio, modeling is still done with Power BI Desktop (or other professional tools) and published to Power BI. As with ADF, why would a developer want to register your Power BI artifacts in Synapse Studio is another thing that escapes me.
  • Synapse is not a data integration tool, master data management tool, or data cataloging tool.
  • Synapse shouldn’t be your default option for data warehousing in the cloud. In my experience, Synapse would be an overkill for data processing needs of most companies because there are more cost-effective options for SQL Server in the cloud with less data.

Testing DAX Measures

DAX can get complex and humble even experienced BI developers. Since Microsoft left us without a proper debugger, here a couple of techniques that I use to debug DAX when going gets tough:

  1. Variables – I often break down the formula in variables. As a bonus, variables make expressions easier to read and might yield performance gains. Consider the following SalesYoY% measure that calculates the variance in sales between the current period and same period last year.
    SalesYoY% =
    VAR _LastYearSales =
    CALCULATE (
    [InternetSales],
    SAMEPERIODLASTYEAR ( 'Date'[Date] )
    )
    RETURN
    IF (NOT ISBLANK([InternetSales]), DIVIDE ([InternetSales] - _LastYearSales, _LastYearSales))

    Let’s say you believe that last year’s sales look suspicious, such as the high value for 2011. You can comment the last line and return the LastYearSales variable to investigate further.

    SalesYoY% =
    VAR _LastYearSales =
    CALCULATE (
    [InternetSales],
    SAMEPERIODLASTYEAR ( 'Date'[Date] )
    )
    RETURN
    _LastYearSales
    --IF (NOT ISBLANK([InternetSales]), DIVIDE ([InternetSales] - _LastYearSales, _LastYearSales))
  2. The EvaluateAndLog function – With the introduction of the EvaluateAndLog function in Power BI, Microsoft has provided us with a poor man’s debugger that can print the output of a DAX expression. For example, to investigate the last year’s sales, you can enclose it with EvaluateAndLog.
    SalesYoY% =
    VAR _LastYearSales =
    CALCULATE (
    [InternetSales],
    SAMEPERIODLASTYEAR ( 'Date'[Date] )
    )
    RETURN
    IF (NOT ISBLANK([InternetSales]), DIVIDE ([InternetSales] – EvaluateAndLog(_LastYearSales), _LastYearSales))

    Then, you can use the SQL Server Profiler (distributed with SSMS) or the tool mentioned in the blog to see the output. I have the SQL Server Profiler registered as a Power BI Desktop external tool using the steps in this blog so that I can conviniently launch it connected to the Power BI Desktop model. Once the profiler opens, make sure to select the “DAX Evaluation Log” event.

    In this case, the event outputs the last year’s sales broken by year because the visual slices the measure by years.