Why Is SQL Server Not Using My Index?

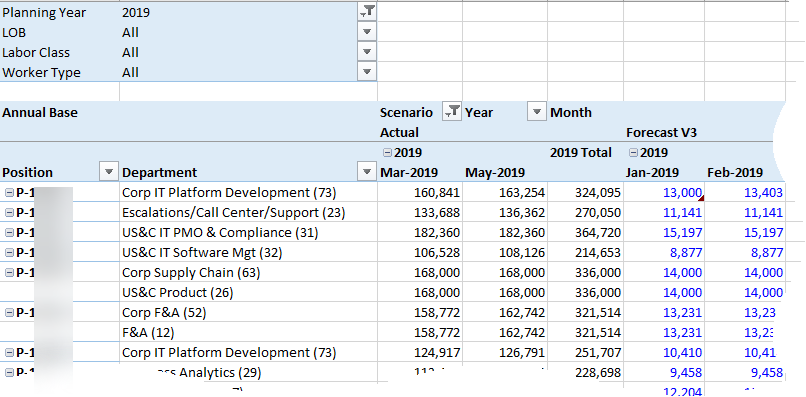
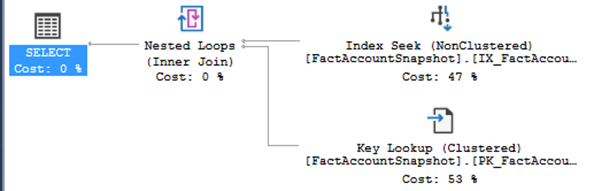
Scenario: A partitioned Tabular table generates SELECT statements that queries a massive range from the base table on a date column. The processing job is taking long time. The SELECT query plan shows Clustered Index Scan but there is an index on the date column.

Why is SQL Server not using the index? Surely, it will speed things up, right? This is where the blaming game starts…

Analysis: SQL Server might ignore the index if the range is too wide. For example, these two queries will probably hit the index on the LastUpdated column in a 300 million rows table because the range is very narrow.

select from FactAccountSnapshot with (index(IX_FactAccountSnapshot_LastUpdated)) where LastUpdated ‘1/1/2019’

select from FactAccountSnapshot with (index(IX_FactAccountSnapshot_LastUpdated)) where LastUpdated between ‘1/1/2019’ and ‘1/2/2019’

This query will probably not:

select from FactAccountSnapshot where LastUpdated between ‘1/1/2019’ and ‘1/31/2019’

Why? Because the server might determine that is much faster to scan the entire table instead of doing many lookups against the index. To test this out, you can force the query to use the index:

select from FactAccountSnapshot with (index(IX_FactAccountSnapshot_LastUpdated)) where LastUpdated between ‘1/1/2019’ and ‘1/31/2019’

Only the find out that it takes x5 more to fetch the data (in this example, 1:37 minutes versus 24 seconds with the table scan).

Conclusion: SQL Server is smarter that you might think. Indexes may benefit queries with narrow ranges. The wider the range, the less likely it will result in an index hit. And this is a good thing. BTW, in this particular case, the performance issue was not related to SQL Server at all.

Tip: Assuming good hardware and proper conditions (good query throughput (no massive joins in views), good network throughput, narrow fact table, etc.), Analysis Services should be able to process 100,000 rows/sec on a single thread. So, a 300 million rows table should process in less than an hour. Even better, if you partition it, each partition will process in parallel so with five partitions (five parallel processing threads), you should aim at around 15-20 minutes to fully process this table. Even better, process only the partitions with data changes to bring the query processing window further down.

Multi-level Column Unpivoting with Power Query

An interesting challenge today come up while mentoring finance users in Power BI. Consider the following Excel layout.

061919_0107_MultilevelC1.png

The user wants to unpivot the data by rotating the three header rows (Scenario Type, Month, and Year) from columns to rows. The issue is that the headers span three rows. If you just select these columns and unpivot, you’ll end up with a mess. And Power Query operates on row at the time so you can’t reference previous rows, such as to concatenate Scenario, Month, and Year. We can do the concatenation in Excel so we have one row with column headers, such as Actuals-Jan-2018, Actuals-Feb-2018, and so on, which we can easily unpivot in Power Query. But if we can’t or don’t want to modify the Excel file, such as to avoid the same steps every time a new file comes in?

One way to achieve a Power Query-only solution is to transpose the rows. Then, we can apply the required transforms, such as filling down, creating a new column that concatenates the three columns and so on.

061919_0107_MultilevelC2.png

Then, we transpose back and unpivot. You can download the Excel file with the Power Query transforms using this link.
UnpivotBudget

Prologika Newsletter Summer 2019

090918_1951_DAXVariable1.png
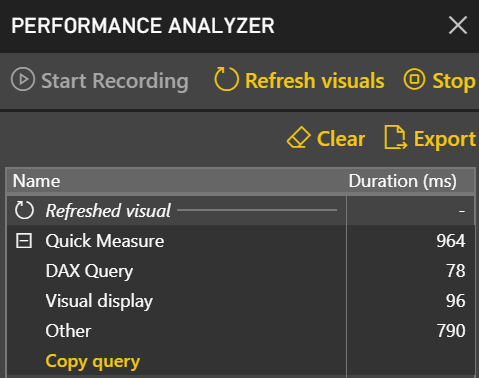
After learning how to model the data properly (the most important skill), DAX would be the next hurdle in your self-service or organizational BI journey. You won’t get far in Microsoft BI without DAX. This letter shares a tip on how to identify DAX performance bottlenecks by using a recent feature in Power BI called Performance Analyzer.

Learning DAX

DAXBefore I get to Performance Analyzer, I’m excited to announce my latest book: Applied DAX with Power BI: From zero to hero with 15-minute lessons. This book was born out of necessity. In my consulting practice, I had been teaching and implementing Power BI and Analysis Services Tabular, and people were constantly asking for DAX book recommendations. Indeed, DAX is not an easy topic and has its ways to humble even experienced practitioners. There are a few good reference books out there, but they could be somewhat overwhelming for novice users. So, I turned my classroom and consulting experience into this book and designed it as a self-paced guide to help you learn DAX one lesson at a time.

This one was a different book to write. Unlike my other books, which tend to be heavy, this book is smaller (220 pages). Regardless, it took me a while to write it. The book also adopts a lesson-based approach, so the reader can learn and practice a specific DAX concept quickly. There are usually three sections in each lesson: Practice (with step-by-step guidance), Outcome (a visual that shows the result), and Analysis (explaining why DAX works this way). Most lessons are five to six pages long, and it should take no more than 15 minutes to complete the lesson’s exercises (you can download and view a sample lesson from the book page).

And if you do one lesson per day, you’ll be a DAX expert in a month!

Analyzing DAX Queries

“This report is slow!” I hope you never hear this, but the chances are that you will sooner or later. No one likes watching a spinning progress indicator and waiting for the report to show up. Tucked in the View ribbon of the Power BI Desktop recent builds is a handy tool called Performance Analyzer that can help you identify slow queries. It’s easy to use:

  1. In Power BI Desktop, click the View ribbon and check the Performance Analyzer setting. This will open the Performance Analyzer pane.
  2. Click Start Recording in the Performance Analyzer pane. Once you start recording, any action that requires refreshing a visual, such as filtering or cross-highlighting, will populate the Performance Analyzer pane. You’ll see the statistics of each visual logged in the load order with its corresponding load duration.
  3. You can click the “Refresh visuals” link in Performance Analyzer to refresh all visuals on the page and capture all queries. However, once you are in a recording mode, every visual adds a new icon to help you refresh only that visual.

PerformanceAnalyzer

Performance Analyzer captures the following information:

  • DAX query – The length of time to execute the query.
  • Visual display – How long it took for the visual to render on the screen after the query is executed.
  • Other – This is the time that the visual spent in other tasks, such as preparing queries, waiting for other visuals to complete, or doing some other background processing.

Although not as comprehensive as DAX Studio, Performance Analyzer is a quick and easy way to get an overall idea of what impacts your report page performance. Performance Analyzer is currently only available in Power BI Desktop and it’s not available in Power BI Service.


Teo Lachev
Prologika, LLC | Making Sense of Data
Microsoft Partner | Gold Data Analytics

logo

Power BI Sharing is Getting Better 2

We had to wait four years but here they are: Power BI shared datasets are here. This makes it a good time to revisit the remaining Power BI sharing limitations, which I listed in my previous blog on the same subject.

  1. No nesting support – Workspaces can’t be nested, such as to have a global Sales workspace that breaks down to Sales North America, Sales Europe, etc. You can’t organize content hierarchically and there is no security inheritance. Consequently, you must resort to a flattened list of workspaces. Microsoft has hinted about subfolders, but no further details are provided about how they will work and ETA.
  2. UPDATE 6/27: The new Viewer role supports sharing with viewers. Sharing with “viewers” – You can’t just add Power BI Free users to share content in a premium workspace. This would have been too simple. Instead, you must share content out with either individual reports/dashboards or apps. A Viewer role has been in the works to address this, but no official release date yet.
  3. One-to-one relationship with apps – Since for some obscure reason that only Microsoft knows, broader sharing requires apps, an app needs to be created (yet another sharing layer) to share workspace content to a broader audience. But you can’t publish multiple apps from a workspace, such as to share some reports with one group of users and another set with a different group. Hopefully, the forthcoming Viewer role will remove this limitation and de-emphasize apps, which in my opinion add unnecessary complexity without bringing much business value.

It’s nice to share and it’s good to see that Power BI is making it simpler but more is needed to bring sharing to where it should be.

Power BI Palooza

May was a hectic month but June is even busier… I’m presenting and sponsoring the tomorrow’s Power BI Group meeting and teaching a class on Tue and Wed. Then, on Saturday Guys in the Cube and I are kicking off the Power BI Palooza event at the Microsoft office in Alpharetta at 8:30 AM. I’m presenting “10 Ways to Empower Your BI Strategy with Power BI”. Then the week after I’m teaching another class…

The Palooza organizers said the event was sold out a few days after the announcement. If you’re of the lucky confirmed, here is my presentation’s abstract.

Not sure what value Power BI can bring to your BI strategy? Join me to discuss 10 ways Power BI can help augment your existing or envisioned Power BI strategy. If you’re interested in Power BI but you’re not sure how it fits within your organizational data strategy, this event is for you. Discussion points include:

  • Organizational BI
  • Self-service BI
  • Cloud vs. on-premises deployments
  • Predictive analytics
  • External reporting
  • Integrated solutions

Get your Power BI questions answered and see demos along the way.

Atlanta MS BI and Power BI Group Meeting on June 3rd

MS BI fans, join us for the next Atlanta MS BI and Power BI Group meeting on June 3, Mondayat 6:30 PM at the Microsoft office in Alpharetta. I’ll show you how to bridge the analytical and developer worlds by integrating Power BI with PowerApps. Eric Flamm will demonstrate SQL Notebooks in Azure Data Studio. Prologika will sponsor the event. For more details, visit our group page and don’t forget to RSVP (fill in the RSVP survey if you’re planning to attend).

Presentation:Bridge Analytics and Developer Worlds with Power Platform
Date:June 3, 2017
Time6:30 – 8:30 PM ET
Place:Microsoft Office (Alpharetta)

8000 Avalon Boulevard Suite 900

Alpharetta, GA 30009

Overview:One of the Power BI most prominent strengths is that it’s a part of the much broader Microsoft Power Platform and Data Platform that spans various on-premises and cloud offerings for data storage, processing, and analysis. Join this session to learn how to integrate Power BI with PowerApps and discover exciting new possibilities that redefine the meaning of a report and let you do more with less. During this entirely hands-on, almost no-slides session I’ll walk you through the steps to implement a popular report requirement for writeback, that Power BI doesn’t natively support.
Speaker:Through his Atlanta-based company Prologika (https://prologika.com), a Microsoft Gold Partner in Data Analytics, Teo Lachev helps organizations make sense of their most valuable asset: their data.  Teo has authored and co-authored several bestselling books on organizational and self-service data analytics (his latest is “Applied DAX with Power BI”), and he has been leading the Atlanta Microsoft BI and Power BI group since he founded it in 2010. Teo has been a Microsoft Most Valued Professional (MVP Data Platform) since 2004.
Sponsor:Prologika is one of the most trusted names in Data Analytics. Our clients, from small businesses to Fortune 100 enterprises, derive tremendous value from our services. Our mission is to help organizations make sense of data by applying the latest technologies for descriptive and predictive analytics and get actionable insights. Your organization will spend less time mining for information and be better equipped to make sound business decisions.
Prototypes with Pizza“SQL Notebooks in Azure Data Studio” by Eric Flamm

092417_1708_AtlantaMSBI1.png

“Applied DAX with Power BI” Book Available

I’m excited to announce my latest book: “Applied DAX with Power BI: From zero to hero with 15-minute lessons“. This book was born out of necessity. In my consulting practice, I had been teaching and implementing Power BI and Analysis Services Tabular, and people were constantly asking for DAX book recommendations. Indeed, DAX is not an easy topic and has its ways to humble even experienced practitioners. There are a few good reference books out there, but they could be somewhat overwhelming for novice users. So, I turned my classroom and consulting experience into this book and designed it as a self-paced guide to help you learn DAX one lesson at a time.

This one was a different book to write. Unlike my other books, which tend to be heavy, this book is smaller (220 pages). Regardless, it took me a while to write it. The book also adopts a lesson-based approach,  so the reader can learn and practice a specific DAX concept quickly. There are usually three sections in each lesson: Practice (with step-by-step guidance), Outcome (a visual that shows the result), and Analysis (explaining why it works this way). Most lessons are five to six pages long, and it should take no more than 15 minutes to complete the lesson’s exercises (you can download and view a sample lesson from the book page).

And if you do one lesson per day, you’ll be a DAX expert in a month!

Currently, the book is available on Amazon (paperback and Kindle eBook) and it’s making its way to other outlets. As always, I’m awaiting feedback on the discussion forum at the bottom of the book page.

051119_2019_AppliedDAXw1.png

Fixing Random Problems with DAX

Scenario: You have a dimension table and a fact table, and you want to generate some test data, such by randomly looking up a value from the dimension table for each row in the fact table.

The following DAX formula should get the job done but RANDBETWEEN doesn’t work (although it works as a standalone function outside LOOKUPVALUE). Specifically, you get either the same value or an empty value.

Rand_Value_From_Other_Table =
LOOKUPVALUE (
Dim_Table[Fruit],
Dim_Table[Fruit_ID], ( RANDBETWEEN ( 1, MAX ( Dim_Table[Fruit_ID] ) ) )
)

Solution: I think the issue is that like Power Query, DAX assumes that functions are idempotent. Given the same arguments, they should produce the same result, which isn’t true for RANDBETWEEN and Power Query Number.Random functions. The simple solution is to change the first argument to perform a dummy operation that doesn’t use a constant value, such as:

Rand_Value_From_Other_Table =
LOOKUPVALUE (
Dim_Table[Fruit],
Dim_Table[Fruit_ID], ( RANDBETWEEN ( 1 + Fact_table[Fact_table_id] – Fact_table[Fact_table_id], MAX ( Dim_Table[Fruit_ID] ) ) )
)

Thanks to Stacey Jones who came up with this interesting puzzle.

Another Successful BPM Solution

Business Performance Management (BPM) is a methodology to help the company predict its performance. An integral part of a BPM strategy is a process for Budgeting, Planning, and Forecasting which is typically performed by the Finance department. When it comes to Finance, nothing is simple, and BPM is no exception. This diagram illustrates what typical data movement might look like to consolidate BPM areas into a consolidated Financials view.

050619_0037_AnotherSucc1.png

In this case, a client wanted to automate budgeting for the Sales, General, and Administrative accounts (SG&A). To clarify the jargon, SG&A accounts capture overhead cost, such as salaries and bonus, and this client used Workday to record these expenses for each employee.

I typically see companies take two paths when it comes to BPM:

  • Home-grown Excel-based solutions – You can do anything in Excel, but this path typically leads to fragile solutions that collapse under their weight.
  • High-end planning solutions – To get out of the Excel “spreadmarts”, the temptation is to buy a high-end commercial software, such as Hyperion. This path leads to a very high initial investment and then even higher “customization”.

A better option that we pursued was to implement a customized solution based on the Microsoft BI platform. This approach reduces cost and allows users to make changes using the tool they like most: Excel.

For example, the screenshot below shows how the user can filter the report at any level and make changes to the forecast values (in blue color).

050619_0037_AnotherSucc2.png

The main benefits of this solution are:

  • Automated retrieval of actuals from the company’s data warehouse (also designed by Prologika)
  • A highly-customized solution that meets complex business needs
  • Management has immediate access to actuals, budget, and forecast
  • Elimination of manual entry and data errors.
  • Ability to analyze company’s performance by various dimensions.

How does your company do business performance management?

Atlanta MS BI and Power BI Group Meeting on May 6th

MS BI fans, join us for the next Atlanta MS BI and Power BI Group meeting on May 6, Mondayat 6:30 PM at the Microsoft office in Alpharetta. Patrick LeBlanc, a Principal Program Manager at Microsoft, will show us how to integrate Power BI and Flow for geospatial analytics. I’ll showcase Power BI Report Builder.  TEKSystems will sponsor the event. For more details, visit our group page and don’t forget to RSVP (use the RSVP survey on http://atlantabi.pass.org if you’re planning to attend).

Presentation:

Using the Power Platform to Enhance Spatial Granularity

Date:

May 6, 2019, Monday

Time

6:30 – 8:30 PM ET

Place:

Microsoft Office (Alpharetta)

8000 Avalon Boulevard Suite 900
Alpharetta, GA 30009

Overview:

Join this session to see how you can use the Power Platform to solve a real world customer problem. With a growing mobile workforce, many organizations are trying to figure out how to properly arm them with the correct tools. In this session we will explain and demonstrate how you can leverage the Power BI Mobile app and Microsoft Flow to build a solution that enables them to quickly identify locations near and far. We will demonstrate how the solution was built step-by-step, detailing how and why certain technologies and solutions were selected or not.

Speaker:

Patrick LeBlanc is a currently a Data Platform Solutions Architect. Along with his 15+ years’ experience in IT he holds a Master of Science degree from Louisiana State University. He is the author and co-author of five SQL Server books and one of the only two guys in the cube. Prior to joining Microsoft, he was awarded Microsoft MVP award for his contributions to the community. Patrick is a regular speaker at many SQL Server Conferences and Community events.

Sponsor:

People are at the heart of every successful business initiative. At TEKsystems, we understand people. Every year we deploy over 80,000 IT professionals at 6,000 client sites across North America, Europe and Asia. Our deep insights into IT human capital management enable us to help our clients achieve their business goals – while optimizing their IT workforce strategies. We provide IT staffing solutions, IT talent management expertise and IT services to help our clients plan, build and run their critical business initiatives!

Prototypes
with pizza

“Power BI Report Builder” with Teo Lachev

092417_1708_AtlantaMSBI1.png