Atlanta MS BI and Power BI Group Meeting on December 3th
MS BI fans, join us for the next Atlanta MS BI and Power BI Group meeting on December 3th, Tuesday at 6:30 PM at the Microsoft office in Alpharetta. I will discuss Power BI dataflows. A3 will sponsor the event. For more details, visit our group page and don’t forget to RSVP (use the RSVP survey on the main page) if you’re planning to attend.
| Presentation: | Understanding Power BI Dataflows |
| Date: | December 3, 2018, Monday |
| Time | 6:30 – 8:30 PM ET |
| Place: | Microsoft Office (Alpharetta) 8000 Avalon Boulevard Suite 900 |
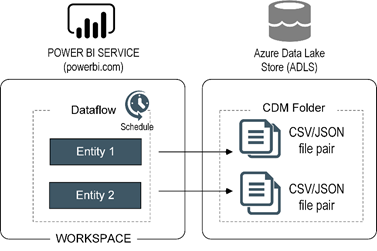
| Overview: | If you’re a business user, you might know about Microsoft Flow. If you’re a BI pro, you might have used the SSIS Control Flow and Data Flow. But do you know about the Power BI dataflow? Data preparation is often the most labor-intensive component of an analytics project and getting this right is vital if the results are to be accurate. While the growth of self-service BI has empowered users to answer important questions, ensuring well managed data is available to all employees remains one of businesses biggest challenges. Requiring no additional cost, dataflows are a building block of the Power BI ecosystem, providing a no-code/low-code approach using Power Query to create curated datasets that can be easily consumed by business analysts. Attend this presentation and you’ll learn:
|
| Speaker: | Through his Atlanta-based company Prologika (https://prologika.com), a Microsoft Gold Partner in Data Analytics, Teo Lachev helps organizations make sense of their most valuable asset: their data. His strategy formulation, trusted advisory and mentoring, design and implementation services empower clients to apply effectively data analytics in order to understand, improve, and transform their business processes. Teo has authored and co-authored several bestselling books on organizational and self-service data analytics, and he has been leading the Atlanta Microsoft BI and Power BI group since he founded it in 2010. Teo has been a Microsoft Most Valued Professional (MVP) Data Platform since 2004. |
| Sponsor: | A3 Solutions is the developer of A3 Modeling. Empower your finance team with the only tool that supercharges end-user Excel into Enterprise Excel. Why incur the risk and cost to replace your Excel models? Just add A3! The San Francisco-based company’s product is in use at some of the world’s largest manufacturers, financial firms and retailers including Honda Manufacturing, Williams Sonoma, T.Rowe Price, and Fox TV, in addition to many mid-sized organizations. http://www.a3solutions.com/ |
| Prototypes with Pizza | “New relationship view, paginated reports, and filter pane” by Teo Lachev |