Power BI churns out new features fast but not all features are available everywhere. As one of the most confusing aspects of Power BI, feature availability depends on the data acquisition method (data import vs live connections) and across Power BI product offerings (Power BI Desktop, Power BI Service, Power BI Report Server, and Power BI Mobile). Microsoft has left gaps in the product documentation and UI to clearly indicate feature availability. For example, while you can add a Q&A button in Power BI Desktop irrespective of whether you import or connect live, the button won’t work with live connections because Q&A for Creators is available only when data is imported.
This blog is my first attempt to clarify the feature availability based on the data acquisition method. All features work when you import data. Therefore, this option is not listed in the table. Direct connections however and not that fortunate. DirectQuery is when you connect directly to all data sources except Analysis Services. Because Power BI knows more about Analysis Services, direct connectivity to Analysis Services is listed separately. A while back I asked Microsoft why certain features are not supported with live connections to Analysis Services, especially to Tabular. To me, there shouldn’t be any difference between data import and using an external Tabular connection. At the end, it’s all Tabular behind the scenes. The answer back then was related to performance concerns for chatty features with external Tabular models. I continue pushing to eliminate these discrepancies if possible over time and provide more feature parity. The table omits features that are supported by the three connectivity options.
DirectQuery
Live Connection to Analysis Services1
Binning
Yes
No
Calculated column
Yes2
No
Calculated measure
Yes2
Yes2
Change field data type
Yes
No
Change field formatting
Yes
No
Clustering
No
No
Custom groups
Yes
No
Data categories for fields
Yes
No
Explain Increase/decrease (Power BI Desktop)
No
No
Fields properties
Yes
No
Hierarchies
Yes
No
Power Query
Yes
No
Q&A in dashboards (Q&A for consumers)
No
Tabular only
Q&A in reports (Q&A for creators)
No
No
Quick Insights (Power BI Service)
No
No
Relationships
Yes
No
Row-level Security (Power BI Desktop)
Yes
No3
Synonyms
Yes
No
What-if
No
No
In general, besides calculated measures for Tabular, no modeling features are available with live connections to Analysis Services. This makes sense to avoid a semantic model (Power BI Desktop) over a semantic model in Analysis Services. In fact, Data, Relationships, and Query Editor (Power Query) are not available when connecting directly to Analysis Services.
See this page for DAX limitations in DirectQuery mode.
Analysis Services has its own security mechanism.
https://prologika.com/wp-content/uploads/2016/01/logo.png00Prologika - Teo Lachevhttps://prologika.com/wp-content/uploads/2016/01/logo.pngPrologika - Teo Lachev2018-06-10 15:14:482018-06-11 16:10:25Power BI Feature Discrepancies for Data Acquisition
Standing room today for my presentation on the same subject at SQL Saturday Atlanta. I uploaded the slides to the event site and to my LinkedIn profile page. This week was packed with training events. One more event to organize for the Atlanta Power BI Group on Monday…
https://prologika.com/wp-content/uploads/2016/01/logo.png00Prologika - Teo Lachevhttps://prologika.com/wp-content/uploads/2016/01/logo.pngPrologika - Teo Lachev2018-05-19 17:59:222021-02-17 01:01:2210 Ways to Empower your BI Strategy with Power BI
MS BI fans, join us for the next Atlanta MS BI and Power BI Group meeting on Monday, May 21st at 6:30 PM. Paco Gonzálezwill take us into a deep dive into Microsoft Cognitive Services and how to integrate them with Power BI. SolidQ will sponsor the meeting. And your humble correspondent will introduce you to Power BI Premium incremental refresh. For more details, visit our group page and don’t forget to RSVP (use the RSVP survey on the main page) if you’re planning to attend.
Atlanta BI Group May 21st Meeting Reminder
Please RSVP to help us plan food by 2 PM on the day of the meeting by latest:
Choose Yes and submit the RSVP survey found at the right top corner of the page.
Please note that the voting system tracks votes by cookies. If you don’t see the option to submit the survey, clear your browser cookies, or right-click the Internet Explorer icon, and then click Start InPrivate Browsing. Free covered parking is available at South or North Terraces. Or, use the free open non-ticket parking next to North Terraces (coming north on Ashford Dunwoody, turn left on Perimeter Center Terrace and them immediately right).
Presentation:
Artificial Intelligence, Cognitive Services, and Power BI
Level: Intermediate
Date:
May 21, 2018
Time
6:30 – 8:30 PM ET
Place:
South Terraces Building (Auditorium Room)
115 Perimeter Center Place
Atlanta, GA 30346
Overview:
Microsoft Cognitive services is a series of services based on Microsoft Research using Deep Learning techniques, ready for you to enrich your unstructured data. Microsoft Services includes: Vision (Computer Vision, Emotion, Face, Video), Speech/Language (Speaker Recognition, Spell, Sentiment, Language, Key Phrases, Topic detection, Linguistic Analysis), Knowledge, and Search. These services are consumed by using the Cognitive Services APIs. Power BI enables you to consume the APIs to enrich your unstructured data inside your Power BI solutions. During this session, we will cover how to consume the API using Power Query to then visualize the results with Power BI visuals. We will also consume the Cognitive services API by using a R script inside Power BI. This session is structured with a B2C Survey case study solution with a real time Dashboard using a streaming dataset.
Speaker:
SolidQ North America’s CEO, Paco González specializes in helping organizations become “data driven” from a strategic and technical perspective. He is a speaker at small and large conferences such as PASS Summit, Ignite, DevWeek London, or PAW. Paco focuses in Business Analytics and Artificial Intelligence. Paco has published several books and whitepapers. A Microsoft Certified Trainer and Microsoft Certified Professional. Paco is based in Atlanta.
Sponsor:
The tools and technologies to manage information will constantly evolve, but the need for accurate and actionable information is timeless. SolidQ delivers services for Microsoft platforms that help you architect, integrate and optimize your use of data. The result? Our clients think bigger and move faster because we help them build the capacity and skills to interact with data in creative, collaborative ways that deliver new insights to the business. At SolidQ we measure our success by your satisfaction – and we guarantee it.
https://prologika.com/wp-content/uploads/2016/01/logo.png00Prologika - Teo Lachevhttps://prologika.com/wp-content/uploads/2016/01/logo.pngPrologika - Teo Lachev2018-05-14 08:01:112021-02-17 01:01:21Atlanta MS BI and Power BI Group Meeting on May 21
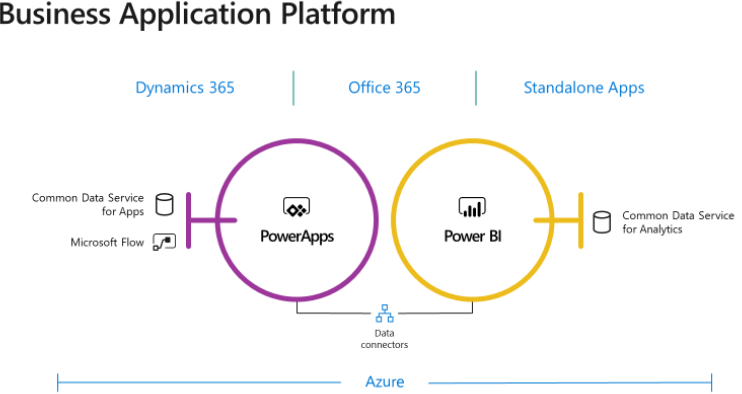
BI and data integration projects often benefit from an operational data source (ODS), whose benefits and design I discussed in my “Designing an Operational Data Store (ODS)” newsletter. Think of the Microsoft Common Data Service for Apps (CDS for Apps) as a cloud ODS by Business and for Business. Officially introduced in 2016 and running on Azure SQL Database, CDS for Apps is now the entity and data model behind Dynamics 365. This is where Dynamics 365 stores its data. Microsoft is readying a preview of another CDS flavor (CDS for Analytics) in June 2018. Think of CDS for Apps as the OLTP version of the ODS and is designed for transactions (this is why it’s layered on top of SQL Server), while CDS for Analytics is oriented towards OLAP (this is why is layered on top of Azure Storage).
Both CDS types support standardized entities, whose definitions are documented in the GitHub repository of the Common Data Model. Currently, the schema of these entities is designed and controlled by Microsoft and it’s limited to Dynamics entities, such as Account, Opportunity, and so on. However, Microsoft hopes that other vendors will provide solutions and extend the CDS schema. Of course, because CDS is your database, you can extend it with your own custom entities. The rest of the document focuses on CDS for Apps only.
The Good
There is a lot to like about CDS for Apps. Let’s start with pricing. Other vendors, such as Oracle and Teradata, have similar visions and products but their offerings are very expensive. The CDS for Apps pricing is included in the PowerApps licensing model because PowerApps is the primary client for creating CDS for Apps-centered solutions. Using CDS outside selected Dynamics 365 plans (that include it already) will cost you at least $7 per user and per month.
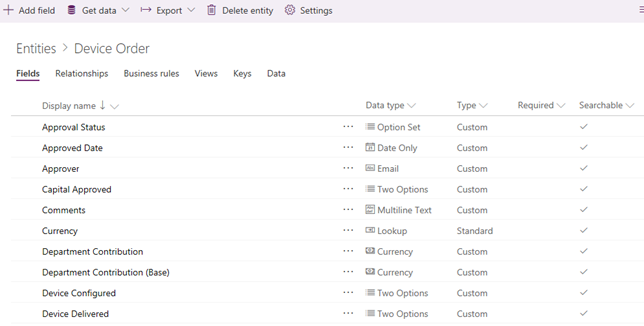
CDS for Apps is more than just a data repository. It’s a business application platform with a collection of data, business rules, processes, plugins and more. In this regard, it resembles SQL Server Master Data Services (MDS). The modeler can:
Define and change entities, fields, relationships, and constraints. For example, the screenshot shows a custom Device Order entity that I’ve created.
Business rules, such as to prepopulate Ship Date based on Order Date.
Secure data to ensure that users can see it only if you grant them access. Role-based security allows you to control access to entities for different users within your organization.
Besides the original PowerApps canvas apps (like InfoPath forms), CDS for Apps also opens the possibility to create model-driven PowerApps applications (require PowerApps P2 plan). Model-driven apps are somewhat like creating Access data forms but more versatile. Because PowerApps knows CDS for Apps, you can create the app bottom-up, i.e. start with CDS for Apps and then generate the app based on the actual schema and data. For example, you can use PowerApps to build a model-driven app for implementing the workflow for approving a certain process. Model-driven apps are a new style of a PowerApps application that makes it easy to build entity forms, entity views, and workflows.
How do you get data into CDS for Apps custom entities? Your PowerApps app can write to it. Or, you can create and schedule a project that uses Power Query (yep, the same one as in Power BI) to load data from somewhere into CDS for Apps.
The Bad
How do you get data out from CDS for App, such as to import data from some entities into a Power BI model? Microsoft has released a preview build of the Common Data Service for Apps connector for Power BI. However, this connector is even slower that the Dynamics connector. It uses the OData v4 Web API. Based on my limited tests, it took the connector about a minute to download 40,000 rows from Dynamics, clocking 10% slower than the Dynamics connector. To make things worse, the connector doesn’t support query folding, so Power BI must download the entire dataset before Power Query applies filters. Because the connector doesn’t support also REST filter and select predicates, so you can’t filter data or select a subset of columns at the source. Microsoft is actively working on improving the connector performance and it might get better in time.
Continuing down the list of limitations, CDS for Apps doesn’t support change tracking (to capture changes to a given row) and incremental loads, such as to load or refresh only the data that has changed yesterday or previous month. These are all essential features that could make ODS even more valuable.
The Ugly
For years people were complaining that after migrating from the on-premises Dynamics to the cloud, they lost the ability to connect to its database directly and they had to rely on the REST APIs (slow) or Data Export Service to export the data to an SQL Server Database (fast but requires additional effort and budget). Unfortunately, although CDS for Apps stores data in Azure SQL Database, Microsoft doesn’t expose its database directly to get data out fast and bypass the REST endpoint. When I raised this issue to Microsoft I got feedback that CDS for Apps is a business platform and there are layers on top of data to handle security, rules, calculations, and so on. However, the argument that CDS for Apps is more than just a database is nonsensical to me. Try to explain to a customer that cakes have layers and CDS for Apps has layers, and therefore getting something out of it is slow. As I mentioned, the “layered nature” of the CDS is conceptually like MDS. In fact, I see a lot of overlap. MDS also supports rules, security, etc. but it doesn’t force me to go through the web service interface if all I need is the raw data. Hence, my wish to support direct connectivity to the Azure SQL Database endpoint of CDS for Apps.
The success of Common Data Services for Apps will depend largely on adoption and contributions by Microsoft partners. Although it lacks typical ODS features and fast connectivity, CDS for Apps gains in “business platform” features. It will be interesting to see how much traction it will gain with business users as a staging area given that CDS for Apps is designed from ground up for business users.
https://prologika.com/wp-content/uploads/2016/01/logo.png00Prologika - Teo Lachevhttps://prologika.com/wp-content/uploads/2016/01/logo.pngPrologika - Teo Lachev2018-05-12 17:40:282018-05-22 13:30:27Microsoft Common Data Service for Apps: The Good, the Bad, the Ugly
Thank you to everyone attending the Power BI workshop by Prologika yesterday. We had another great turnout with more than 50 people from 30+ companies attending the event at the Microsoft Technology Center in Alpharetta! Kudos to Eric Flamm and Michael Folarinde for the great job proctoring the event. Here is some feedback that the attendees shared in the post-event survey:
“I was frustrated and confused with using Power BI service and Desktop because I didn’t know how to manipulate the visualizations, slicers, etc. and thought the tools were not capable. I walk away from this now knowing this information and excited to use the tools to transform data to help our business.”
“Very informative and showed me new things despite me using PBI for a few months.”
“Very instructive and knowledgeable of our instructor Teo. He is very patient and answered all my questions.”
“The presenter was great. He was obviously very knowledgeable, was great at explaining the concepts, and was very patient.”
“The presenter, Teo, was extremely knowledgeable of Power BI. He presented the material in a clear and easy to follow format. He was able to answer all levels of questions from beginner to advanced and even questions regarding infrastructure and how to implement Power BI into small or large organizations. I really enjoyed that we were given time to actually perform the various tasks ourselves and then get help along the way. It really helped to reinforce the lessons we had just learned.”
“…The instructors were very helpful with any questions.”
And my next week is entirely booked with more Power BI training. It’s great to witness and participate in the great momentum surrounding Power BI!
https://prologika.com/wp-content/uploads/2016/01/logo.png00Prologika - Teo Lachevhttps://prologika.com/wp-content/uploads/2016/01/logo.pngPrologika - Teo Lachev2018-05-11 16:52:212018-05-11 16:53:30Another Successful Power BI Workshop
In my “Why Business Like Yours Choose Power BI Over Sisense” blog, I discussed how Sisense seeks a competitive advantage by offering a user-friendly designer connected to the their ElastiCube, thus claiming that Sisense is a better choice with larger datasets because business users don’t have to use professional tools (Visual Studio) or deploy to external servers. Things have changed in Power BI since then. Microsoft increased the dataset size to 1 GB (Power BI Pro) and 10 GB (Power BI Premium). A 10 GB compressed dataset is a lot of data (probably allowing you to import over a billion rows). But fully refreshing a large dataset is no fun and it can take many hours (see my blog “Processing AAS Models Asynchronously” for some stats).
Fortunately, the May release of Power BI Desktop brings incremental refresh, which a feature that was previously only available in Analysis Services. As its name suggests, the primary goal is to reduce the time required to refresh datasets with imported data by processing only data that has changed instead of the entire dataset.
I was involved and provided feedback during the prerelease testing of Power BI incremental refresh. Without reiterating the documentation, here are some things you need to pay attention to:
Incremental refresh is a Power BI Premium feature. Although you configure it in Power BI Desktop, you can’t test it in Power BI Desktop. You must deploy the file to a premium workspace to put it in action. I provided feedback that this feature should be also available in shared capacity workspaces because its primary goal is to reduce resources in a shared environment but as it stands incremental refresh is a premium feature.
Associate the RangeStart and RangeEnd query parameters in a custom filter to one column in the table set up for incremental refresh. During development, it makes sense to load a subset of the data, such as for only one year. So, set RangeStart and RangeEnd accordingly.
When you define a custom filter that uses RangeStart and RangeEnd on the table you configure for incremental refresh, triple verify the filter range to ensure that rows don’t overlap. Here is an example of a correct custom filter. If I make a mistake and I change the right boundary to [OrderDate] <= RangeEnd, then I’ll get overlapping rows for the end period. So, make sure that you don’t specify the equal sign in both the left boundary and right boundary. = Table.SelectRows(dbo_FactResellerSales, each [OrderDate] >= RangeStart and [OrderDate] < RangeEnd)
I suggested Microsoft provide a narrative that restates the configuration of the incremental refresh policy. For example, the configuration below means “This policy will load historical data from Jan 1st, 1997 to the current date. Subsequent refreshes will process only the last 10 days to the current system date (UTC time).”
When you deploy to *.pbix file to a premium workspace and navigate to the dataset refresh page, you’ll see that the entire Parameters section is disabled. This is a bug which should be fixed by the time incremental refresh goes out of preview. It should remove or disable only the RangeStart and RangeEnd parameters but enable other query parameters. That’s because the RangeStart and RangeEnd parameter values are not used once the model is published.
Because incremental refresh requires a new schema comparability level, you can’t connect to Power BI Desktop models in SSMS. Incremental refresh also breaks the feature for importing Power BI Desktop files in Azure Analysis Services.
What happens behind the hood?
You should appreciate how simple Power BI incremental refresh is to set up. BI pros know that SSAS partitions take some effort to set up. It gets more complicated when you need to set up rolling partitions and merge partitions. In Power BI, you only need to configure the refresh policy and Microsoft takes care of the rest. Behind the scenes, Microsoft introduced a new partition type that has a refresh policy and parameterized query using the RangeStart and RangeEnd parameters. When the model is refreshed, Power BI expands this partition type and creates the actual table partitions. Considering the above setup, it creates 20 yearly partitions, 1 Quarter partition (for Q1 2018), and 35 daily partitions, assuming the current date is May 5, 2018. These partitions get consolidated and merged over time. For example, once Q2 is full, all daily partitions are merged into a monthly partition, and when the quarter is complete, monthly partitions get merged into a quarterly partition, then quarters get merged into years. Power BI also takes care of removing older partitions when they fall off the range (sliding window).
As the documentation mentions, a “preview” limitation is that subsequent publishing from Power BI Desktop replaces the published refresh policy and triggers a full load on the next refresh. Remember that full load happens once the first time you initiate manual or scheduled refresh of the published dataset. Once the dataset is fully loaded, subsequent refreshes load the dataset incrementally (the last 10 days with the above configuration). Currently, there isn’t a way to reload the dataset (full refresh), such as when you discover the historical data has issues and you need to reload the history, except deleting the dataset and republishing it. I hope that Microsoft will enable access to the Analysis Services Tabular management endpoint to support such scenarios. Or, a better option might be to extend the Parameters section in the refresh page to include an option for full load so that the business user can trigger a full reload.
Query Folding
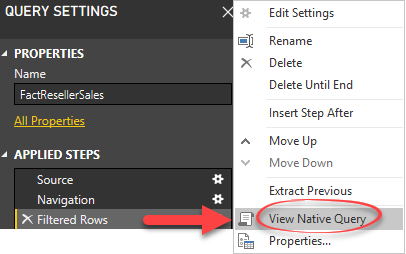
One important consideration to keep in mind is that incremental refresh works best with data sources that support query folding. Such data sources pass through some Power Query transformation steps, such as filtering and grouping, to the underlying data source to improve performance and avoid loading the entire dataset before filtering and grouping is applied. To determine if a specific step is “folded”, right-click the step, such as Filtered Rows, in the Applied Steps pane and observe if the “View Native Query” is enabled.
Although Microsoft doesn’t have an official list of data sources that support query folding and what steps are folded, typically relational data sources and data sources that can handle the SQL WHERE clause support query folding. Excel and text files do not. It’s important to check query folding because it the data source doesn’t support it, Power BI Desktop currently doesn’t prevent incremental refresh but it will load all the data before the filter is applied. Specifically, the query mashup (M) engine will apply the filter as it reads the rows before it gets loaded into the partitions. You might be able to mitigate this performance issue with non-foldable sources by applying the RangeStart/RangeEnd filter when the initial query is sent to the data source. For example, Dynamics Online supports a $filter clause that will work with incremental refresh:
= OData.Feed(“<endpoint url>/sales?$filter=CreatedDate ge ” & Date.ToText(RangeStart) & ” and CreatedDate lt ” & Date.ToText(RangeEnd)”)
Power BI incremental refresh is an important enhancement to the Power BI data architecture. A Power BI premium feature, incremental refresh brings the following benefits for tackling larger datasets: data loads are faster, data loads are more reliable (no long-running connections), and reduced resource consumption.
https://prologika.com/wp-content/uploads/2016/01/logo.png00Prologika - Teo Lachevhttps://prologika.com/wp-content/uploads/2016/01/logo.pngPrologika - Teo Lachev2018-05-08 13:39:372021-02-17 01:01:53Notes on Power BI Incremental Refresh
Everyone has a different opinion about what self-service BI should be. But to many people the journey starts and stops with Microsoft Excel. Excel is the self-service BI nirvana. If the user can’t see and filter the detail data, even the most sophisticated self-service BI tool cannot be trusted. And since everyone knows how to do this in Excel, why should they use other tools? To me, the best self-service BI is empowering business users to connect to an organizational semantic model, ideally with Excel as a front end. Most of my current projects use Analysis Services Tabular for implementing semantic models. Therefore, it’s so frustrating that Excel still lacks good support for Tabular. For example, it splits a Tabular table into two tables (“dimension” and “measure group”) because Excel still uses the MDX interface. To make things worse, all fields in the “dimension” table has a Text data type because it gets only the field caption and not the data type. As a result, you can’t filter and compare date and number fields from the “dimension” tables.
According to Microsoft, a better Excel-Tabular combo hasn’t yet bubbled up high based on the feedback that the Excel team gets from customers. In an attempt to get the proper attention, I just posted the “Better Support for Analysis Services Tabular” wish list on Excel User Voice. I bundled multiple items into one wish list.
Please vote if you care.
It’s about time to improve support for SSAS Tabular:
1. Auto-generate DAX.
2. Avoid splitting a table into a “measure group” and “dimension”. See how PBI Desktop handles metadata.
3. Carry over data types so that users can create reports, such as show me invoices where Due Date is greater than … Currently, all dimension table fields map to Text.
4. Many customers have expressed interest in connecting Excel tables directly to Tabular, bypassing Pivot Table, so they can use the column dropdowns and other Excel Table goodness.
5. Support descriptions as tooltips when the user hovers on a field in the Field List.
https://prologika.com/wp-content/uploads/2016/01/logo.png00Prologika - Teo Lachevhttps://prologika.com/wp-content/uploads/2016/01/logo.pngPrologika - Teo Lachev2018-05-02 17:16:542018-05-02 17:21:25Help Improve Excel as Analysis Services Front End
SQL Saturday Atlanta is a must-attend, full-day event for the community, by the community. This year SQL Saturday will take place on May 19th at Gwinnett Technical College – Alpharetta, 2875 Old Milton Pkwy, Atlanta, Georgia, 30009. Prologika will deliver two presentations:
Master Data Management with SQL Server 2016 MDS
According to the Top Business Intelligence Trends 2018 survey by BI-Survey.com and based on feedback from over 2,000 BI professions, the top BI trend this year is Master Data/Data Quality Management. Having consulted with a large insurance company on master data management with SQL Server 2016 for years, Neal Waterstreet has plenty of best practices to share on this topic, so join his session at 8:30 AM.
Want to know the position Master Data Management and MDS play in an organization’s overall data strategy? We’ll review the key concepts and the different roles and responsibilities to help you get your organization moving forward with MDM. We’ll then take a look at the features of SQL Server 2016 MDS that make it an excellent tool for MDM. This demo-packed presentation will cover architecture and installation, different ways of processing data, hierarchies, security and many other features that will get you up and running with MDS.
10 Ways to Empower Your BI Strategy with Power BI
“Data discovery/visualization” and “Self-service BI” take the next top spots in the above survey. According to the 2018 Magic Quadrant for Analytics and Business Intelligence Platforms by Gartner (and I agree), Power BI is the best platform for address these needs. Join me at 2:15 PM to discuss how Power BI can augment your BI strategy.
Not sure what value Power BI brings to your BI projects? Join me to discuss 10 ways Power BI can help augment your existing or envisioned Power BI strategy. If you’re interested in the Power BI but you’re not sure how it fits within your organizational BI strategy, this event is for you. Discussion points include:
Organizational BI
Self-service BI
Cloud vs. on-premises deployments
Predictive analytics
External reporting
Power BI-centric integrated solutions
https://prologika.com/wp-content/uploads/2016/01/logo.png00Prologika - Teo Lachevhttps://prologika.com/wp-content/uploads/2016/01/logo.pngPrologika - Teo Lachev2018-05-01 20:30:362018-05-01 20:30:36Presentations by Prologika at SQL Saturday Atlanta 2018
After a few years of extensive development and beta testing, Tableau announced its data preparation tool (Tableau Prep) for “redefining your data prep experience”. Previously, Tableau relied on other vendors, such as Alteryx, for self-service data preparation. Naturally, I wanted to take it for a spin and compare it with the Microsoft Power Query (available for free in Power BI Desktop and Excel), which has been around since January 2013. Power Query was initially introduced as an Excel add-on but now it’s available in both Excel and Power BI Desktop. For those of you pressed for time, here is the gist:
Copy, remove, duplicate, column from example, calculated column, remove, remove duplicates, remove errors, change type, rename, transform (lower, upper, trim, etc.), replace values, replace errors, split column, index column, group by, fill, pivot, move, format, extract, number column (statistics, standard, scientific, math), date and time column, R script
Filter (formula required), group and replace, clean (upper, lower, trim, remove characters), split, rename, remove, calculated field
Directly into PBI data model, Excel sheet (Power Query in Excel only)
Save as TDE, Hyper, CSV, preview in Desktop
Output options
One table in the model per query (typically)
One output from Tableau Prep file (Tableau model can’t handle multiple tables)
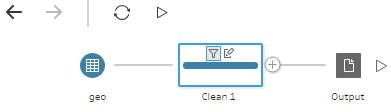
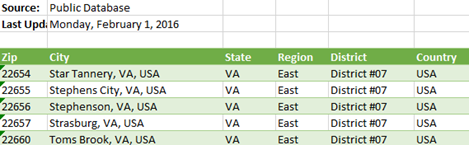
It’s clear that Tableau Prep is far behind the Power Query capabilities and has a lot of catching up to do. I took Tableau Prep for a quick ride to do simple data prep. The goal was to cleanse the geo table in the bi_dimensions Excel file that Microsoft provides as sample data for Dashboard in a Day (DIAD) workshops.
The geo table has a small (but common) issue because it has some extra rows that appear before the main dataset. These rows needs to be removed and the labels in the forth row needs to be promoted as column headers. Simple right?
In Power Query, you can quickly filter out top or bottom rows. No formulas or functions required. There wasn’t such a feature in Tableau Prep. I had to use a column filter (requires an expression) to filter out the top three rows. So much about “a drag-and-drop visual experience” and “no scripting required”. I also couldn’t find a feature to quickly promote column headers. In my opinion, Power Query is by far more user friendly than Tableau Prep.
After enough wrangling to do what’s simple in Power Query but complicated in Tableau Prep, I wanted to save the results. In Power BI Desktop and Excel, you can conveniently load the transformed data directly into the data model. Then, to reflect the changes in the data source, such as when you get a new file with the same spec, you just refresh to re-import and transform the data. No such integration with Tableau Prep. It’s designed to run the flow manually. And to me the biggest limitation of the tool, which stems from the limitation in the Tableau modeling capabilities, is that everything falls apart when you need multiple tables in your data model. Tableau’s mentality remains “one dataset at the time”.
I’ve noticed people excited about the Tableau Prep graphical interface. While it does help visualizing the flow I’m not sure how much value it really adds given that the steps are sequential, and the tool doesn’t support conditional constraints and branches. But you have pretty icons…without much behind.
While testing the tool, I couldn’t help but ask myself “Why pay hundreds of dollars per user/per year for Tableau Creator when Power BI Desktop is better and free?”
MS BI fans, join us for the next Atlanta MS BI and Power BI Group meeting on Monday, April 30th at 6:30 PM. Patrick LeBlanc will do a deep dive into Power BI Report Server. TEKsystems will sponsor the meeting. And your humble correspondent will demo several latest Power BI features: buttons and Q&A. For more details, visit our group page and don’t forget to RSVP (use the RSVP survey on the group page) if you’re planning to attend.
Atlanta BI Group April 30th Meeting Reminder
Please RSVP to help us plan food by 2 PM on the day of the meeting by latest:
Choose Yes and submit the RSVP survey found at the right top corner of the page.
Please note that the voting system tracks votes by cookies. If you don’t see the option to submit the survey, clear your browser cookies, or right-click the Internet Explorer icon, and then click Start InPrivate Browsing. Free covered parking is available at South or North Terraces. Or, use the free open non-ticket parking next to North Terraces (coming north on Ashford Dunwoody, turn left on Perimeter Center Terrace and them immediately right).
Presentation:
Power BI Report Server: A Deep Dive
Level: Intermediate
Date:
April 30, 2018
Time
6:30 – 8:30 PM ET
Place:
South Terraces Building (Auditorium Room)
115 Perimeter Center Place
Atlanta, GA 30346
Overview:
So, you think you know everything you need to know about the Power BI Report Server because you use traditional SQL Server Reporting Services. Well, don’t believe it. In this session we are going to discuss topics such as Configuring Kerberos to resolve connectivity issues. We will discuss different authentication types, when you need them, why you need them and how to use them. We will then jump into configuring your report server to host Excel workbooks using Office Online Server. Finally, we will demonstrate how to configure an SSAS Power Pivot instance for the Excel data model. In addition to these topics, we will discuss other advanced topics such as connectivity and high availability during this demo-heavy session.
Speaker:
Patrick LeBlanc is a currently a Data Platform Solutions Architect. Along with his 15+ years’ experience in IT he holds a Master of Science degree from Louisiana State University. He is the author and co-author of five SQL Server books. Prior to joining Microsoft, he was awarded Microsoft MVP award for his contributions to the community. Patrick is a regular speaker at many SQL Server Conferences and Community events.
Sponsor:
People are at the heart of every successful business initiative. At TEKsystems, we understand people. Every year we deploy over 80,000 IT professionals at 6,000 client sites across North America, Europe and Asia. Our deep insights into IT human capital management enable us to help our clients achieve their business goals – while optimizing their IT workforce strategies. We provide IT staffing solutions, IT talent management expertise and IT services to help our clients plan, build and run their critical business initiatives.
Prototypes with Pizza
“Buttons and Q&A Explorer” by Teo Lachev
https://prologika.com/wp-content/uploads/2016/01/logo.png00Prologika - Teo Lachevhttps://prologika.com/wp-content/uploads/2016/01/logo.pngPrologika - Teo Lachev2018-04-23 09:40:482021-02-17 01:01:20Atlanta MS BI and Power BI Group Meeting on April 30th