Power BI Writeback
One of the Power BI most prominent strengths is that it’s a part of the much broader Microsoft Data Platform that spans various on-premises and cloud offerings for data storage, processing, and analysis. After the integration with Visio, Power BI just took another leap forward with the introduction of the PowerApps custom visual. Use this visual to bridge the Data Analytics and Developer worlds. Now your Power BI apps can integrate with Line of Business (LOB) applications in versatile ways. Suppose you have a Power BI report that shows sales by customers. As the user browses the data, he realizes that some changes need to be made. Granted, the user can open the appropriate business app and make the changes there, and then go back to the report to see the changes. But read-only reports and are so 20th century. Instead, why can’t we allow the user to make the changes on the report by integrating it with PowerApps? This scenario is commonly referred to as writeback.
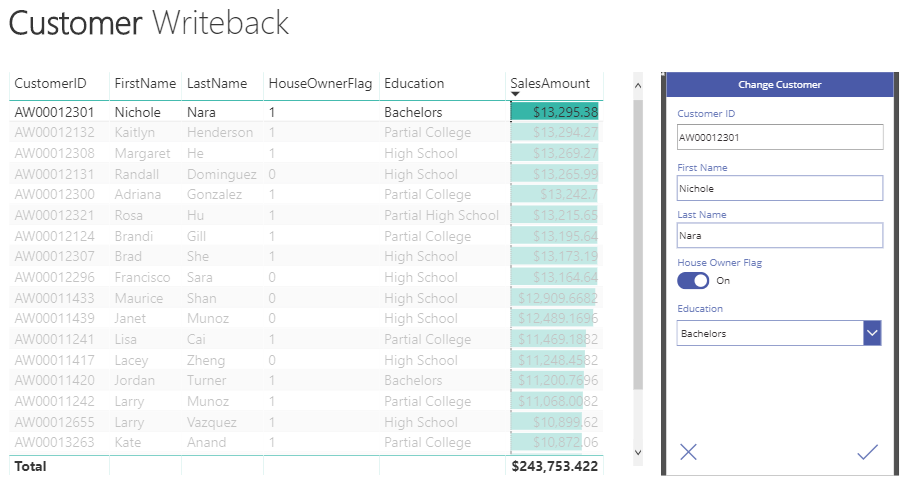
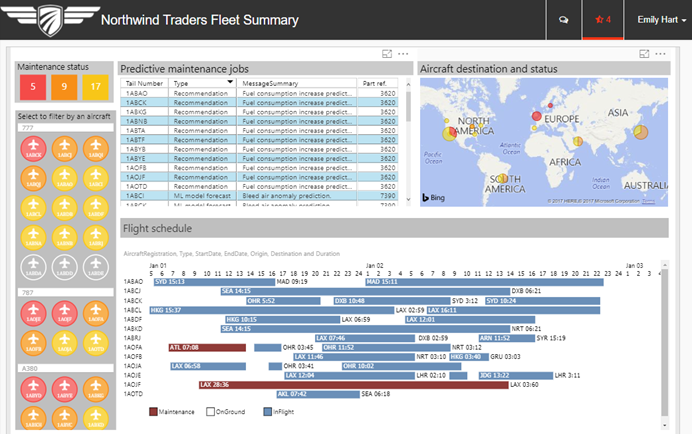
This is exactly the approach my Customer Writeback app demonstrates. The user selects a customer in the table and the customer details show up in the Change Customer visual to the right. This is the PowerApps visual that references my Customer Writeback PowerApps app. The user can make changes in the form and save the changes back to the underlying database. Then he can refresh the report to see these changes. If you have experience with PowerApps, implementing this scenario takes minutes. If this is the first time you hear about PowerApps, don’t worry; it’s take much to learn it especially if you have a developer background. Here are the important implementation details:
- Implement your Power BI report first. In my case, I implemented the report in Power BI Desktop. I connected live (DirectQuery) to my AdventureWorksDW2012 Azure SQL Database. Connecting live is preferable for writeback reports because the user can just refresh the report to see the updates. If your Power BI Desktop file imports the data, the user would have to wait for the dataset to refresh to sync the data changes.
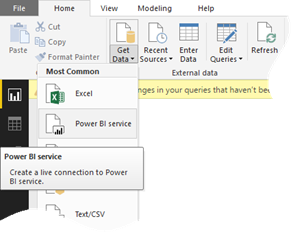
- Deploy the report to Power BI Service (powerbi.com). Currently, only published reports can create new PowerApps apps (Power BI Desktop reports can only connect to existing apps).
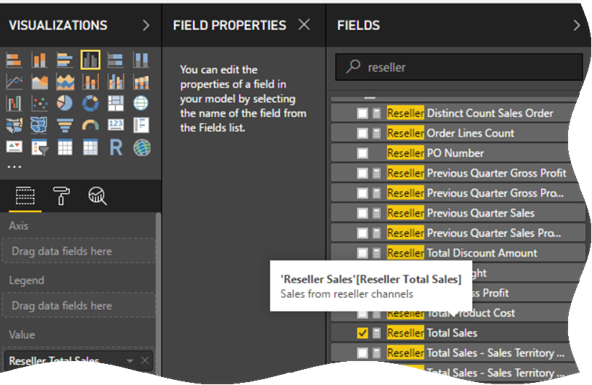
- Open the report in edit mode. In the Visualizations pane, click the ellipsis (…) button and import the PowerApps custom visual from the Office Store. With the PowerApps visual selected, add the fields that you want to make available to PowerApps. When the report is previewed, Power BI will pass to PowerApps a dataset with these fields.
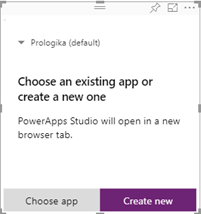
- In the PowerApps visual, click Create New to create a new app. This will open the PowerApps Web Studio, but you prefer developing on the desktop, there is also a desktop version of the PowerApps Studio that you can install from the Microsoft Store.

- My app is as simple as it could be. All is needed is a single form that populates its fields from the same AdventureWorksDW2012 database. The form uses the following expression for the Item property. Although Power BI passes a dataset, in my case the dataset has only one record, so the First function returns that record. When you create the app, Power BI would create a PowerBIIntegration custom data source, which is what Power BI uses to pass the data. The expression filters the form source data where CustomerID in DimCustomer table matches the Customer ID field pushed by Power BI.
First(Filter(‘[dbo].[DimCustomer]’, CustomerAlternateKey = First(PowerBIIntegration.Data).CustomerID ))
- Your app can use any of the PowerApps controls to visualize the data, including toggles, dropdowns, data pickers, buttons, and so on. Because the Toggle control expects a Boolean field, I couldn’t just submit the form to update the underlying record. Instead, I had to rely on the Patch function to translate the Boolean value to ‘1’ or ‘0’ because that’s the values the DimCustomer table stores.
Patch(‘[dbo].[DimCustomer]’, First(Filter(‘[dbo].[DimCustomer]’, CustomerAlternateKey = First(PowerBIIntegration.Data).CustomerID )),{FirstName:DataCardValue2.Text,LastName:DataCardValue3.Text,HouseOwnerFlag:If(Toggle1.Value=true, “1”, “0”), EnglishEducation:Education.Selected.Value})
- Preview the app to test it as you go. To test it from the Power BI report, you need to publish the app. Before you go live, don’t forget to share the app with the same users that will view your report. One of nice aspects of the Power BI integration with Power Apps is that the custom visual references to the published app so that you can test the changes as you develop. However, one thing I encountered is that sometimes the changes are not immediately reflected, so I had to navigate off the report and come back to it to test the latest changes.
The Power BI integration with PowerApps opens exciting new possibilities and redefines the meaning of a report. Because PowerApps integrate with Microsoft Flow, you can integrate your reports with “smart” applications that you can implement with almost no code! Featuring more than 100 data sources, you can use PowerApps as an integration hub to mash data from almost any place and then embed PowerApps screens in Power BI reports.
I attach the source code of the Customer Writeback app. You can open it in the desktop version of the PowerApps Studio.
 hope you’re enjoying this special time of the year – time for sharing and giving. Speaking of sharing, how does your company share BI artifacts with your B2B or B2C partners? Do you still send Excel spreadsheets or embed canned SSRS reports? If so, Power BI offers a better sharing model and I’ll show you how in this letter. And about Power BI, I’m proud to announce that the third revision of my “Applied Power BI Book” should be out in a week or so. Thoroughly updated to reflect the latest of the ever-changing cloud world of Power BI and featuring 20% new content, this book is the self-study resource your organization needs to master Power BI.