Prologika Newsletter Summer 2013


dashboard

The summer is finally here. With everything coming to fruition, there are exiting news in the Microsoft BI land, the most important of which I’d like to recap in this newsletter. Before I start, I want to mention the availability of my Best Practices for Implementing Enterprise BI Solution presentation that you might find interesting.

POWER VIEW MULTIDIMENSIONAL

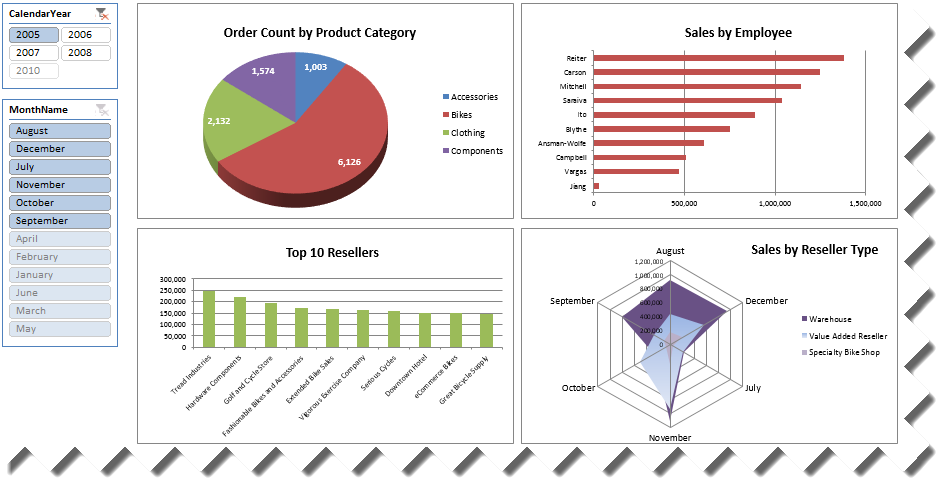
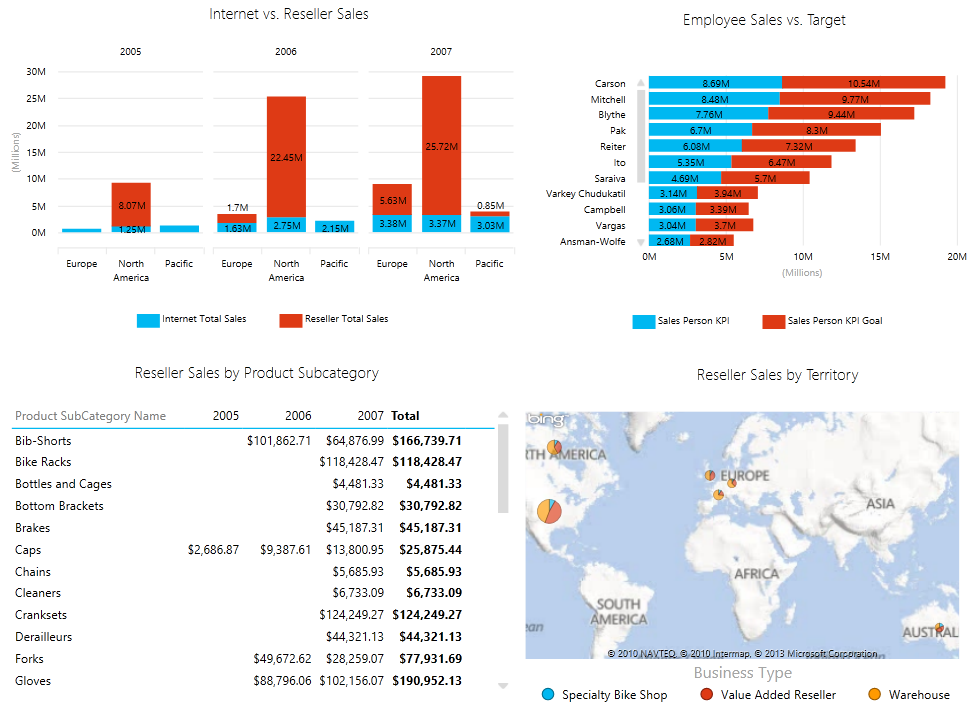
Also known as DAXMD, Power View has been extended in Cumulative Update 4 for SQL Server 2012 SP1 to support traditional OLAP cubes (known in SQL Server 2012 as Multidimensional). Now business users can easily author ad-hoc reports and interactive dashboards by leveraging your investment in OLAP. In my opinion, it should have been the other way around and Power View should have initially targeted Multidimensional. That’s because Multidimensional has much a larger install base than Tabular (recall that the latter debuted in SQL Server 2012). But better later than never, right? As a proud contributor to the DAXMD TAP program, I’m delighted with the results, as I discussed in my blog “DAXMD Goes Public”. I hate to dampen the spirit but be aware that as of now only the SharePoint version of Power View has been extended to support Multidimensional. We don’t know yet when the same will happen to Power View in Excel 2013. Anyway, this is a very important BI enhancement and it’s time to plan your DAXMD testing and deployment. Read the official announcement here.

daxmd

NEW SELF-SERVICE BI TOOLS

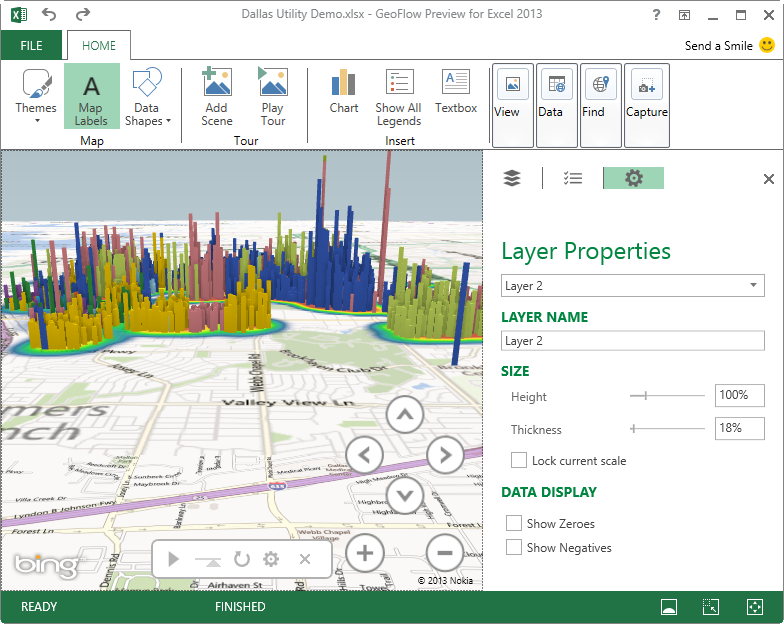
Never wavering in its commitment to self-service BI, Microsoft announced new tools to help business users transform and visualize data in Excel. Currently in preview, GeoFlow is a new 3D visualization add-in for Excel for mapping, exploring, and interacting with geographical and temporal data. GeoFlow requires Excel 2013. As it stands, it can source data from Excel spreadsheets only. Since this is somewhat limiting and I’d expect it to integrate with PowerPivot, or even better Analysis Services, at some point in future.

geoflow

Also in preview, Data Explorer is an add-on to Excel (Excel 2013 and 2010 are supported) that allows business users to discover and transform data before they analyze it in Excel or PowerPivot. In other words, Data Explorer is to Integration Services what PowerPivot is to Analysis Services. Some of my favorite Data Explorer features are the ability to merge, split, and unpivot columns. If your organization is into self-service BI and Data Explorer sounds interesting, check the Data Explorer tutorials. Check also the “5 Things You Need to Know about the Microsoft Data Explorer Preview for Excel” blog post by the Microsoft BI team.

WINDOWS AZURE INFRASTRUCTURE SERVICES

Microsoft announced also the availability of Windows Azure Infrastructure Services which is a collective name for running Virtual Machines and Virtual Networks in the cloud. Pricing get slashed too to be competitive with Amazon. What’s interesting is that these cloud VMs can be configured as an extension to your existing network. Speaking of BI, check the SQL Server Business Intelligence in Windows Azure Virtual Machines document if you’re interested in cloud BI deployments. Notice that there are VM templates that install SSRS (native mode), SSAS (Multidimensional), as well as SharePoint 2013 but you can install manually the other components as well if you need to, such as Tabular. Microsoft recommends Extra Large VM size for BI deployments although its memory capacity (14 GB) might be on the lower end especially for Tabular.

As you know, the BI landscape is fast-moving and it might be overwhelming. If you have Software Assurance benefits, don’t forget that as a Microsoft Gold Partner and premier BI firm, Prologika can use your SA vouchers and work with you to help you plan and implement your BI initiatives, including:

  • Analyze your current environment and determine a vision for a BI solution
  • Define a plan to launch a BI reporting and analysis solution
  • Upgrading or migrating to SQL Server 2012

Regards,

Teo Lachev

Teo Lachev
President and Owner
Prologika, LLC | Making Sense of Data
Microsoft Partner | Gold Business Intelligence

EVENTS & RESOURCES

SQL Saturday: Best Practices for Implementing Enterprise BI Solution presentation
Atlanta BI Group:Developing Custom Task in SSIS 2012 by Aneel Ismaily on 6/24
Atlanta BI Group: BI Theory vs. Practice by William Pearson on 7/27

Prologika Newsletter Spring 2013

Implementing Dashboards

dashboardMany organizations are considering digital dashboards for a quick 1000-foot view of the company performance. In this newsletter, I’ll review at a high level the options available in the Microsoft BI Platform for implementing dashboards and discuss how they compare.


PerformancePoint Services

PerformancePoint Services has been the Microsoft’s premium tool for implementing dashboards and scorecards in the SharePoint environment. Geared toward BI pros, PerformancePoint allows you to assemble content from multiple data sources and display it in interactive web-based dashboard pages. The screenshot (click to enlarge) demonstrates a PerformancePoint-based dashboard that Prologika implemented for a document management company.

pp

The Operational Scorecard by Month Scorecard displays a set of vital key performance indicators that are defined in an OLAP cube. The end user can filter the scorecard by month and territory, and SharePoint “remembers” the user selection. When the user selects a KPI row, the Operational Details Report Months section refreshes to show more context about that KPI. Moreover, the user can right-click a given cell of interest and initiate additional exploration. For example, the user can launch the Decomposition Tree to see how that value is contributed by other subject areas. The Show details menu drills through the cell and the Additional Actions menu allows the user to initiate a cube action (if defined in the cube). And, the user can change the report layout, such as switch from tabular to chart format, by using the Report Type menu. PerformancePoint requires SharePoint Server Enterprise Edition. It includes an authoring tool called Dashboard Designer which a BI pro can use to implement the dashboard.

Excel and Excel Services

If Excel pivot reports are sufficient to convey the dashboard message then look no further than Excel. You can connect Excel to an analytical layer, such as an OLAP cube or a Tabular model, and quickly assemble a dashboard consisting of PivotTable and PivotChart reports, such as this one.

excel

Once the dashboard design is complete on the desktop, you can upload the Excel file to SharePoint to publish the dashboard and make it available to other users. Thanks to Excel Services, SharePoint will render the dashboard in HTML and preserve its interactive features. And, in SharePoint 2013, end users can update the dashboard, such as by adding new fields to the pivot reports. Excel Services is available in SharePoint Server Enterprise edition.

Power View

Starting with SQL Server 2012, you have yet another option to design dashboards in SharePoint environment. Although the primary focus of Power View is ad hoc reporting, it can be used to implement highly-interactive dashboards connected to an analytical layer (Analysis Services Tabular and soon Multidimensional models). And, because it’s very easy to use, it allows business users with no BI or reporting skills to take the dashboard implementation in their own hands.

powerview

With a mouse click, end users can switch between visualizations, such as switching between a tabular report to a pie chart. Visualizing geospatial information, such as sales by region, has never been easier thanks to integration with Bing maps. And, maps are interactive to allow you to drill down, such from country to city. Power View requires SharePoint Server Enterprise Edition.

Reporting Services

Finally, don’t rule out Reporting Services reports. Although lacking in interactivity, operational reports gain in extensibility and customization. Moreover, this is the only implementation option in the Microsoft BI stack that doesn’t necessarily require SharePoint although you can deploy reports to SharePoint Foundation or higher edition.

ssrs

Summary

The following table summarizes the four dashboard implementation options.

Technology Pros Cons
PerformancePoint Designed for scorecards and KPIs
Supporting views
Decomposition tree
Customizable
BI pro-oriented
No “wow” effect
Excel Familiar pivot reports
Easy to implement
End-user oriented
Updatable views need SP13
No “wow” effect
Power View Highly interactive
Easy to implement
End-user oriented
No extensibility
No support for mobility
Requires Silverlight
Reporting Services Highly customizable
Rich visualizations
Doesn’t require SharePoint
Require SSRS skills
Canned reports
No “wow” effect

To learn more about dashboarding with Microsoft BI, attend my “Building Dashboards with the MS BI Stack” presentation for SQL Saturday in Atlanta on May 18th.


As you know, the BI landscape is fast-moving and it might be overwhelming. If you have Software Assurance benefits, don’t forget that as a Microsoft Gold Partner and premier BI firm, Prologika can use your SA vouchers and work with you to help you plan and implement your BI initiatives, including:

  • Analyze your current environment and determine a vision for a BI solution
  • Define a plan to launch a BI reporting and analysis solution
  • Upgrading or migrating to SQL Server 2012

Regards,

Teo Lachev

Teo Lachev, MVP (SQL Server), MCSD, MCT, MCITP (BI)
Prologika, LLC | Making Sense of Data
Microsoft Partner | Gold Business Intelligence

Upcoming Events

SQL Saturday: Building Dashboards with the MS BI Stack with Teo Lachev on May 18th
Atlanta BI Group: Data Warehouse Design Good Practices by Carlos Rodrigues on March 25th
Atlanta BI Group: Tableau BI by Jen Underwood on April 29th

Prologika Newsletter Winter 2012

What’s New in Excel 2013 and SharePoint 2013 BI

s13Microsoft released Office 2013 and SharePoint 2013 in October 2012. The logical question you might have is how the latest versions apply to your business intelligence needs. Here are some of the most important features that I believe might warrant your interest.


Excel 2013

The latest release reinforces the Excel status is the Microsoft premium BI tool on the desktop. The most exciting news is that Microsoft decoupled Power View from SharePoint and made it available in Excel 2013. Consequently, with a few clicks, a business user can create interactive ad-hoc reports in Excel 2013 from PowerPivot models, Tabular models, and soon from Multidimensional cubes.

When connecting to organizational models (Tabular and Multidimensional), users now can create their own calculations and use a new Timeline slicer that is specifically designed to work with dates. And, users can use Quick Explore in pivot reports to drill down a given cell and see its value is contributed by other subject areas.

On the self-service BI area, the most exciting news is that the xVelocity engine and PowerPivot now ships with Excel so users don’t have to download the PowerPivot add-in. Basic self-service BI tasks, such as importing data, joining tables and authoring pivot reports, can now be performed straight in Excel, although the PowerPivot features are still required to unleash the full PowerPivot capabilities, such as implementing calculations, visualizing relationships, and gaining more control over data import. Finally, users will undoubtedly enjoy the new Excel 2013 productivity features, such as Flash Fill to shape the data before analyzing it and Quick Analysis to jumpstart data analsys with recommended visualizations.

SharePoint 2013

On the SharePoint 2013 side of things, Excel web reports are now updatable. As a result, not only users can render pivot reports in HTML, but they can also change the report layout. Quick Explore is available in Excel web reports as well. PerformancePoint Services adds welcome enhancements, including theme support and better filtering.

As you know, the BI landscape is fast-moving and it might be overwhelming. If you have Software Assurance benefits, don’t forget that as a Microsoft Gold Partner and premier BI firm, Prologika can use your SA vouchers and work with you to help you plan and implement your BI initiatives, including:

  • Analyze your current environment and determine a vision for a BI solution
  • Define a plan to launch a BI reporting and analysis solution
  • Upgrading or migrating to SQL Server 2012

Regards,

Teo Lachev

Teo Lachev, MVP (SQL Server), MCSD, MCT, MCITP (BI)
Prologika, LLC | Making Sense of Data
Microsoft Partner | Gold Business Intelligence

News

Prologika obtained a Microsoft Silver Competency in Data Platform.
Prologika consultants have attended the SQL PASS SUMMIT conference in November.

Upcoming Events

Atlanta BI Group: Applied Enterprise Data Mining with Mark Tabladillo on Jan 28th
Atlanta BI Group: MDX vs DAX Showdown by Damu Venkatesan and Neal Waterstreet on Feb 25th
Atlanta BI Group: Data Warehouse Design Good Practices by Carlos Rodrigues on March 25th

Prologika Newsletter Q3 2012

Big Data

newsletter
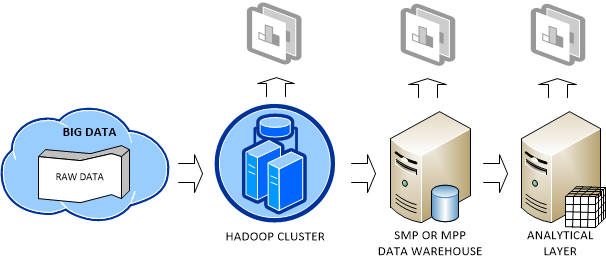
Big Data is getting a lot of attention nowadays. My definition of Big Data is a dataset (or a collection of datasets) that is so large that exceeds the capabilities of a single symmetric multiprocessing (SMP) server and traditional software to capture, manage, and process it within a reasonable timeframe. The boundaries of what defines a “large set” are always shifting upwards, but currently it’s the range of 40-50 terabytes.


Big Data can originate from various sources, including web logs (a popular website might generate huge log files), sensors (a motion sensor or temperature sensor, for example), devices (a mobile phone generates plenty of data as you move), and so on. Since data is the new currency of our times, you might not want to throw your data as someone might be willing to pay for it. However, Big Data means also a big headache. You need to decide how to store, manage, and analyze it. In general, the following deployment scenario emerges as a common pattern:

hadoop

As data accumulates, you might decide to store the raw data in the Hadoop fault-tolerant file system (HDFS). As far as cost, RainStor published an interesting study about the cost of running Hadoop. It estimated that you need an investment of $375 K to store 300 TB which translates to about $1,250 per terabyte before compression. I reached about the same conclusion from the price of single PowerEdge C2100 database server, which Dell recommends for Hadoop deployments.

Note I favor the term “raw data” as opposed to unstructured data. In my opinion, whatever Big Data is accumulated, it has some sort of structure. Otherwise, you won’t be able to make any sense of it. A flat file is no less unstructured than if you use it as a source for ETL processes but we don’t call it unstructured data. Another term that describes the way Hadoop is typically used is “data first” as opposed to “schema first” approach that most database developers are familiar with.

Saving Big Data in a Hadoop cluster not only provides a highly-available storage but it also allows the organization to perform some crude BI on top of the data, such as by analyzing data in Excel by using the Hive ODBC driver, which I discussed in my previous blog. The organization might conclude that the crude BI results are valuable and might decide to add them (more than likely by pre-aggregating them first to reduce size) to its data warehouse running on an SMP server or MPP system, such as Parallel Data Warehouse. This will allow the organization to join these results to conformant dimensions for instantaneous data analysis by other subject areas then the ones included in the raw data.

The important point here is that Hadoop and RDBMS are not competing but completing technologies. Ideally, the organization would add an analytical layer, such as an Analysis Services OLAP cube, on top of the data warehouse. This is the architecture that Yahoo! and Klout followed. See my Why an Analytical Layer? blog about the advantages of having an analytical layer.

The world has spoken and Hadoop will become an increasingly important platform for storing Big Data and distributed processing. And, all the database mega vendors are pledging their support for Hadoop. On the Microsoft side of things, here are the two major deliverables I expect from the forthcoming Microsoft Hadoop-based Services for Windows whose community technology preview (CTP) is expected by the end of the year: A supported way to run Hadoop on Windows. Currently, Windows users have to use Cygwin and Hadoop is not supported for production use on Windows. Yet, most organizations run Windows on their servers. Ability to code MapReduce jobs in .NET programming languages, as opposed to using Java only. This will significantly broaden the Hadoop reach to pretty much all developers.

Regards,

Teo Lachev

Teo Lachev, MVP (SQL Server), MCSD, MCT, MCITP (BI)
Prologika, LLC | Making Sense of Data
Microsoft Partner | Gold Business Intelligence

News

Microsoft awarded Teo Lachev with the Most Valuable Professional (MVP) award for SQL Server for eight years in a row. The Microsoft Most Valuable Professional (MVP) Award is Microsoft way of saying thank you to exceptional, independent community leaders who share their passion, technical expertise, and real-world knowledge of Microsoft products with others. There are less than 200 SQL Server MVPs worldwide.

Upcoming Events

Big Data and Hadoop with Atlanta BI Group on October 29th