Overwriting Power BI Filters
Scenario: You’ve created a dashboard-looking Power BI report that has a filter. Most visuals on a report page need to show only data for the selected filter but some must ignore the filter.
Solution: There are several solutions to achieve this goal depending on requirements. Let’s start with the no-brainer and move down in complexity.
- Move the unfiltered visuals to another report page — Slicers and page-level filters filter visuals on the same page (note that the Power BI Desktop February update allows you to configure a report-level slicer). By moving the visuals that should remain unaffected by the slicer to another page, you’re effectively ignoring the page-level filtering.
- Use a slicer and “Edit Interactions” – If you use a slicer, you can use the Edit Interactions feature (Format ribbon) to specify which visuals ignore the slicer selection. Edit Interactions is described in more detail here.
- Consider using time calculations – For example, if most charts on the report must show data for the last 12 months, but some need to show data for the current month, you can apply the most common filter, which in this case is 12 months. For those charts that shows the last month, create a DAX Month-To-Date (MTD) measure and bind it to those charts.
- Overwrite page-level and report-level filters – Sometimes you can’t use slicers, such as in the case where you need more advanced filtering options or when you need to filter the report by URL (you can pass filters on the report URL only if you have page-level and report-level slicers). This is the most complex case because it requires some changes to the model as I describe below.
Currently, Power BI doesn’t allow you ignore page-level or report-level filters. As you’d quickly find out, Edit Interactions doesn’t work for them. When you apply such a filter, Power BI generates a query with SUMMARIZE that applies the filter as an argument to SUMMARIZE. Think of that filter as a WHERE clause that is applied after all measure-level filters. So, you might have a measure that ignores the filter, but the report would still return the rows matching the filter condition. However, you can use the following workaround to achieve the desired effect. Consider this report.
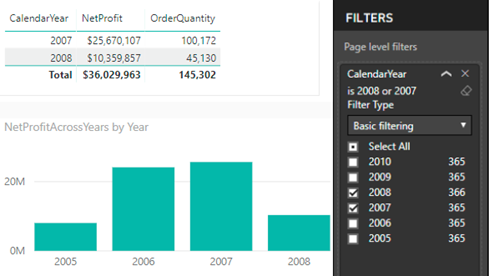
In this case, a page-level filter filters CalendarYear from the Date table to values 2007 and 2008. The first Table visual returns data only for these years (no issues here). But the Chart visual shows data for all years. Follow these steps to get the Chart visual to work as shown:
You need a new measure to ignore the dimension filter. However, the key to get this to work is to use the field form the fact table on the report.
- Add the filter column (CalendarYear in this case) to the fact table. You can do this by different means, such as creating a DAX calculated column, creating a PowerQuery calculated column, or by PowerQuery merged queries (to look up the value from another table). The important thing is that you need to have the filtered field on the fact table.
- Use that field to the chart (not the one from the dimension table that the page-level filter uses).
-
Create a measure that overwrites the filter and use that measure on the chart:
NetProfitAcrossYears = CALCULATE(SUM(ResellerSales[NetProfit]), ALL(‘Date'[CalendarYear]))
The measure ignores the filter on the CalendarYear field. This expands the filter context on the table to all years. Because the Year field used on the report is from the fact table, the net effect is that the data for all years is shown. This approach won’t work if the chart shows measures from two fact tables because you probably won’t have a relationship between them.
In this post, I outlined several options to overwrite Power BI filters. It wouldn’t be nice if Microsoft enhances Edit Interactions to page and report-level filters to avoid changes to the data model.


