Atlanta BI fans, please join us in person for our next meeting on Monday, March 2nd at 18:30 ET. Shabnam Watson will show you how you can apply your SQL skills in Microsoft Fabric. And your humble correspondent will walk you through some of the latest Power BI and Fabric enhancements. I will sponsor the meeting. For more details and sign up, visit our group page.
Delivery: In-person Level: Beginner/Intermediate Food: Pizza and drinks will be provided
Agenda:
18:15-18:30 Registration and networking
18:30-19:00 Organizer and sponsor time (news, Power BI latest, sponsor marketing)
19:00-20:15 Main presentation
20:15-20:30 Q&A
Overview: New to Microsoft Fabric? Don’t worry—you already know more than you think. In this beginner-friendly session, we’ll explore how your existing SQL skills translate directly into Fabric without needing to learn Spark, Python, or unfamiliar engineering tools. You’ll see how SQL can be applied across Fabric items to explore, shape, and analyze data with confidence. If you’re just beginning your Fabric journey, this session offers a simple, approachable path to success using the skills you already have.
Speaker: Shabnam is a business intelligence consultant and owner of ABI Cube, a company that specializes in delivering data solutions using the Microsoft Data Platform. She has over 20 years of experience and is recognized as a Microsoft Data Platform MVP for her technical excellence and community involvement. She is passionate about helping organizations harness the power of data to drive insights and innovation. She has a deep expertise in Microsoft Analysis Services, Power BI, Azure Synapse Analytics, and Microsoft Fabric. She is also a speaker, blogger, and organizer for SQL Saturday Atlanta – BI version, where she shares her knowledge and best practices with the data community.
Sponsor: Prologika (https://prologika.com) helps organizations of all sizes to make sense of data by delivering tailored BI solutions that drive actionable insights and maximize ROI. Your BI project will be your best investment, we guarantee it!
https://prologika.com/wp-content/uploads/2016/01/logo.png00Prologika - Teo Lachevhttps://prologika.com/wp-content/uploads/2016/01/logo.pngPrologika - Teo Lachev2026-02-25 13:29:302026-02-25 13:29:30Atlanta Microsoft BI Group Meeting on March 2nd (Your First Steps in Microsoft Fabric Using Just SQL)
I like SQL Server temporal tables for implementing ODS-style tables and change data tracking (CDS) for three main reasons:
SQL Server maintains the system versioning. By contrast, I have witnessed erroneous Start/End dates for pretty much all home grown implementation. Further, SQL Server grains the changes at millisecond level.
There is a clean separation between the current state of data and historical data. SQL Server separates the historical changes to a history table.
You can establish a flexible data retention policy. A retention policy can be established at database or table level. SQL Server take care of purging the expired data.
At the same time, temporal tables are somewhat more difficult to work with. For example, you must disable system versioning before you alter the table. Here is the recommended approach for altering the schema by the documentation:
BEGIN TRANSACTION
ALTER TABLE [dbo].[CompanyLocation] SET (SYSTEM_VERSIONING = OFF);
ALTER TABLE [CompanyLocation] ADD Cntr INT IDENTITY (1, 1);
ALTER TABLE [dbo].[CompanyLocation] SET
(
SYSTEM_VERSIONING = ON
(HISTORY_TABLE = [dbo].[CompanyLocationHistory])
);
COMMIT;
However, if you follow these steps, you will be greeted with the following error when you attempt to restore the system versioning in the third step:
Cannot set SYSTEM_VERSIONING to ON when SYSTEM_TIME period is not defined and the LEDGER=ON option is not specified.
Instead, the following works:
ALTER TABLE <system versioned table>  SET (SYSTEM_VERSIONING = OFF) -- disable system versioning temporarily
-- make schema changes, such as adding new columns
ALTER TABLE <system versioned table>  ADD PERIOD FOR SYSTEM_TIME (StartDate, EndDate); -- restore time period
ALTER TABLE [mulesoft].[Employee] SET (SYSTEM_VERSIONING = ON (HISTORY_TABLE = [mulesoft].[EmployeeHistory])) -- restore system versioning
When it comes to Generative AI and Large Language Models (LLMs), most people fall into two categories. The first is alarmists. These people are concerned about the negative connotations of indiscriminate usage of AI, such as losing their jobs or military weapons for mass annihilation. The second category are deniers, and I must admit I was one of them. When Generative AI came out, I dismissed it as vendor propaganda, like Big Data, auto-generative BI tools, lakehouses, ML, and the like. But the more I learn and use Generative AI, the more credit I believe it deserves. Because LLMs are trained with human and programming languages, one natural case where they could be helpful are code copilots, which is the focus of this newsletter. Let’s give Generative AI some credit!
Text2SQL
I have to say that I was impressed with LLM. I used the excellent Ric Zhou’s Text2SQL sample as a starting point inside Visual Studio Code.
The sample uses the Python streamlit framework to create a web app that submits natural questions to Azure OpenAI. I was amazed how simple the LLM input was. Given that it’s trained with many popular languages, including SQL, all you have to do is provide some context, database schema (generated in a simple format by a provided tool), and a few prompts:
[{'role': 'system', 'content': 'You are smart SQL expert who can do text to SQL, following is the Azure SQL database data model <database schema>},
{'role': 'user', 'content': 'What are the three best selling cities for the "AWC Logo Cap" product?'},
{'role': 'assistant', 'content': 'SELECT TOP 3 A.City, sum(SOD.LineTotal) AS TotalSales \\nFROM [SalesLT].[SalesOrderDe...BY A.City \\nORDER BY TotalSales DESC; \\n'},
{'role': 'user', 'content': natural question here'}]
Let’s drill into these prompts.
The first prompt is an example of role prompting which provides context to the model for our intention to act as a SQL expert.
The sample includes a tool that generates the database schema consisting of table and columns in the following format below. Notice that referential integrity constraints are not included (the model doesn’t need to know how the tables are related!)
The next “few shot” prompt assumes the role of an end user who will ask a natural question, such as ‘What are the three best selling cities for the “AWC Logo Cap” product? This is followed by the assistant’s response who hints the model what the correct query should be.
As a Microsoft BI practitioner, the next natural stop was Text2DAX. But wait, we have a Microsoft Fabric Copilot already for this, right? Yes, but what happens when you click the magic button in PBI Desktop? You are greeted that you need to purchase F64 or larger capacity. It’s a shame that Microsoft has decided that AI should be a super-premium feature. Given this horrible predicament, what would an innovative developer strapped for cash do? Create their own copilot of course!
Building upon the previous sample, this is remarkably simple. First, I obtained the model schema using Analysis Services Data Management Views (DMVs). Second, I changed slightly the prompt, along these lines:
“As a DAX expert, examine a Power BI data model with the following table definitions where TableName lists the tables and ColumnName lists the columns, and provide DAX query that can answer user questions based on the data model, you will think step by step throughout and return DAX statement directly without any additional explanation.”
In summary, it appears that LLM can effectively assist us in writing code. The emphasis is on assist because I view the LLM role as a second set of eyes. Hey, what do you think about this problem I’m trying to solve here? LLM doesn’t absolve us from doing our homework and learning the fundamentals, nor it can compensate for improper design. While LLM might not always generate the optimum code and might sometimes fabricate, it can definitely assist you in creating business calculations, generating test queries, and learning along the way.
BTW, you can use any of the publicly available LLM apps, such as Copilot, ChatGPT, Google Gemini or Perplexity (you don’t need the sample app I’ve demonstrated) for Text2SQL and Text2DAX and probably you will obtain similar results if you give it the right prompts. I took this approach because I was interested in automating the process for business users.
As inspired by Kevin Jordain, who clued me about the increased demand for using natural questions to analyze client’s data, John Kerski, who did a great presentation to our Atlanta BI Group on integrating Power Query with Azure OpenID, and Kyle Hale, who believes (wrongly 😊) that the Databricks Genie will make Power BI and semantic modeling obsolete, I set on a quest to find how effective Large Language Models (LLM) are in generating SQL from natural questions, also known as Text2SQL. What a better way to spend some free time around the 4th of July holiday, right?
I have to say that I was impressed with LLM. I used the excellent Ric Zhou’s Text2SQL sample as a starting point inside Visual Studio Code. The sample uses the Python streamlit framework to create a web app that submits natural questions to Azure OpenAI.
My humble contributions were:
I switched to the Azure OpenAI chatgpt-4o model.
Because the Python openai module has deprecated ChatCompletion, I transitioned the code to use the new way of interacting, as I explained in the related GitHub issue.
I used the AdventureWorksDW2019 database which I deployed to Azure SQL Database.
I was amazed how simple the LLM input was. Given that it’s trained with many popular languages, including SQL, all you have to do is provide some context, database schema (generated in a simple format by a provided tool), and a few prompts:
[{'role': 'system', 'content': 'You are smart SQL expert who can do text to SQL, following is the Azure SQL database data model <database schema>},
{'role': 'user', 'content': 'What are the three best selling cities for the "AWC Logo Cap" product?'},
{'role': 'assistant', 'content': 'SELECT TOP 3 A.City, sum(SOD.LineTotal) AS TotalSales \\nFROM [SalesLT].[SalesOrderDe...BY A.City \\nORDER BY TotalSales DESC; \\n'},
{'role': 'user', 'content': natural question here'}]
Let’s decipher this:
The first prompt provides context to the model for our intention to act as a SQL expert.
The sample includes a tool that generates the database schema consisting of table and columns in the following format below. Noticed that referential integrity constraints are not included (the model doesn’t need to know how the tables are related!) There is nothing special in the syntax. It is fluid (impressive!), which is a paradigm shift from structured XML or JSON where missing a bracket crashes the system. So, I could have expressed the schema using the following notation and it would still work (ideally, we should also provide the column data types):
Table: FactSalesQuota
– SalesQuotaKey
– other columns
or
Table: FactSalesQuota
Columns: column1, column2
The next prompt assumes the role of an end user who will ask a natural question, such as ‘What are the three best selling cities for the “AWC Logo Cap” product?’
The next prompt assumes the role of an assistant who hints the model what the correct query should be.
The final prompt acts as a user who now provides what natural question you enter.
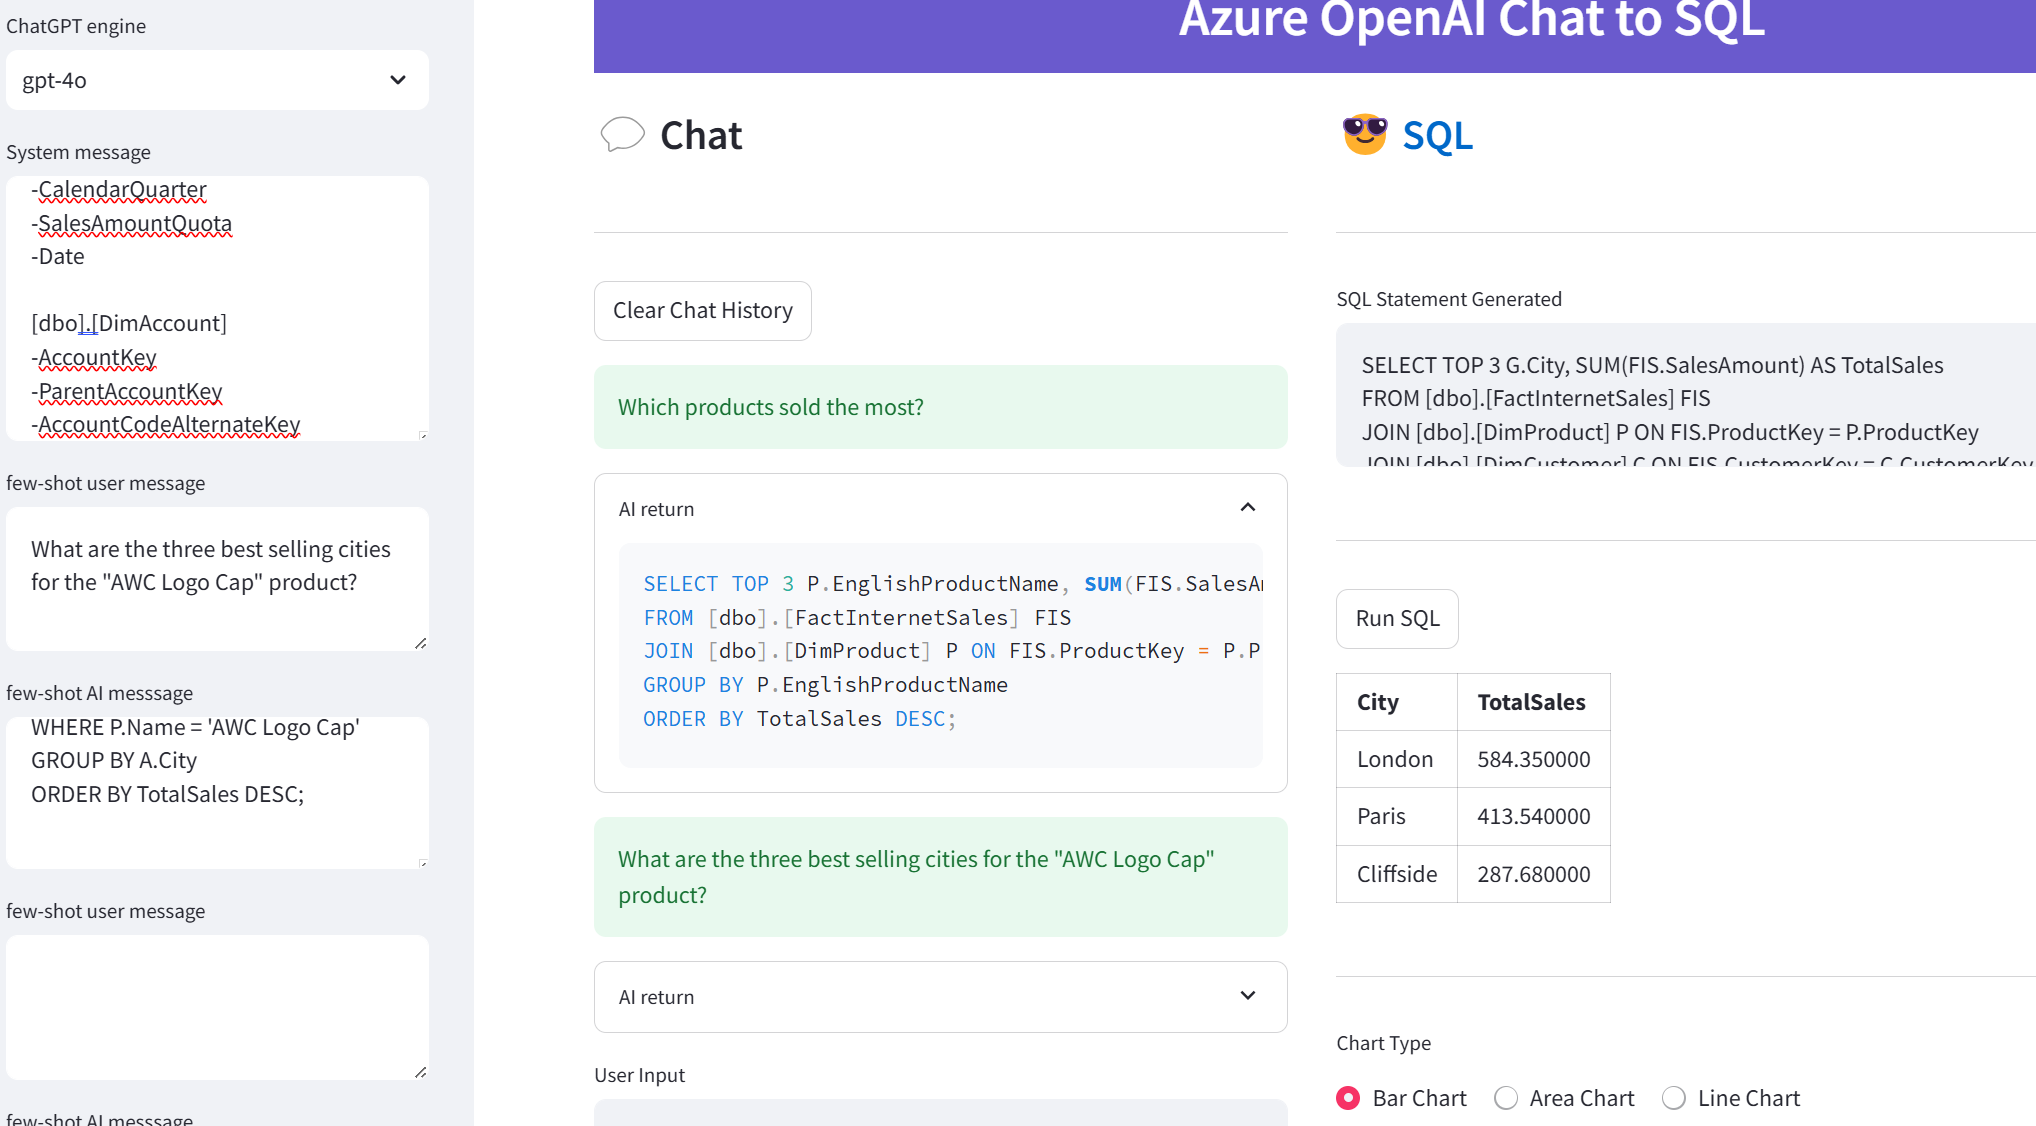
The sample also supports running the query against the database and visualizing the results as a table, bar chart, area chart, or line chart. Here are some results
What are the three best selling cities for the “AWC Logo Cap” product?
SELECT TOP 3 G.City, SUM(FIS.SalesAmount) AS TotalSales
FROM [dbo].[FactInternetSales] FIS
JOIN [dbo].[DimProduct] P ON FIS.ProductKey = P.ProductKey
JOIN [dbo].[DimCustomer] C ON FIS.CustomerKey = C.CustomerKey
JOIN [dbo].[DimGeography] G ON C.GeographyKey = G.GeographyKey
WHERE P.EnglishProductName = 'AWC Logo Cap'
GROUP BY G.City
ORDER BY TotalSales DESC;
Which products sold the most?
SELECT P.EnglishProductName, SUM(FIS.SalesAmount) AS TotalSales
FROM [dbo].[FactInternetSales] FIS
JOIN [dbo].[DimProduct] P ON FIS.ProductKey = P.ProductKey
GROUP BY P.EnglishProductName
ORDER BY TotalSales DESC;
Which customers bought something in 2012 but didn’t buy anything in 2011?
SELECT DISTINCT C.CustomerKey, C.FirstName, C.LastName
FROM [dbo].[FactInternetSales] FIS2012
JOIN [dbo].[DimCustomer] C ON FIS2012.CustomerKey = C.CustomerKey
WHERE FIS2012.OrderDateKey BETWEEN 20120101 AND 20121231
AND C.CustomerKey NOT IN (
SELECT DISTINCT FIS2011.CustomerKey
FROM [dbo].[FactInternetSales] FIS2011
WHERE FIS2011.OrderDateKey BETWEEN 20110101 AND 20111231);
All SQL statements were syntactically and logically correct. Pretty amazing, right? Especially considering that the model had to figure out how the tables related, such as that DimCustomer is related to FactInternetSales but not to FactResellerSales.
In summary, it appears that LLM can be used effectively for generating SQL from natural text. This is opening new possibilities for ad hoc data analytics and for assisting users with learning or generating code. I believe that simplified schema is very important, such as star schema. This underscores the importance of schema design for data analytics, something that AI can’t do (yet).
What about Text2DAX? Can LLM do it? You bet! DAX happens to be one of the programming languages used for training, so stay tuned for the next blog post where I’ll present you with a poor man’s DAX copilot.
Warning: This blog contains old tricks of an old dog.
Scenario: Suppose you have a large table in SQL Server, e.g. hundreds of millions or even a billion rows. DML operations (SELECT, INSERT, UPDATE, DELETE) take long time. How do you speed them up? Do you split the large table into multiple tables? Or, do you ask for better hardware? Or, do you start looking for a new job with less data?
Solution: It’s nothing new but I see clients struggle with this all the time because they don’t know any better.
The solution is to partition the table and use partition switching that SQL Server has supported since time immemorial.
Cathrine Wilhelmsen has a great step-by-step blog covering different scenarios, but the process goes like this:
Configure page compression for the large table (see benefits here).
Partition the large table, such as by month.
Create a not-partitioned staging table that has the same indexes and compression as the large table.
Find the corresponding partition in the large table that will require DML, such as by using this script.
If the data requires updates, switch out the affected partition to the staging table. Perform updates. For full loads where rows will be only inserted, you don’t have to switch out the partition (see the second scenario in Cathrine’s blog).
Switch in the staging table into the corresponding partition of the large table. This should take a few seconds.
As a bonus, the SQL Server query processor could eliminate partitions for SELECTs, thus improving the query performance.
https://prologika.com/wp-content/uploads/2016/01/logo.png00Prologika - Teo Lachevhttps://prologika.com/wp-content/uploads/2016/01/logo.pngPrologika - Teo Lachev2023-03-24 12:23:162023-03-24 12:23:16Working with Large Tables in SQL Server
Happy Holidays! More and more organizations consider data virtualization to abstract the underlying storage and integrate siloed sources. In this letter, I’ll discuss a real-life project that used PolyBase to expose third-party ERP data as SQL tables. Before I get to the subject of this newsletter, I’m excited to announce the seventh edition of my “Applied Microsoft Power BI” book. It should be available on Amazon in the first days of 2022. As far as I know, it’s the only book that is updated annually to keep it up to the date with the fast-changing Power BI. Stay tuned for a future blog with more details about the book.
Business Case
Think of data virtualization is a logical data layer that integrates enterprise data across various on-premises and cloud sources. A large, multinational chemical manufacturer decided to migrate their on-premises ERP system to the cloud. As usually happens, the tradeoff for embracing the cloud is losing access to your data in its native storage. Previously, the client could readily integrate the ERP data stored in a SQL Server database. But the ERP vendor didn’t support this option in their cloud offering. The usual explanation cites security and performance issues, although none of them really hold water. The ERP vendor could have supported a premium tier where data is exposed privately without affecting other customers, and report queries could have been redirected to a secondary replica. This is no different that securing and scaling an Azure SQL Database. Alas, as more and more companies find when embracing the cloud, the integration burden gets heavier and is on them and not on the vendor.
To make things even more difficult, the vendor had a replication mechanism to export the data to AWS S3 data lake. Realizing that most clients would struggle calling their REST APIs, the vendor provided an JDBC driver that abstracted the APIs. Great, except that the client wanted to access the data on Microsoft Azure, but no Microsoft tool supports JDBC drivers because no Microsoft BI tool is written in Java.
Integration Options
One integration option could have been to use a JDBC-capable ETL tool, such as Pentaho. But that would have required implementing integration pipelines to pull the data periodically and stage it on Azure. This presented two issues. First, the data integration effort became more difficult as someone had to own and troubleshoot ETL failures. Second, Business wanted as much real-time access to data as possible. In the past, the business users had implemented self-service Power BI models that they would refresh as needed to cache the data from the on-premises database. However, since the ERP vendor required at least 20 minutes for data changes to be applied to the S3 data lake and ETL needed additional time (even with incremental extraction), the data latency became an issue.
The second option was to somehow virtualize the data. Had the vendor supported exporting the data as files on Azure, Synapse Serverless could have been used to expose the data as virtual tables that can be queried with SQL and loaded in Power BI Desktop. But Serverless doesn’t support AWS S3 and even if it did, the vendor didn’t allow direct access to the staged data (REST APIs and JDBC driver were the only supported options).
PolyBase to the Rescue
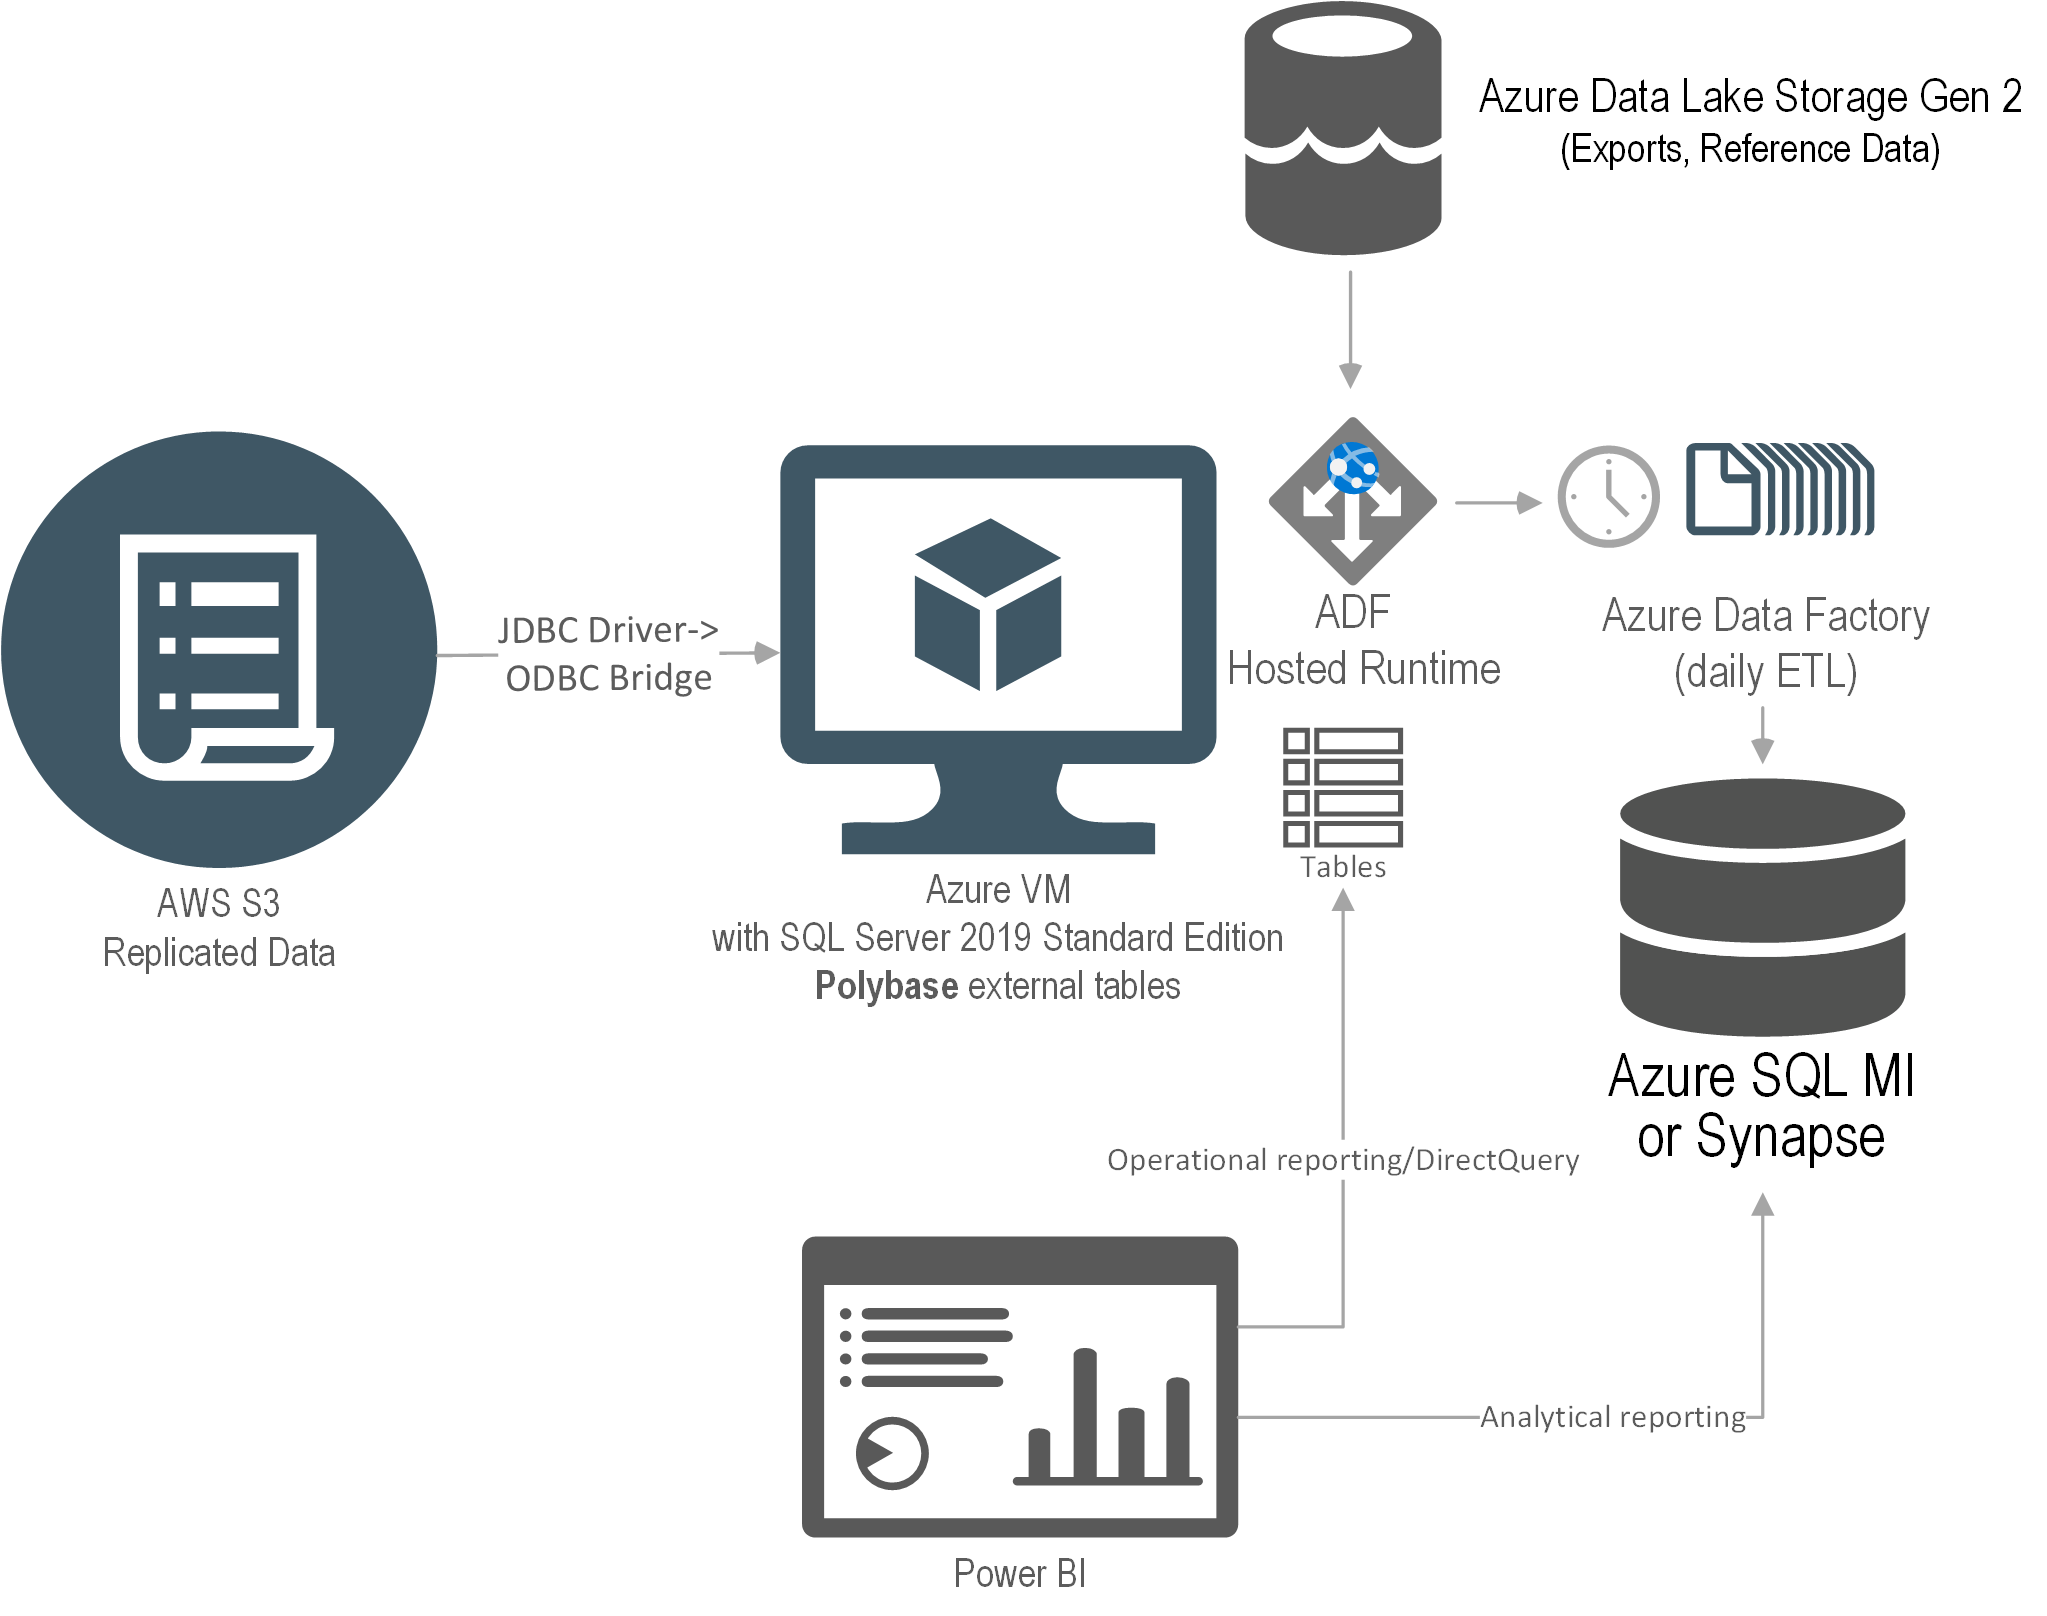
The solution I proposed was to use PolyBase which is included in SQL Server and Azure SQL Managed Instance. Ideally, the client wanted a full PaaS solution but only PolyBase in SQL Server supports ODBC. So, we had to use an IaaS VM just to virtualize the data. This diagram shows the solution architecture.
An Azure VM was provisioned with SQL Server 2019 Standard Edition. The JDBC driver was installed on the VM and configured to access the ERP data. We used a third-party JDBC-to-ODBC bridge driver to map the JDBC data source as an ODBC data source. Then, PolyBase external tables were set up to virtualize the ERP data as SQL Server tables.
The main drawback of this solution was that no matter how small the source table was, PolyBase would add about 30 seconds in internal processing. Specifically, the PolyBase runtime log has a detailed trail that shows that it takes some time for PolyBase to “warm up” before it gets to the query, and then it needs even more time to process the results. That’s because, as a distributed system (like Synapse), a head node coordinates the query execution with data nodes even if everything is installed on a single VM. More gotchas specific to the fact that the vendor has decided to use Oracle as their relational database can be found at https://prologika.com/polybase-adventures/.
Conclusion
Microsoft has made bold strides in data virtualization. I’m really impressed by Synapse Serverless, which I used for other projects, such as for the project described in this case study. I wish Microsoft extends Serverless to support more storage options. If Synapse Serverless is not an option, your next best bet would be PolyBase. Although PolyBase is supported in SQL MI and Synapse, only the SQL Server box SKU supports ODBC data sources, requiring an IaaS layer to virtualize the data.
Benefits
The solution delivered the following benefits to the client:
No ETL effort – Data was left at the original source.
Data virtualization – Polybase was used to create external tables that can be queried just like SQL Server regular tables.
Reduced data latency – Data changes were available as soon as they are replicated to the data lake.
Scalability – PolyBase can be scaled out to other servers if needed.
Teo Lachev
Prologika, LLC | Making Sense of Data
Microsoft Partner | Gold Data Analytics
I’m setting SQL Server 2019 PolyBase for ODBC to JDBC access to a vendor data lake to virtualize entities as SQL tables. Overall, a smooth experience with a few gotchas:
Data type mappings
The vendor lake uses Oracle data types TIMESTAMP AT TIME ZONE and BOOLEAN that Java doesn’t know how to map. The solution was to set up a view in the data lake (luckily the vendor supports that) to cast these data types to NVARCHAR and INTEGER.
NullPointerException
Once the table is finally set up what do we get when querying it?
How do we fix this horrible issue? Upgrade SQL Server and PolyBase to the latest cummulative update (CU).
The final mystery that I haven’t been able to crack yet is that for some obscure reason, PolyBase adds quite a bit of performance overhead to the query execution. So, if a query in DBeaver directly connected to the lake (or Power BI Desktop directly corrected to the ODBC driver) takes eight seconds, PolyBase expands it to a minute. Examining the DMVs shows that the actual query does execute in line with DBeaver, but there is some additional overhead from PolyBase that would require a support case with Microsoft.
LabCorp operates one of the largest clinical laboratory networks in the world. It also has an Interactive Response Technology system that healthcare vendors can use to conduct case studies. Thanks to the cloud data analytics solution implemented by Prologika, LabCorp and its vendors can now analyze data across case studies. Read this newsletter to learn more about the solution architecture and business value.
Business Needs
The data for each study was saved into a separate on-prem SQL database. The total number of databases was more than 1,000. After the initial assessment, Prologika realized that one of the main gaps was that vendors couldn’t report across their studies or gain performance insights from studies conducted by other vendors. Further, as the IRT system evolves over time and to accommodate special requests, there were scheme differences between different versions.
LabCorp underscored the importance of consolidating the data from multiple studies into a single repository. They envisioned a cloud-based PaaS BI solution that would extract data from all the on-prem databases without impacting the system performance and centralize it into an enterprise data warehouse. Vendors would log an external portal that will deliver embedded reports. The first iteration was focused on analyzing audit and log data to gain strategic insights, such as how many users are using the system.
Solution
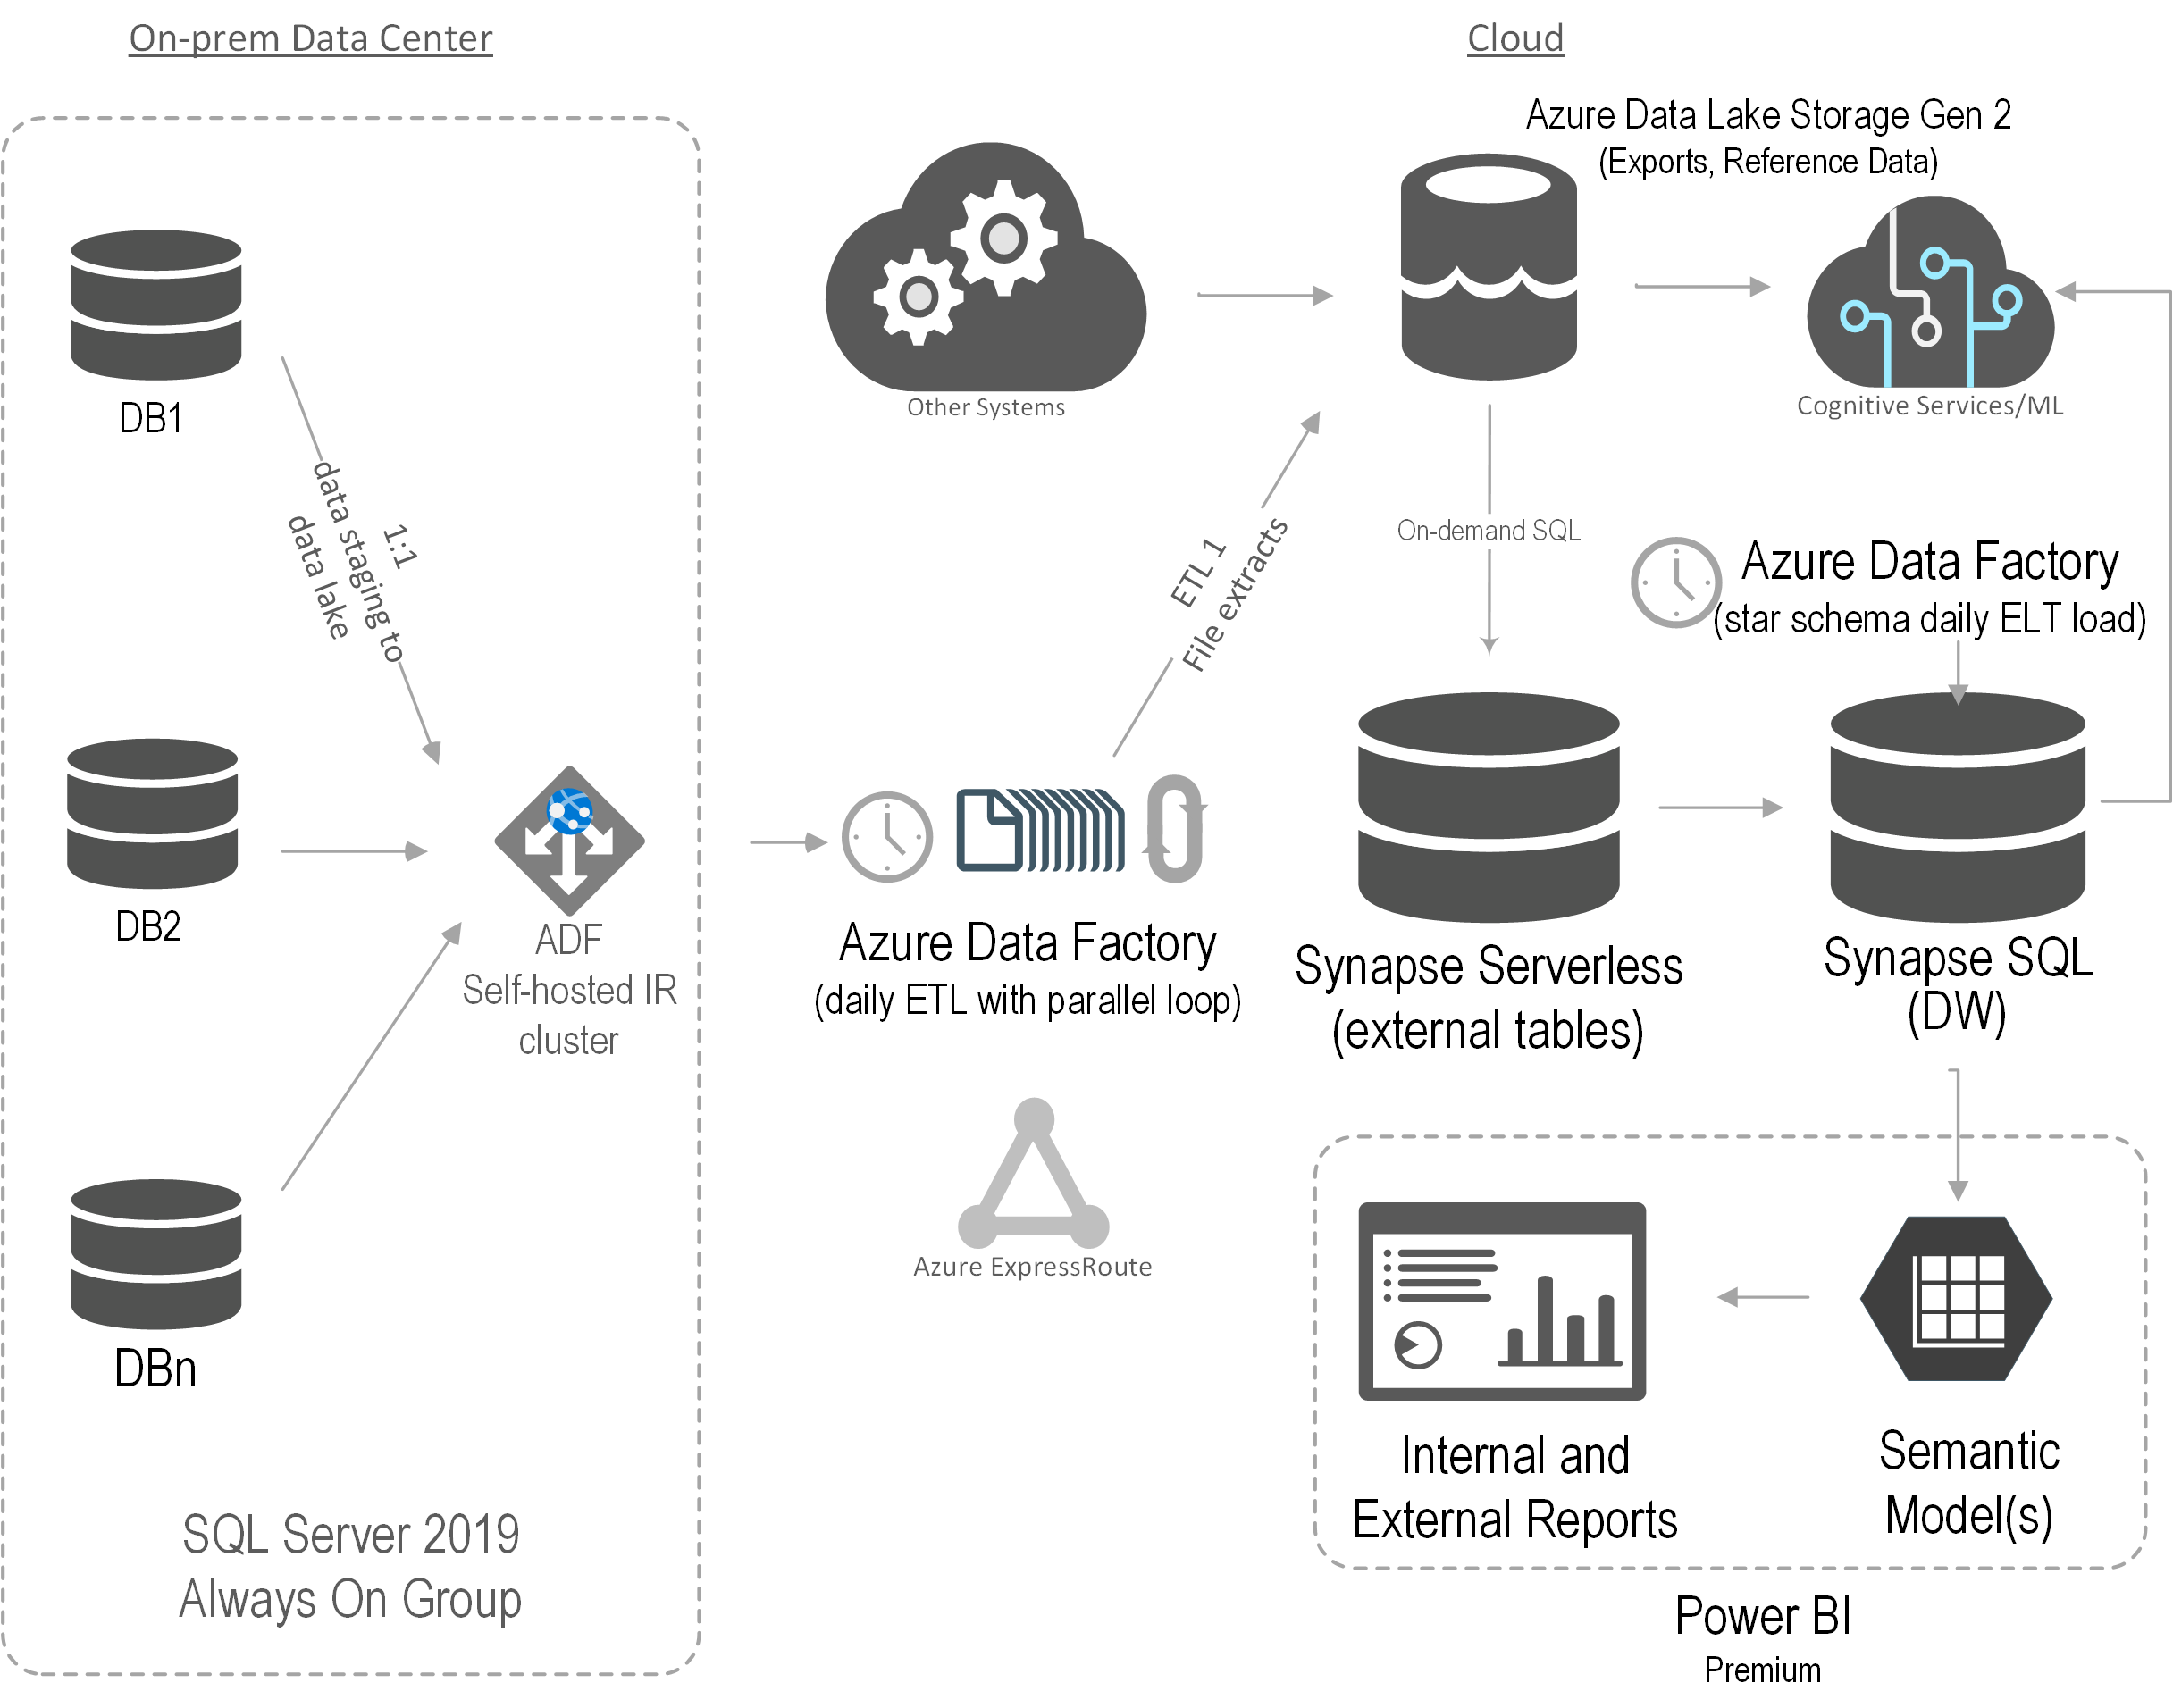
After assessing the current state and objectives, Prologika recommended and implemented the following architecture:
Prologika implemented an Azure Data Factory (ADF) configurable framework to extract data from the on-prem databases hosted on two production SQL Servers in parallel. The framework would stage the data into partitioned parquet files in Azure Data Lake Storage (ADLS).
Then Prologika created views in Synapse Serverless to consolidate the file extracts. For example, an Audit table could exist in several on-prem databases on both production servers. While each table would be staged in a separate file (or multiple files if the table supports incremental extraction), a Synapse Serverless would present a consolidated view across all files. We were impressed by the capabilities and performance of Synapse Serverless.
Another ADF process would extract the data from the Synapse Serverless views and load the data into a data warehouse hosted in a Synapse SQL pool. Although we considered other methods, such as using a linked server in a Azure SQL Managed Instance to Synapse Serverless to avoid data staging, we settled on Synapse SQL mainly for its scalability. Finally, a Power BI semantic model was created and Power BI Embedded used to deliver reports.
Benefits
The solution delivered the following benefits to LabCorp:
Data consolidation – Data was extracted with minimum impact to the operational systems and consolidated in ADLS.
Data virtualization – Thanks to the Synapse Serverless flexible support of schema differences, virtual views were created.
Scalability – Synapse SQL pool can scale almost indefinitely.
Secure and fast insights – Each vendor can access only their data.
Teo Lachev
Prologika, LLC | Making Sense of Data
Microsoft Partner | Gold Data Analytics
Business Performance Management (BPM) is a methodology to help the company predict its performance. An integral part of a BPM strategy is creating and monitoring a scorecard with Key Performance Indicators (KPIs). In this newsletter, I’ll discuss how the newly released Power BI Goals can help you augmenet your BPM strategy. But before that, I’d like to share my excitement that Microsoft have recently awarded me FastTrack Recognized Solution Architect – Power BI! I’m one of the 33 individuals worldwide who got nominated by the Power Platform product engineering team for consistently exhibiting deep architecture expertise and creating high quality solutions for customers during project engagements.
Introducing Power BI Goals
A vital BI practice for every organization, performance management ensures that important metrics, such as Key Performance Indicators (KPIs), meet established goals. The typical artifact to do so is implementing a scorecard: a report that compares the current state with the desired state of these metrics. You might have also heard the term “balanced scorecard” which is an organization-wide scorecard that tracks several subject areas, such as Finance, Customer, and Operations. In the past, organizations would use different tools, such as the now deprecated PerformancePoint (included in SharePoint Server) to implement balanced scorecards. Realizing the importance of scorecards, Power BI introduced Goals that aim to simplify the process of implementing departmental and organizational scorecards. For more information on how Goals works, watch the “Goals in Power BI” presentation from the Microsoft Business Application Summit
What’s to like
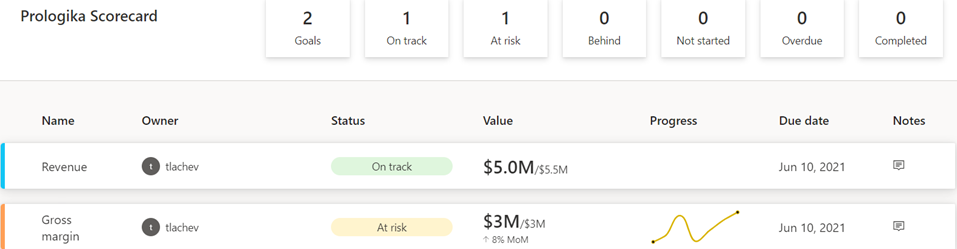
As with anything Power BI, Microsoft has democratized scorecards so business users with no reporting experience can quickly assemble them from existing reports. Think of a goal as a line (or KPIs) in the scorecard. Here is scorecard with two goals:
Currently, Power BI supports two goal types:
Static – The goal creator manually enters and track the goal properties, such as current value, target value, and status. This could be useful for quick and dirty KPIs that are not backed by a data source, such as launching a new promotion campaign. In the scorecard above, I created the Revenue goal by entering 5M as the current value and 5.5M as the goal.
Data-driven – The goal current value and/or target value can be data-driven and bound to metrics from existing report(s). Coming from Analysis Services, I was initially surprised that Power BI doesn’t require implementing KPI measures, but I get it: Microsoft decided to source the metrics from reports so business users can easily apply filters. If the goal owner chooses a metric from a visual that has a Date field, such as a time series chart, Power BI automatically shows a sparkline for the goal progress over time. And, of course, when the report dataset is refreshed, the goal values are updated.
So, no modeling or Power BI Desktop required assuming that someone else, such as a data analyst, has delivered functional reports with the metrics. Even better, the goal current and target values can come from different reports (even a report in a different workspace if you have permissions), e.g. a report with actuals and another report with targets. So, there is plenty of flexibility here. To mimic a balanced scorecard that spans multiple subject areas, the owner can create subgoals. For example, the main goal could be Finance with subgoals Revenue, Margin, etc. Because like dashboards, goals are “pinned” from reports, the end user can navigate to the underlying report to examine the data in more detail. Users can also add notes to explain the goal behavior to the teammates.
A scorecard is a first-class Power BI citizen, and as such, it can be secured, endorsed, secured with sensitivity labels, annotated, and shared, such as sharing the scorecard to a Microsoft Teams channel. The scorecard data is saved in a Power BI dataset that users can connect to build custom reports. Moreover, Power BI automatically adds daily snapshots to the dataset allowing users to build up a history of the goals. For example, if the underlying report is refreshed daily, the updated goal values will be appended to the dataset. Developers can use the Power BI REST APIs to implement programmatic scorecard management solutions.
What’s not to like
Besides navigating to the underlying report, a goal is a one-liner in the scorecard. I can’t define a goal that shows me a metric sliced by dimension members, such as business unit. Further, subgoals are not currently aggregable, such as to sum or average values when rolling up to the main goal. Like limitations with dashboards, there is no way to apply a global filter to the scorecard, e.g. to filter all goals for the prior month.
Besides current and target values, no other goal properties can be data driven. For example, unlike Analysis Services KPIs, the goal status can’t be currently bound to a DAX measure. Changing the status requires proactive manual “check ins” although Microsoft mentions a forthcoming feature that will let users define rules to change the status, like how you can define rules for dashboard tile alerts. Speaking of data-driven properties, I don’t understand why you must use a date field to get the progress as opposed to any other field, such as Month, in your Date table.
Finally and unfortunately, Goals require Power BI Premium. If we really want to democratize features, shouldn’t we make them available in Pro?
Conclusion
Goals are a Power BI Premium feature aimed at making it easier to create scorecards and monitoring metrics from existing reports. They promote a “bottom-up” culture, where business users can create departmental scorecards without reliance on IT. Microsoft plans more features by the end of the year to make Goals more appealing, such as integration with Power Automate to trigger actions, rolling up subgoals, changing the goal tracking cycle (DoD, MoM, YoY), custom goal formatting, Power BI Mobile experience optimized for phones, providing a scorecard visual, and cascaded goals (hierarchy of goals).
If you find Power BI Goals somewhat inflexible or you don’t have budget to upgrade to Premium, you don’t have to use the Goals feature to implement scorecards. You can define KPIs and create dashboard-looking reports where you have complete control over the scorecard presentation.
Teo Lachev
Prologika, LLC | Making Sense of Data
Microsoft Partner | Gold Data Analytics
Amidst the COVID pandemic, the Houston Health Department (HHD) had another predicament to tackle. With lab results accumulating rapidly at one million cases per month, the vendor system they used for capturing and analyzing COVID data couldn’t keep up. In this newsletter, you’ll learn how Prologika implemented a BI solution powered by SQL Server and Power BI to solve technology challenges, and deliver fast and reliable insights.
Business Challenges
The vendor SQL Server database had large tables with normalized name-value pairs for each question and answer received from the patient, and for each investigation result. To facilitate reporting, the vendor system had scheduled ETL processes to extract data from the OLTP tables into denormalized tables. However, locking conflicts and large data volumes would crash the system and fail the ETL processes.
As a result, business analysts were not able to get timely data for reporting. HHD and the vendor tried to isolate the reporting loads by replicating the data to a reporting database but the issue with populating the denormalized tables remained
Solution
A good solution starts with a solid foundation. After assessing the current state and objectives, Prologika recommended and implemented the following architecture:
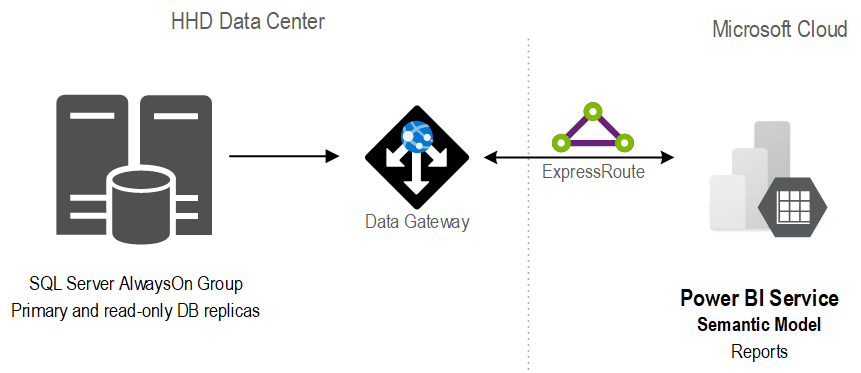
The stand-alone SQL database was replaced with an AlwaysOn availability group. Not only did this provide high availability, but it also isolated operational from reporting workloads.
In the client’s own words “we have compared the cluster server to the report server and cluster is vastly superior with regard to performance for regular queries. One simple run was 4x faster on cluster than the current report server. A much more complex run took four minutes on cluster and I stopped the same run on the report server after 87 minutes.”
Previously, data analysts would produce reports using different tools, ranging from SQL, Python, to Power BI reports. With scarce resources, HHD found it difficult to continue that path. Instead, Prologika implemented a semantic model that was hosted in Power BI.
Benefits
The new architecture and semantic model delivered the following benefits to HHD:
A single version of truth – Strategic data and business calculations were centralized on one place.
Fast insights – The Power BI reports crunching millions of rows were instantaneous.
Isolation – Report loads were isolated from the operational loads because the data was cached in the semantic model.
Standardization and centralization – Power BI became the reporting platform for delivering insights across the organization.
Teo Lachev
Prologika, LLC | Making Sense of Data
Microsoft Partner | Gold Data Analytics


 When it comes to Generative AI and Large Language Models (LLMs), most people fall into two categories. The first is alarmists. These people are concerned about the negative connotations of indiscriminate usage of AI, such as losing their jobs or military weapons for mass annihilation. The second category are deniers, and I must admit I was one of them. When Generative AI came out, I dismissed it as vendor propaganda, like Big Data, auto-generative BI tools, lakehouses, ML, and the like. But the more I learn and use Generative AI, the more credit I believe it deserves. Because LLMs are trained with human and programming languages, one natural case where they could be helpful are code copilots, which is the focus of this newsletter. Let’s give Generative AI some credit!
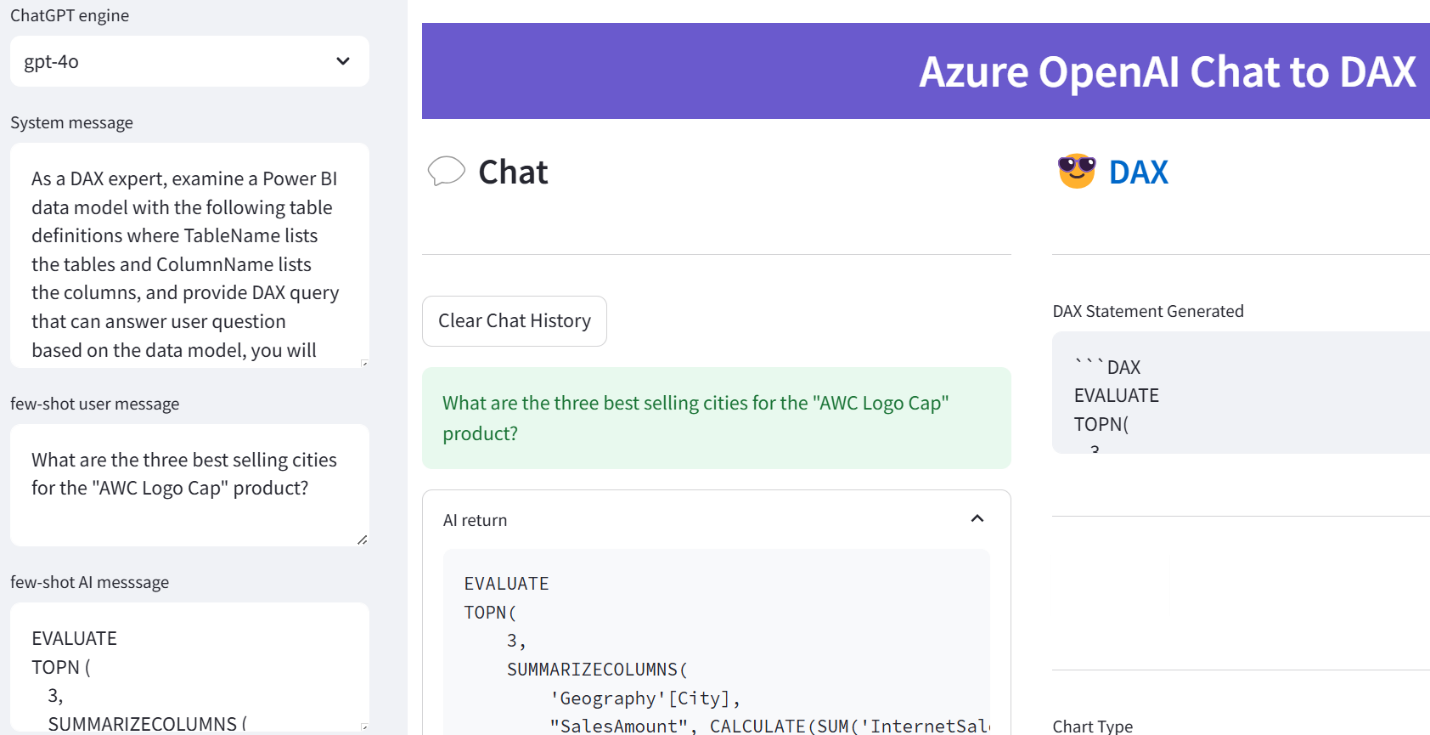


 Business Performance Management (BPM) is a methodology to help the company predict its performance. An integral part of a BPM strategy is creating and monitoring a scorecard with Key Performance Indicators (KPIs). In this newsletter, I’ll discuss how the newly released Power BI Goals can help you augmenet your BPM strategy. But before that, I’d like to share my excitement that Microsoft have recently awarded me