Posts

Tips for Configuring Azure Data Factory Alerts

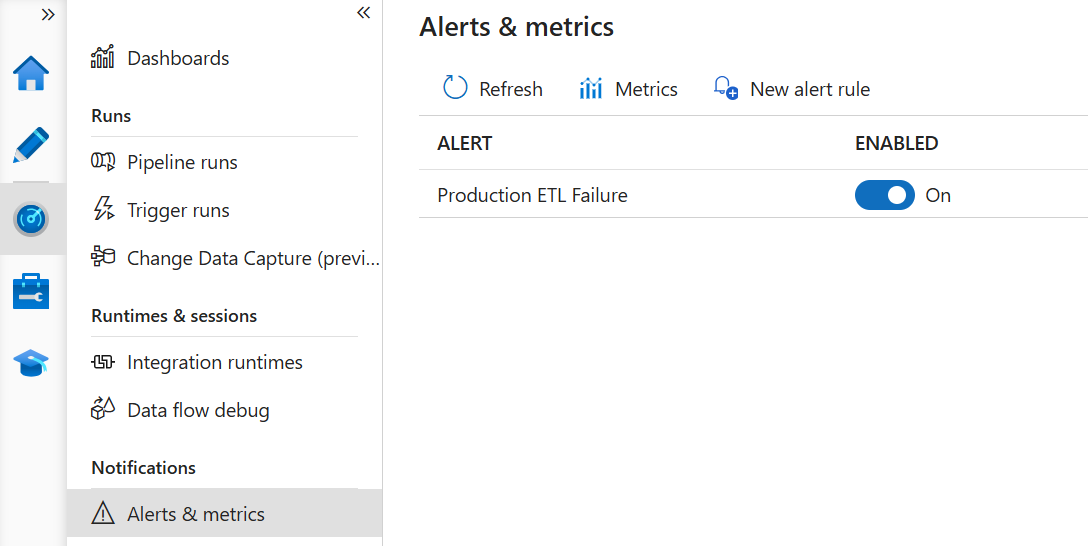
Alerting is an important monitoring task for any ETL process. Azure Data Factory can integrate with a generic Azure event framework (Azure Monitor) which makes it somewhat unintuitive for ETL monitoring. You can set up and change the alerts using the ADF Monitoring hub.

A screenshot of a computer Description automatically generated

You might find the following tips useful for setting up an ADF alert:

A screenshot of a computer Description automatically generated

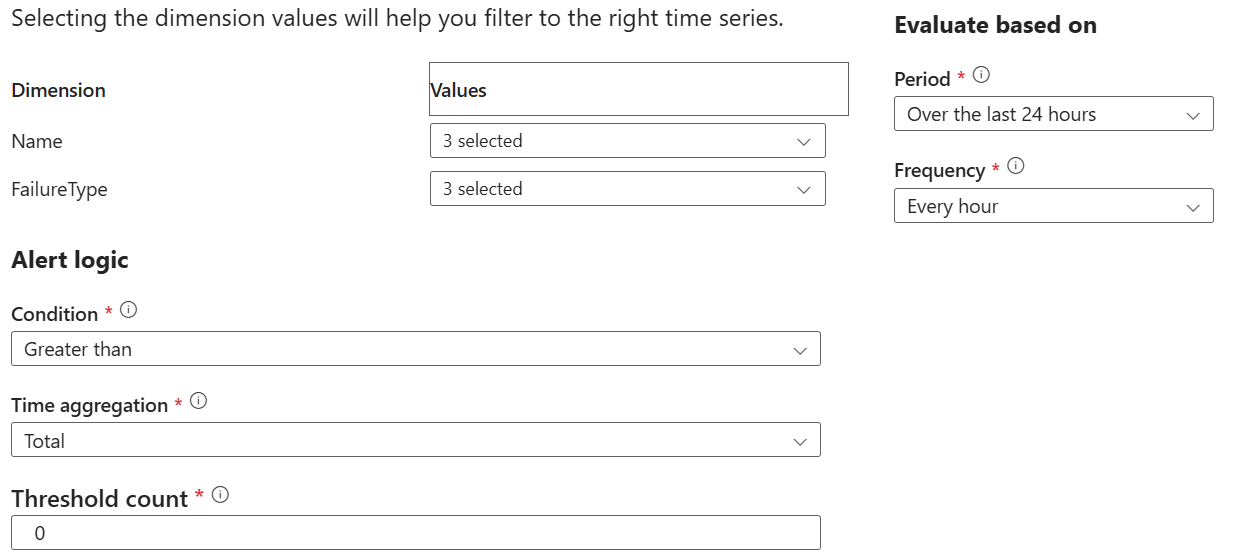
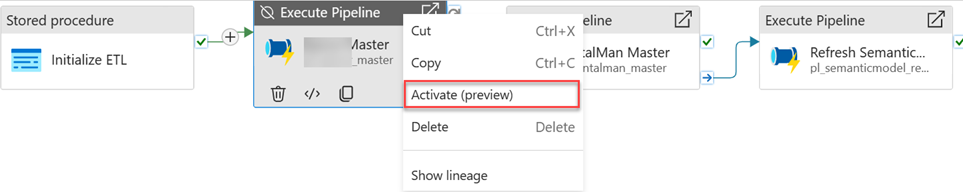
  1. Dimension – I like to nest pipelines where a master pipeline starts dimension and fact master pipelines, which in turn execute unit pipelines, such as a loading a dimension table. This allows me to restart ETL at any level. In the Dimension dropdown (nothing to do with DW dimensions), I select all such master pipelines because if an error is triggered downstream, it will bubble up to the master.
  2. Failure Type – I select all failure types.
  3. Condition – I configure the alert to be generated as soon as one failure occurs.
  4. Period – This is a tricky one. It specifies over what period the threshold failure count will be evaluated. Let’s say you schedule the ETL process nightly at 12 AM. If you specify a value lower than 24 hours, let’s say 6 hours, Azure Monitor will check for failures every 6 hours. If ETL fails at say 12:15 AM, you will get the alert the next time Azure Monitor runs as you should. But then, after it checks in another 6 hours and finds no failure, it will send a notification that the failure is resolved, while probably it’s not. Therefore, I set the period to 24 hours. Obviously, this will be an issue if ETL runs weekly but 24 hours is the longest period supported.
  5. Frequency – I set this to the longest frequency of 1 hour as it doesn’t make sense to check frequently for failures if the process runs once in a day. With this setup, the threshold count will be evaluated every hour for each 24-hour cycle.


Notes on Fabric F2 Performance: Report Load

What a better way to spend a lazy holiday afternoon than to do more Fabric performance testing? In my previous post, I shared my results from a single-threaded ETL load test to gauge the F2 ingest performance and F2 did pretty well (or at least outperformed Azure SQL DB). Will F2 hold as parallelism increases? Throughput testing is especially important for report loads because parallel tasks can run within a report, such as visuals executing DAX queries in parallel, and across reports, such as when concurrent report requests overlap.

I used the artifacts are included in the “Microsoft Dashboard in a Day” for this test and load tested only the first report page.

The Sales fact table in the semantic model has over seven million rows so it represents a good size dataset. Naturally, the more involved the report is and the more data the semantic model has, the more CPU power and parallelism are needed. I used the Microsoft Power BI Dedicated Capacity Load Assessment Tool and configured it to filter the report on different years in order to avoid report caching. I ran four tests for 1, 2, 3 and 4 virtual users with no think time, and each test ran for 10 minutes.

Here are the results:

UsersTotal report rendersRenders per user
1631×63
21002×50
31353×45
41644×41

Here are some additional findings:

  1. Within the first minute or so, F2 generates reports fast, presumably because bursting comes into play to let F2 borrow and recruit more CPU resources. As the sustained load continues, Fabric starts scaling back and throttling CPU.
  2. As time goes by, report executions are getting increasingly slower. While during the first minute a report can take 1-2 seconds for example, later it might take as much as 40 seconds to render (users are unlikely to tolerate this). This happens even with one virtual user, presumably because the quarter of the core is insufficient.
  3. I haven’t encountered any errors. All report executions succeeded irrespective of how long they take.

What all these tests mean is that if Fabric is appealing to you, F2 can be a viable option for smaller organizations where report users are expected to run reports sporadically. In case of a sudden load, such as everyone running reports at 8 AM on Monday, Fabric bursting can elevate the pressure for the first minute or so. Of course, you need to weigh in many other factors, such as relenting control to Microsoft, waiting for the technology to mature, avoiding lock-in, evaluating budget (note that viewers would still need at least Power BI Pro individual licenses for capacities lower than F64), and various other considerations I covered in my previous Fabric-related posts.

Notes on Fabric F2 Performance: Warehouse ETL

As inspired by Amir Netz‘s encouragement to partners to test the Fabric F2 capacity performance, I got on a quest to test what it would do to ETL loads for Fabric Warehouse. I must admit that I was skeptical that a quarter of a core would take a warehouse off the ground, but as usual, life proved me wrong and “wrong” is a big understatement of what happened.

After provisioning a Fabric F2 capacity and a warehouse, I settled on the Retail Data Model for World Wide Importers sample star schema dataset consisting of five dimension tables and one fact table. In terms of performance, I was mostly interested in how long it would take for the ADF copy activity to insert all the data (50 million rows) in the fact table. Granted, it’s a limited test but enough to rule out the technology for real-life projects. Then, I compared the performance against Azure SQL Database Serverless running on up to 2 cores and provisioned by the free trial offer that Microsoft has on Azure. To exclude impact on data transfer between regions, both technologies were provisioned on East US 2 data region, which is the region where my Power BI tenant is hosted on.

Much to my surprise, it took less than two minutes to load all 50 million rows in F2, whereas it took 1 hour to load to load 27 million rows to Azure SQL Database before the maximum 30 GB disk space was exhausted! I couldn’t believe it so I ran the test three times to confirm. Surely, bursting helps a lot! Now, throughput would be a different story, but as far as the warehouse is concerned, it doesn’t matter because in most cases, data will be imported in a Power BI semantic model and the warehouse will be out of the picture. As a next step, I plan to test the report throughput to see what concurrent report load would saturate the F2 capacity.

In conclusion, the Fabric lowest capacity F2 ($262.80 monthly cost) could be a viable option for smaller organizations willing to make their foray in the Fabric world. On the downside, we must leave Fabric to marinate for a few months and add needed features, including surrogate keys and MERGE for Warehouse and on-prem connectivity for Azure Data Factory, in order to be in consideration for real-life projects. More tests are needed to gauge the F2 report throughput.

UPDATE 12/24/2023 I was curious how much loading the same dataset from a CSV file would impact performance. It took much longer: 18 minutes. The most significant factor was that loading from CVS requires staging to a data lake although this appears redundant because the CVS file was in a lakehouse in the same Power BI workspace. ADF spent a total of 18 minutes in the two-staged copy (ten minutes to stage the data and eight minutes to load the fact table from the staged copy). Therefore, Parquet outperformed significantly CVS, probably because the Microsoft-provided Parquet file was compressed.

ADF Cross Environment Schema Compare Tool

Almost every BI project requires at least two environments, such as DEV and PROD. Unless I’ve missed something, one Azure Data Factory caveat irrespective of the code promotion path (manual or automated with Azure DevOps or Git CI/CD) is that it uses ARM template deployment where the template contains all the artifacts. The equivalent for database schema deployment would be to script the entire database schema which makes me nervous. Not to mention that ARM templates have their own gotchas, such as the one I discussed here when shared self-hosted integration runtimes are used.

So, I got on a quest to find an ADF schema comparison tool for a quick and dirty way to identify ADF code discrepancies between two environments and promote changes manually. Ideally, the tool would be something like SQL Server Database projects in Visual Studio.

However, I wasn’t able to find such a schema comparison tool for ADF. The closest match was a PowerShell script by Riccardo Pericoto that extracts the ADF artifacts as files. My humble contribution was a few minor changes to the output folders, so that the artifacts from the ADF DEV service are saved in subfolders under a “dev” folder, while the production artifacts are saved under a “prod” folder. I’ve made this change to take advantage of a WinMerge feature that can scan subfolders. I’ve also added a line to delete all files in the target folders.

I enclose the script with the changes in bold:

# Install-Module -Name Az.DataFactory
# Credits: Riccardo Perico https://medium.com/riccardo-perico/comparing-azure-data-factories-exporting-all-the-components-929861ad2e00
Login-AzAccount
Get-AzSubscription -SubscriptionName 'MTX_Int_BI' | Set-AzContext -Name 'MyContextName'
Set-AzContext -Context $(Get-AzContext -Name "MyContextName")
$base_output_url = "C:\temp\adf\"
$pipeline_output = "activities"
$dataset_output = "datasets"
$linked_services_output = "linkedservices"
$triggers_output =  "triggers"

$adfv2_rsg_name_tc1 = 'mtx-rsg-adf-dev'
$adfv2_rsg_name_tc2 = 'mtx-rsg-adf-prod'
$adfv2_name_tc1 = 'mtx-adf-dev'
$adfv2_name_tc2 = 'mtx-adf-prod'

#Delete all files
Get-ChildItem -Path $base_output_url -Include *.* -File -Recurse | foreach { $_.Delete()}
$js = (Get-AzDataFactoryV2Pipeline -ResourceGroupName $adfv2_rsg_name_tc1 -DataFactoryName $adfv2_name_tc1) | Select-Object "Name"
$js2 = (Get-AzDataFactoryV2Pipeline -ResourceGroupName $adfv2_rsg_name_tc2 -DataFactoryName $adfv2_name_tc2) | Select-Object "Name"
$js_dst = (Get-AzDataFactoryV2Dataset -ResourceGroupName $adfv2_rsg_name_tc1 -DataFactoryName $adfv2_name_tc1) | Select-Object "Name"
$js_dst2 = (Get-AzDataFactoryV2Dataset -ResourceGroupName $adfv2_rsg_name_tc2 -DataFactoryName $adfv2_name_tc2) | Select-Object "Name"
$js_lks = (Get-AzDataFactoryV2LinkedService -ResourceGroupName $adfv2_rsg_name_tc1 -DataFactoryName $adfv2_name_tc1) | Select-Object "Name"
$js_lks2 = (Get-AzDataFactoryV2LinkedService -ResourceGroupName $adfv2_rsg_name_tc2 -DataFactoryName $adfv2_name_tc2) | Select-Object "Name"
$js_trg = (Get-AzDataFactoryV2Trigger -ResourceGroupName $adfv2_rsg_name_tc1 -DataFactoryName $adfv2_name_tc1) | Select-Object "Name"
$js_trg2 = (Get-AzDataFactoryV2Trigger -ResourceGroupName $adfv2_rsg_name_tc2 -DataFactoryName $adfv2_name_tc2) | Select-Object "Name"

foreach ($pl in $js)
{
    (Get-AzDataFactoryV2Pipeline -ResourceGroupName $adfv2_rsg_name_tc1 -DataFactoryName $adfv2_name_tc1 -Name $pl.Name).Activities | Sort-Object "Name" | Out-File $base_output_url"dev\"$pipeline_output"\$($pl.Name).txt"
}
foreach ($pl2 in $js2)
{
    (Get-AzDataFactoryV2Pipeline -ResourceGroupName $adfv2_rsg_name_tc2 -DataFactoryName $adfv2_name_tc2 -Name $pl2.Name).Activities | Sort-Object "Name" | Out-File $base_output_url"prod\"$pipeline_output"\$($pl2.Name).txt"
}
foreach ($d in $js_dst)
{
    (Get-AzDataFactoryV2Dataset -ResourceGroupName $adfv2_rsg_name_tc1 -DataFactoryName $adfv2_name_tc1 -Name $d.Name).Properties | Sort-Object "Name" | Out-File $base_output_url"dev\"$dataset_output"\$($d.Name).txt"
}
foreach ($d2 in $js_dst2)
{
    (Get-AzDataFactoryV2Dataset -ResourceGroupName $adfv2_rsg_name_tc2 -DataFactoryName $adfv2_name_tc2 -Name $d2.Name).Properties | Sort-Object "Name" | Out-File $base_output_url"prod\"$dataset_output"\$($d2.Name).txt"
}
foreach ($l in $js_lks)
{
    (Get-AzDataFactoryV2LinkedService -ResourceGroupName $adfv2_rsg_name_tc1 -DataFactoryName $adfv2_name_tc1 -Name $l.Name).Properties | Sort-Object "Name" | Out-File $base_output_url"dev\"$linked_services_output"\$($l.Name).txt"
}
foreach ($l2 in $js_lks2)
{
    (Get-AzDataFactoryV2LinkedService -ResourceGroupName $adfv2_rsg_name_tc2 -DataFactoryName $adfv2_name_tc2 -Name $l2.Name).Properties | Sort-Object "Name" | Out-File $base_output_url"prod\"$linked_services_output"\$($l2.Name).txt"
}
foreach ($t in $js_trg)
{
    (Get-AzDataFactoryV2Trigger -ResourceGroupName $adfv2_rsg_name_tc1 -DataFactoryName $adfv2_name_tc1 -Name $t.Name).Properties | Sort-Object "Name" | Out-File $base_output_url"dev\$triggers_output$($t.Name).txt"
}
foreach ($t2 in $js_trg2)
{
    (Get-AzDataFactoryV2Trigger -ResourceGroupName $adfv2_rsg_name_tc2 -DataFactoryName $adfv2_name_tc2 -Name $t2.Name).Properties | Sort-Object "Name" | Out-File $base_output_url"prod\$triggers_output$($t2.Name).txt"
}

Once the files are saved, the next step is to use WinMerge configured to scan subfolders to identify differences:

Then, you can manually copy the JSON payload of the changed artifact and replace its equivalent in the other environment. Long live ADF continuous integration and delivery!

Deactivating ADF Activities

Lo and behold, Azure Data Factory now supports deactivating activities as a preview feature. It took only seven years…

You can deactivate/activate activity by right-clicking it in the canvas or from its General settings. You can also configure how the subsequent activities should treat a deactivated activity, with Succeeded being the most common outcome.

Power BI Dataflows vs ADF Mapping Data Flows

An enterprise client wants to migrate many Alteryx workflows created over years by smart business users to the Microsoft ecosystem. During the initial intake, we discussed Power BI dataflows vs Azure Data Factory mapping data flows. Yep, Microsoft loves to confuse us, but these technologies have nothing to do with each other.

Power BI DataflowsADF mapping data flows
Target audienceBusiness usersProfessionals
AvailabilityPower BI ServiceAzure Data Factory and Synapse Studio
Underlying technologyPower QuerySpark
Expression languageM LanguageExpression functions evaluated to Spark data types
Computation EnginePower BI Compute EngineSpark clusters
OutputAzure Data Lake Storage (CSV files in CDM folders)Many sinks
DebuggingN/ADebug mode
MonitoringVery basic (refresh failures)Detail output

In a nutshell, Power BI dataflows are meant for self-service ETL, where the business users would be responsible for creating and managing the ETL flows. By contrast, ADF mapping data flows target BI Pros. If you have been following my blog, you know that I’m big proponent for the ELT pattern for various reasons, mainly better performance and avoiding tool dependencies. Despite how much Microsoft promotes ADF mapping data flows, my typical data integration projects don’t use them. The last time I looked at them, they didn’t support ADF self-hosted runtimes, and they are a pain to debug. But if you must do transformations on the fly, e.g. when dumping data into files, then you obviously don’t have a choice.

So, what did the client decide to do? IT decided to take over the Alteryx workflows and convert them to Azure Data Factory. So much about self-service ETL.

Azure Data Factory is Getting Better All the Time

Three years ago, I wrote that it would probably take a decade for to mature and close the gap with SSIS.

To its credit thought, while it’s still lagging in the area of extensibility, ADF added features that we don’t have in SSIS so I’m developing a taste for it:

  1. Schema drift – Suppose you want to automatically stage new columns as they added to a source table. Or, columns might be deleted from the source but your ETL shouldn’t fail. You can’t do these things with SSIS which is tightly coupled with the data source schema. ADF data flows, however, can handle this.
  2. Parallel loops – Want to loop through some tables but load them in parallel? The ADF ForEach loop can be parallelized up to 50 concurrent threads.
  3. Source partitioning – Let’s say you have a big source table and you want to speed up staging. You can configure the Copy Activity to automatically create multiple threads to load the table in parallel, such as by partition (if the source table is already partitioned) or by buckets based on a primary key.
  4. Scalability – As I mentioned in the blog above, this was the main driver for Microsoft to start from scratch with ADF. You’d be hard pressed to run out of resources with ADF, so it wins hands down against SSIS in this area.
  5. Managed VNET on a horizon – Currently in preview, you can ask your helpful System Services to setup a managed virtual network and thus avoid the need to set up self-service runtimes for accessing on-prem data sources. Make sure you install a Linux VM as the tutorial demonstrates since we found the hard way that Windows won’t work.

ADF is not without idiosyncrasies of course. Why would data flows have a separate expression language and require a separate runtime? Speaking of data flows, I almost used them for their automatic file partitioning until I found that I don’t have the control over the partition names to support both full and incremental load. Long live the copy activity!