Posts

How Do We Start?

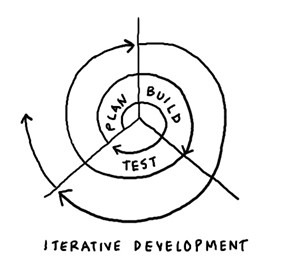
How do you start a data warehousing project? Not much different than any complex software project. You break it down to small iterations, e.g. by subject area, design and implement each iteration from beginning to end, and deploy to deliver incremental value. Agile? Perhaps. In my career I’ve seen software methodologies come and go so I’d abstain from applying a label. The main goal is to break complex tasks in smaller increments. You can call it agile if you want. But if I must meet every day for 15 minutes and hold hands (I had to do this a while back because my employer was agile, believe me), or deliver some crappy code in some predefined timeframes (sprints), then agile I am not.

So you stated your first iteration (typically Sales as revenue is an important metric to track). Now what? Next, we identify metrics, aka measures. Should you reverse engineer hundreds of reports that you’ve accumulated over decades to come up with these metrics? I’m too lazy to do this and frankly this very well might be a dead-end road. Instead, I suggest you go to the subject matter expert overseeing this iteration and ask him to a list of metrics (aka measures or facts) that he’d use to analyze his business subject area. He should be able to produce this in minutes. Then you ask him what perspectives he’d like to analyze these metrics and you now have dimensions. Then, you follow the dimensional modeling to come up with the design.

The important thing to remember is your iteration won’t be perfect. Nothing is. There will be gaps and misunderstandings, aka bugs. And that’s fine. That’s life. You keep on refining, extending and building… and you’re never done. Because business evolves and so does BI.

What’s ROI for BI?

I often ask prospects if they’ve done any estimates of the value that the envisioned BI solution would bring to them. The Microsoft Solution Framework actually recommends partners do this during the planning phase. Alas, the answer is almost always negative. Then I ask what criteria would be used to evaluate if my price (I give fixed value-based prices as I don’t sell time) would yield a good ROI and then there is an awkward pause. Instead, the buyer typically uses a top-down approach for selecting a consultant. The buyer either has some budget constraints and solicits multiple quotes to find the “best” fit. There is nothing wrong with this, of course, given that ROI for BI is notoriously difficult to determine.

Consultancies and advisory firms have some sort of a “seat-of-the-pants” methodology to help the customer come up with ROI if this is deemed important. But you might not have to go through this exercise as research companies has done the math for you. For example, Nucleus Research has estimated that BI delivers 1300% ROI!

“In analyzing Nucleus ROI case studies on analytics, we found the average returns from analytics have been increasing, reaching $13.01 for every dollar spent in 2014 from just $10.66 in 2011.”

Often, the benefits of an effective and insightful BI solution can only be realized after the customer has started using the solution. I’m always delighted when customers report that our solution has paid for itself in the first year or so. For example, an insurance company that has found that customers underreport their risk exposure and justifiably increased premiums. Or, another client that has found that data analytics transformed the organization’s data into a key strategic business asset, empowering employees like never before.

What’s your ROI for BI?

Gartner’s 2017 BI and Data Analytics Magic Quadrant Shows Microsoft Leading

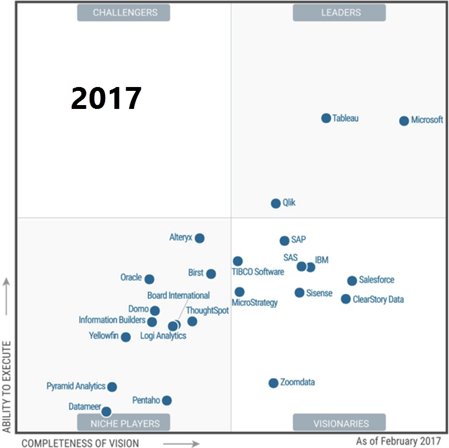
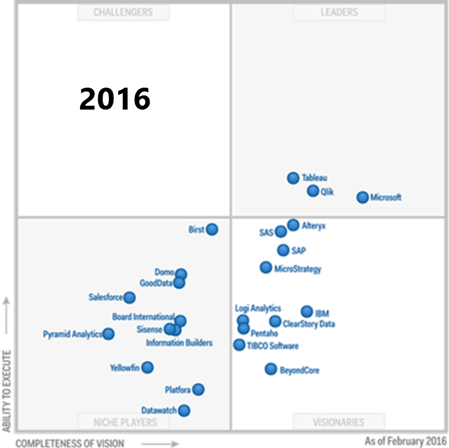
Power BI is enjoying a tremendous momentum and unprecedented popularity. Just within this month, your humble correspondent has been teaching Power BI four times in a row. It looks like industry observers are taking notice of this momentum. As Kamal Hathi (General Manager, Microsoft BI) announced, the newly released Garner Magic Quadrant for Business Intelligence and Data Analytics gave Microsoft a very high score. The image below shows the Microsoft’s lift between last year and this year in the Gartner magic quadrant.

I’m not surprised about the Qlik drop given they sold out the company. What’s still surprising to me is that Gartner ranked Tableau and Microsoft almost the same on the ability to execute. Although the report is not out yet, judging by the stub, Gartner used the same 14 criteria as last year, but added one more which is unknown at this point (probably real-time where Microsoft can score very high as well). Here are my comments on where Microsoft stands on these 14 criteria. You might also find my two-part blog about Tableau vs. Microsoft useful if you are tasked to compare vendors.

Capability

Teo’s Rank for MS BI

Comments
InfrastructureBI Platform Administration
Capabilities that enable scaling the platform, optimizing performance and ensuring high availability and disaster recovery

High

On premises or cloud, I think the MS BI Platform is second to none
Cloud BI
Platform-as-a-service and analytic-application-as-a-service capabilities for building, deploying and managing analytics and analytic applications in the cloud, based on data both in the cloud and on-premises

High

Power BI supports both pure cloud and hybrid architectures
Security and User Administration
Capabilities that enable platform security, administering users, and auditing platform access and utilization

Medium

More work is required to support external users in Power BI, Power BI Embedded, and SSRS
Data Source Connectivity
Capabilities that allow users to connect to the structured and unstructured data contained within various types of storage platforms, both on-premises and in the cloud.

High

As of this time, Power BI supports close to 70 connectors to let you connect to cloud and on-premises data sources. No scripting required.
Data ManagementGovernance and Metadata Management
Tools for enabling users to share the same systems-of-record semantic model and metadata. These should provide a robust and centralized way for administrators to search, capture, store, reuse and publish metadata objects, such as dimensions, hierarchies, measures, performance metrics/key performance indicators (KPIs) and report layout objects, parameters and so on. Administrators should have the ability to promote a business-user-defined data model to a system-of-record metadata object.

Medium

Power BI has done a good job to provide auditing and admin oversight but more work is required for proactive monitoring and improving its data governance capabilities
Self-Contained Extraction, Transformation and Loading (ETL) and Data Storage
Platform capabilities for accessing, integrating, transforming and loading data into a self-contained storage layer, with the ability to index data and manage data loads and refresh scheduling.

Medium

SSIS is the most popular on-premises ETL tool. More work is required to bring similar capabilities in the cloud (I think Azure Data Factory is a step backwards)
Self-Service Data Preparation
The drag-and-drop, user-driven data combination of different sources, and the creation of analytic models such as user-defined measures, sets, groups and hierarchies. Advanced capabilities include semantic autodiscovery, intelligent joins, intelligent profiling, hierarchy generation, data lineage and data blending on varied data sources, including multistructured data

High

Power BI Desktop and Excel has a fantastic query editor (originated from Power Query) that scores big with business users. Tableau doesn’t have such native capabilities. Power BI and Excel have best of class self-modeling capabilities (much better than Tableau). Azure Query Catalog can be used for dataset autodiscovery.
Analysis and Content CreationEmbedded Advanced Analytics
Enables users to easily access advanced analytics capabilities that are self-contained within the platform itself or available through the import and integration of externally developed models.

High

Not sure what is meant here by “advanced analytics capabilities”. Power BI supports integration with R, Azure Machine Learning, clustering, forecasting, binning, but I might be missing something.
Analytic Dashboards
The ability to create highly interactive dashboards and content, with visual exploration and embedded advanced and geospatial analytics, to be consumed by others

High

“Highly interactive dashboards and content” is what Power BI is all about.
Interactive Visual Exploration
Enables the exploration of data via the manipulation of chart images, with the color, brightness, size, shape and motion of visual objects representing aspects of the dataset being analyzed. This includes an array of visualization options that go beyond those of pie, bar and line charts, to include heat and tree maps, geographic maps, scatter plots and other special-purpose visuals. These tools enable users to analyze the data by interacting directly with a visual representation of it

High

According to Gartner’s definition, Power BI should score high but more work is required on the visualization side of things, such as ability to drill through a chart point as we can do in SSRS.
Mobile Exploration and Authoring
Enables organizations to develop and deliver content to mobile devices in a publishing and/or interactive mode, and takes advantage of mobile devices’ native capabilities, such as touchscreen, camera, location awareness and natural-language query

High

Native apps for iOS, Android and Windows to surface both Power BI and SSRS reports.
Sharing of FindingsEmbedding Analytic Content
Capabilities including a software developer’s kit with APIs and support for open standards for creating and modifying analytic content, visualizations and applications, embedding them into a business process, and/or an application or portal. These capabilities can reside outside the application (reusing the analytic infrastructure), but must be easily and seamlessly accessible from inside the application without forcing users to switch between systems. The capabilities for integrating BI and analytics with the application architecture will enable users to choose where in the business process the analytics should be embedded.

High

An Azure cloud service, Power BI Embedded allows you to do this with an appealing cost-effective licensing model.
Publishing Analytic Content
Capabilities that allow users to publish, deploy and operationalize analytic content through various output types and distribution methods, with support for content search, storytelling, scheduling and alerts.

Medium

Power BI supports subscriptions and data alerts but we can do better, such as to allow an admin to subscribe other users. “Storytelling” can mean different things but I thought the integration with Narrative Science can fall into this category.
Collaboration and Social BI
Enables users to share and discuss information, analysis, analytic content and decisions via discussion threads, chat and annotations

High

Power BI supports this with workspaces and Office 365 unified groups.

Of course, there are many competing definitions of what constitutes a BI and Analytics platform. Again, it looks to me that Gartner has predominantly focused on the self-service BI aspect of it (even there Microsoft should have scored higher) and ignored the SQL Server BI features and all the cloud BI-related products (Azure SQL Database, SQL Data Warehouse, Azure ML, Query Catalog, HDInsight, StreamInsight). If we take them in consideration, where will that dot be?

SQL Server MVP for 12 Years

Microsoft awarded me again with the Most Valuable Professional (MVP) Award for SQL Server. This is an annual prestigious award given to selected individuals worldwide in recognition for their expertise and contribution to the community. Currently, there are 371 SQL Server MVPs worldwide and only 85 in the USA. This makes it 12 consecutive years for me as SQL MVP!

Disaster Recovering

Over the last couple of weeks, I learned a thing or two about disaster recovery. My server crashed and it had to be replaced. While we were able to get Prologika.com up and running quickly, the community site was down for a while. I am happy to report that while there are some kinks remaining, for the most part the community site has been restored.

What’s New in SQL Server 2016 BI

Lots of announcements and roadmap updates coming from Microsoft Ignite which replaced TechEd and other conferences with one event. My favorites are the What’s New sessions with the BI-specific ones below.

Microsoft SQL Server BI Drill Down

Microsoft BI Overview

What’s New in Master Data Services (MDS) and Integration Services (SSIS) in SQL Server

What’s Next for Business Analytics in Microsoft Excel

Microsoft Azure SQL Data Warehouse Overview

What’s Next for Visualizations in Microsoft Office

My Wish List for SQL Server.vNext

In an attempt to give customers more transparency, Microsoft recently published a Cloud Platform Roadmap. The product groups are also actively seeking feedback for the on-premise products (also known as boxed products). For example, if you have subscribed to the Power BI.vNext public preview, you can use the BI in SQL vNext forum to provide feedback (not sure why there instead of on connect.microsoft.com).

So, here is my open high-level SQL Server.vNext wish list:

  • SSAS – Merge Multidimensional and Tabular and take best from both. I like the in-memory engine and flexibility of Tabular but at the same time I miss the MD pro features. To put this in perspective, I’d like to see the following features added to Tabular:
    • Additional relationship types, such as M2M relationships (it looks like this will happen judging by the Power BI features), multi-grain relationships (joining to a table at a higher grain than the key), role-playing
    • Scope assignments
    • Sets
    • MDX support for business calculations – BI pros have been learning MDX for the past 15 years so this knowledge shouldn’t be wasted. Besides, some constructs are better expressed in MDX not to mention that Tabular doesn’t have support for hierarchy navigation.
    • Enterprise scale features – parallel partition processing within a table, ability to define which columns will be hierarchized (measures typically shouldn’t, yet now every column is hierarchized), compression on calculated columns
    • Removal of DirectQuery limitations
    • Custom (non Windows-based) security – This applies to both MD and Tabular in order to allow developers to embed reports in custom applications.
    • Better toolset – No matter how good SSAS gets, it won’t go far if there is no good client support. Excel and Power View need catching up. For example, Excel need to generate DAX natively, optimize MDX queries (especially for detail-level reports), and add Power View support for MD, plus numerous enhancement to catch to modern interactive tools.
    • Tabular Designer enhancements – it’s painful to wait SSDT to refresh after every step.
  • SSRS
    • Report Designer should continue where it left off in 2010 when focus was shifted on Power View. See top requested features on connect.microsoft.com, especially in the area of report parameters.
    • Power View – conditional formatting, drillthrough, SSAS action support, mapping enhancements (region coloring, point-to-point mapping)
    • Ability to embed Power View reports in custom apps.
    • Data alerts on Power View and SSRS in native mode.
    • Q&A on prem
    • Bring Power BI features to boxed products. Since we decouple Power BI from SharePoint, installing it on a local IIS server shouldn’t be an issue.
  • SSIS – Project mode and development enhancements in 2012 were great but the product group should take a look at competing products, especially those that attempt to automate ETL. I don’t care much about the Data Flow since I typically use the ETL pattern, so I won’t comment on the data flow tasks.
    • Data profiling should be built in the data sources instead of separated as a separate task
    • Change management – make it easy to see what source mappings have changed. Don’t make me go through input and output connectors to fix these mappings when they change.
    • Scale out ETL across multiple servers
  • SQL Database Engine – Based on what I do, I need better support for data warehousing.
    • Improve query optimizer for large joins
    • Unify memory technologies – in most cases you want to have both in-memory tables and fast analysis.
    • Enhance clustered columnstore indexes to support additional regular indexes. See my post for more info.
  • MDS/DQS
    • Ideally, unify MDS and DQS into a single product as there is a significant overlap.
    • MDS Excel add-in is good but usability needs to be improved. No one wants to scroll a long pick list of a domain-based attribute to find something.
    • Ability to reference an entity from another model.

Microsoft is Serious about Statistical Analysis and Machine Learning

Microsoft announced two company acquisitions related to data analytics.

It announced that it will acquire Revolution Analytics. Revolution Analytics is the leading commercial provider of software and services for R, the world’s most widely used programming language for statistical computing and predictive analytics. This acquisition could help more companies use the power of R and data science to unlock big data insights with advanced analytics.

Previously, Microsoft also announced that it will acquire Equivio. Equivio is a provider of machine learning technologies for eDiscovery and information governance to help customers tackle the legal and compliance challenges inherent in managing large quantities of email and documents.

SQL Server and 20 Cores Limit

Scenario: You execute a SQL Server 2012 task that uses parallelism, such as index rebuild or a query on a server with more than 20 cores running SQL Server 2012 Enterprise Edition. In the Windows Task Manager, you observe that the task uses only 20 cores. We discovered this scenario during a rebuild of a columnstore index. To confirm this further, you examine the SQL Server log and notice that a similar message is logged when the SQL Server instance starts:

“SQL Server detected 8 sockets with 4 cores per socket and 4 logical processors per socket, 32 total logical processors; using 20 logical processors based on SQL Server licensing. This is an informational message; no user action is required.”

Explanation: More than likely, you have upgraded to SQL Server 2012 from SQL Server 2008 R2 under Software Assurance. Microsoft created a special SKU of Enterprise Edition to support this scenario with the caveat that this SKU limits an instance to using only 20 processor cores (or 40 CPU threads if hyperthreading is enabled). If this level of parallelism is not enough, the only solution is to switch to the Enterprise Edition SKU that is licensed per core and purchase a license that covers as many cores as needed. Once you obtain the new license key, you can upgrade your SQL Server instance:

Setup.exe /q /ACTION=editionupgrade /INSTANCENAME=MSSQLSERVER /PID=<PID key for new edition>” /IACCEPTSQLSERVERLICENSETERMS

2015 Annual TI Forecast by TEKsystems

TEKSystems has been a wonderful sponsor of the Atlanta MS BI Group. They’ve recently published an interesting 2015 Annual TI Forecast report. According to the report, Business Intelligence/Big Data will be among the top most impactful technologies in 2015. More key facts:

  • Seventy-one percent of IT leaders report confidence in their ability to satisfy business demands in 2015, representing an increase from 66 percent and 54 percent in forecasts for 2014 and 2013, respectively.
  • The top five areas where most IT leaders expect to increase spending in 2015 include security (65 percent), mobility (54 percent), cloud (53 percent), BI/Big Data (49 percent) and storage (46 percent). Twenty-nine percent of IT leaders also expect to increase spending on ERP.
  • Seventy-three percent of IT leaders indicate that operational objectives such as reducing costs, improving efficiency, consolidating, standardizing and streamlining present the biggest organizational challenges.
  • Salary increases are most likely to be average, with 68 percent of IT leaders saying that they expect overall staff salaries to increase by up to 5 percent. Only 8 percent expect increases of 6 percent or more and 21 percent expect salaries to remain the same.
  • Hiring expectations have also slowed. Entering 2014, 47 percent of IT leaders expected an increase in full-time IT staff hiring. Entering 2015, just 40 percent expect an increase, and 50 percent expect it to be the same as 2014.