Atlanta BI fans, please join us in person for our next meeting on Monday, March 2nd at 18:30 ET. Shabnam Watson will show you how you can apply your SQL skills in Microsoft Fabric. And your humble correspondent will walk you through some of the latest Power BI and Fabric enhancements. I will sponsor the meeting. For more details and sign up, visit our group page.
Delivery: In-person Level: Beginner/Intermediate Food: Pizza and drinks will be provided
Agenda:
18:15-18:30 Registration and networking
18:30-19:00 Organizer and sponsor time (news, Power BI latest, sponsor marketing)
19:00-20:15 Main presentation
20:15-20:30 Q&A
Overview: New to Microsoft Fabric? Don’t worry—you already know more than you think. In this beginner-friendly session, we’ll explore how your existing SQL skills translate directly into Fabric without needing to learn Spark, Python, or unfamiliar engineering tools. You’ll see how SQL can be applied across Fabric items to explore, shape, and analyze data with confidence. If you’re just beginning your Fabric journey, this session offers a simple, approachable path to success using the skills you already have.
Speaker: Shabnam is a business intelligence consultant and owner of ABI Cube, a company that specializes in delivering data solutions using the Microsoft Data Platform. She has over 20 years of experience and is recognized as a Microsoft Data Platform MVP for her technical excellence and community involvement. She is passionate about helping organizations harness the power of data to drive insights and innovation. She has a deep expertise in Microsoft Analysis Services, Power BI, Azure Synapse Analytics, and Microsoft Fabric. She is also a speaker, blogger, and organizer for SQL Saturday Atlanta – BI version, where she shares her knowledge and best practices with the data community.
Sponsor: Prologika (https://prologika.com) helps organizations of all sizes to make sense of data by delivering tailored BI solutions that drive actionable insights and maximize ROI. Your BI project will be your best investment, we guarantee it!
https://prologika.com/wp-content/uploads/2016/01/logo.png00Prologika - Teo Lachevhttps://prologika.com/wp-content/uploads/2016/01/logo.pngPrologika - Teo Lachev2026-02-25 13:29:302026-02-25 13:29:30Atlanta Microsoft BI Group Meeting on March 2nd (Your First Steps in Microsoft Fabric Using Just SQL)
Atlanta BI fans, please join us in person for our next meeting on Monday, February 2nd at 18:30 ET. Sukhwant Kaur (Product Manager at Microsoft) will show you how supercharge your Power BI reports with translytical taskflows. And your humble correspondent will walk you through some of the latest Power BI and Fabric enhancements. CloudStaff.au will sponsor the meeting. For more details and sign up, visit our group page.
Delivery: In-person Level: Beginner/Intermediate Food: Pizza and drinks will be provided
Agenda:
18:15-18:30 Registration and networking
18:30-19:00 Organizer and sponsor time (news, Power BI latest, sponsor marketing)
19:00-20:15 Main presentation
20:15-20:30 Q&A
Overview: Join us for an engaging session exploring how to build powerful translytical applications using Power BI, Functions, and SQL Database within Microsoft Fabric. We’ll discuss best practices for integrating analytics and transactional workloads, demonstrate real-world use cases, and provide actionable tips for leveraging Fabric’s unified platform. This talk is ideal for data professionals interested in bridging analytics and operations for enhanced business value.
Speaker: Sukhwant has served as a Product Manager at Microsoft for the past few development cycles. During this time, she’s focused on the entire product management lifecycle, from working with development teams and user experience to collaborating with cross-functional teams to drive customer satisfaction in ensuring our products not only meet but exceed customer expectations.
Sponsor: At CloudStaff.ai we’re making work MORE. HUMAN. We believe in the power of technology to enhance human potential, not replace it. Our innovative AI and automation solutions are designed to make work easier, more efficient, and more meaningful. We help businesses of all sizes streamline their operations, boost productivity, and solve real-world challenges. Our approach combines cutting-edge technology with a deep understanding of human needs, creating solutions that work the way people do! https://cloudstaff.ai
https://prologika.com/wp-content/uploads/2016/01/logo.png00Prologika - Teo Lachevhttps://prologika.com/wp-content/uploads/2016/01/logo.pngPrologika - Teo Lachev2026-01-28 14:56:522026-01-28 15:09:17Atlanta Microsoft BI Group Meeting on February 2nd (Power BI Translytical Taskflows)
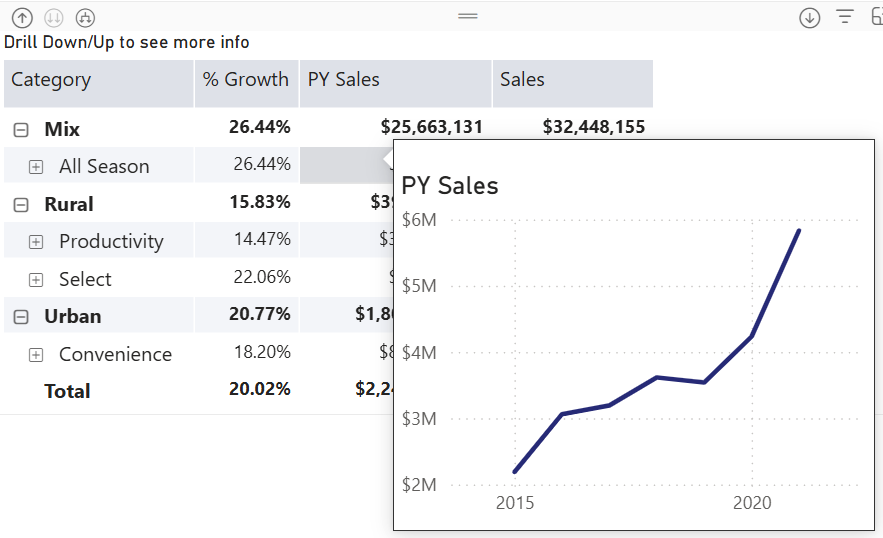
Happy New Year with oldies but goodies…especially given that this technique might be hard to find elsewhere! How do you implement a tooltip page that shows only the measure the end user hovers over? Consider this matrix with three measures on columns grouped by product categories on rows. The user wants to see a trend chart for the measure they hover over.
Understanding the challenge
Power BI has long supported custom tooltip pages. Passing member context, such as the selected product category, is not an issue. However, passing the selected measure won’t work without some blackbelt magic because measures are not field members.
And so, we will have to turn the measures used in the matrix in a dimension. Then, instead of adding measures to the matrix as you would typically do, you would use the dimension. You can probably follow a similar implementation approach using Power BI field parameters, but since I’m a purist, I went with a regular table.
As a disclaimer, I’d rather show the trends in separate graphs side by side on a real-life dashboard, so the end user can see everything at a glance instead popping up tooltips and because I’ll have more control and flexibility over the visualization setup. But, just in case you must use tooltips…
Adding a measure “dimension”
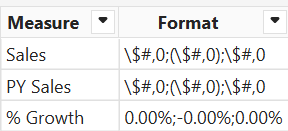
Start by adding a new table to the model either way you want. In this case, I used the Power BI Enter Data feature to create a MatrixMeasures table. This table lists the measures that will be added to the matrix. The format column will be used for dynamic formatting later on.
Then, I added a DAX measure to the MatrixMeasures table as follows:
This formula switches dynamically the DAX measure based on the “current” matrix column. For example, the Sales column will use the existing [Sales] measure. If nothing is selected, it piggy backs on the [Sales] measure. This default provides data to work with when you’re configuring the tooltip chart (otherwise, nothing will be shown because the matrix doesn’t pass the context).
While we are in the DAX rabbit hole, let’s add one more measure for dynamic tooltip chart title:
Next, remove all the individual measures from the matrix and add only the SelectedMeasure measure to the matrix Values well. At this point, the matrix should look like before, except that the measure format settings would be lost.
Tip: If the measures need to be sorted in a specific way, add a new column to the MatrixMeasures table that defines the custom sort order. Then, sort the Measure column by this new column.
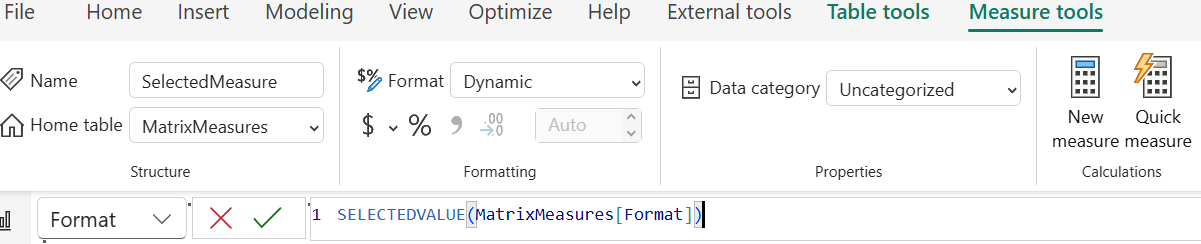
To fix formatting:
Select the SelectedMeasure field in the Data pane.
In the Measure Tools ribbon, change the Format dropdown to Dynamic.
In the formula bar, enter this formula to dynamically change the measure format using the format specified in the Format column of the MatrixMeasures table:
SELECTEDVALUE(MatrixMeasures[Format])
Then, implement the tooltip page and hook it up to the page with the matrix, as explained here. To change the chart title dynamically in the tooltip page, bind it to the SelectedTitle measure.
There you have it. With some wizardry and DAX, you have a measure context-aware tooltip.
Atlanta BI fans, please join us in person for our next meeting on Monday, January 5th at 18:30 ET. Dean Jurecic will show you how Power BI visual calculations can simplify the process of writing DAX. And your humble correspondent will walk you through some of the latest Power BI and Fabric enhancements. Key2 Consulting will sponsor the meeting. For more details and sign up, visit our group page.
Delivery: In-person Level: Beginner/Intermediate Food: Pizza and drinks will be provided
Agenda:
18:15-18:30 Registration and networking
18:30-19:00 Organizer and sponsor time (news, Power BI latest, sponsor marketing)
19:00-20:15 Main presentation
20:15-20:30 Q&A
Overview: Do you sometimes get lost in a sea of complicated DAX and wonder if there is an easier way? Is it difficult to drive self-service reporting in your organization because business users aren’t familiar with the nuances of DAX and Semantic Models? Visual Calculations might be able to help!
Introduced in 2024 and currently in preview, this feature is designed to simplify the process of writing DAX and combines the simplicity of calculated columns with the on-demand calculation flexibility of measures. This session is an overview of Visual Calculations and how they can be used to quickly produce results including:
• Background
• Example Use Cases
• Performance
• Considerations and Limitations
Speaker: Dean Jurecic is a business intelligence analyst and consultant specializing in Power BI and Microsoft Fabric with experience across diverse industries, including utilities, retail, government, and education. Dean is a Fabric Community Super User who holds a number of Microsoft certifications and has participated in the “Ask the Experts” program for Power BI at the Microsoft Fabric Community Conference.
Sponsor: Key2 Consulting is a cloud analytics consultancy that helps business leaders maximize their data. We are a Microsoft Gold-Certified Partner and our specialty is the Microsoft cloud analytics stack (Azure, Power BI, SQL Server).
https://prologika.com/wp-content/uploads/2016/01/logo.png00Prologika - Teo Lachevhttps://prologika.com/wp-content/uploads/2016/01/logo.pngPrologika - Teo Lachev2025-12-30 07:19:272025-12-30 07:19:27Atlanta Microsoft BI Group Meeting on January 5th (Visual Calculations in Power BI)
Telegraph sang a song about the world outside
Telegraph road got so deep and so wide
Like a rolling river…
The Telegraph Road, Dire Straits
At Ignite in November, 2025, Microsoft introducedFabric IQ. I noted to go beyond the marketing hype and check if Fabric IQ makes any sense. The next thing I know, around the holidays I’m talking to an enterprise strategy manager from an airline company and McKinsey consultant about ontologies.
Ontology – A branch of philosophy, ontology is the study of being that investigates the nature of existence, the features all entities have in common, and how they are divided into basic categories of being. In computer science and AI, ontology refers to a set of concepts and categories in a subject area or domain that shows their properties and the relations between them.
So, what better way to spend the holidays than to play with new shaky software?
What is Fabric IQ?
According to Microsoft, Fabric IQ is “a unified intelligence platform developed by Microsoft that enhances data management and decision-making through semantic understanding and AI capabilities.” Clear enough? If not, if you view Fabric as Microsoft’s answer to Palantir’s Foundry, then Fabric IQ is the Microsoft equivalent of Palantir’s Foundry Ontology, whose success apparently inspired Microsoft.
Therefore, my unassuming layman definition of Fabric IQ is a metadata layer on top of data in Fabric that defines entities and their relationships so that AI can make sense of and relate the underlying data.
For example, you may have an organizational semantic model built on top of an enterprise data warehouse (EDW) that spans several subject areas. And then you might have some data that isn’t in EDW and therefore outside the semantic model, such as HR file extracts in a lakehouse. You can use Fabric IQ as a glue that bridges that data together. And so, when the user asks the agent “correlate revenue by employee with hours they worked”, the agent knows where to go for answers.
Following this line of thinking, Microsoft BI practitioners may view Fabric IQ as a Power BI composite semantic model on steroids. The big difference is that a composite model can only reference other semantic models while Fabric IQ can span data in multiple formats.
The Good
Palantir had a head start of a decade or so compared to Microsoft Fabric, but yet even in its preview stage, I like a thing or two about Fabric IQ from what I’ve seen so far:
Its oncology can span Power BI semantic models (with caveats explained in the next section), powered by best-in-class technology. As I mentioned before, this allows you to bridge all the business logic and calculations you carefully crafted in a semantic model to the rest of your Fabric data estate.
Fabric IQ integrates with other Microsoft technologies, such as real-time intelligence (eventhouses), Copilot Studio, Graph. This tight integration turns Fabric into a true “intelligence platform,” reducing duplicated logic, one-off models, and maintenance while enabling multi-hop reasoning and real-time operational agents.
Democratized and no-code friendly – Visual tools allow business users to build and evolve the ontology, lowering barriers compared to more engineering-heavy alternatives. Making it easy to use has always been a Microsoft strength.
Groundbreaking semantics for AI Agents: Fabric IQ elevates AI from pattern-matching to true business understanding, allowing agents to reason over cascading effects, constraints, and objectives—leading to more reliable, auditable decisions and automation.
Compared to Palantir, I also like that Fabric OneLake has standardized on an open Delta Parquet format and embraced data movements tools Microsoft BI pros and business users are already familiar with, such as Dataflows and pipelines, to bring data in Fabric and therefore Fabric IQ.
The Bad
I hope some of these limitations will be lifted after the preview but:
Only DirectLake semantic models are accessible to AI agents. Import and DirectQuery models are not currently supported for entity and relationships binding. Not only does this limitation rule out pretty much 99.9% of the existing semantic models, but it also prevents useful business scenarios, such as accessing the data where it is with DirectQuery instead of duplicating the data in OneLake.
No automatic ontology building – It requires cross-functional agreement on business definitions, workshops, and governance—labor-intensive for organizations without mature semantic models. I hope Microsoft will simplify this process like how Purview has automated scans.
Risk of overhype vs. delivery gap – We’ve seen this before when new products got unveiled with a lot of fanfare, only to be abandoned later.
The Ugly
OneLake-centric dependency. Except for shortcuts to Delta Parquet files which can be kept external, your data must be in OneLake. What about these enterprises with investments in Google BigQuery, Teradata, Snowflake, and even SQL Server or Azure SQL DB? Gotta bring that data over to OneLake. Even shortcut transformations to CSV, Parquet, JSON files in OneLake, S3, Google Cloud Storage, will copy the data to OneLake. By contrast, Palantir has limited support for virtual tables to some popular file formats, such as Parquet, Iceberg, Delta, etc.
What happened to all the investments in data virtualization and logical warehouses that Microsoft has made over years, such as PolyBase and the deprecated Polaris in Synapse Serverless? What’s this fascination with copying data and having all the data in OneLake? Why can’t we build Fabric IQ on top of true data virtualization?
Which is where I was thinking that semantic models with DirectQuery can be used as a workaround to avoid copying data over from supported data sources, but alas Fabric IQ doesn’t like them yet.
Summary
Microsoft Fabric IQ is a metadata layer on top of Fabric data to build ontologies and expose relevant data to AI reasoning. It will be undoubtedly appealing to enterprise customers with complex data estates and existing investments in Power BI and Fabric. However, as it stands, Fabric IQ is OneLake-centric. Expect Microsoft to invest heavily in Fabric and Fabric IQ to compete better with Palantir.
https://prologika.com/wp-content/uploads/2016/01/logo.png00Prologika - Teo Lachevhttps://prologika.com/wp-content/uploads/2016/01/logo.pngPrologika - Teo Lachev2025-12-27 16:09:382026-01-08 16:36:39First Look at Fabric IQ: The Good, The Bad, and The Ugly
What performance and cost considerations should you keep in mind if you are currently on Power BI Pro/PPU, but Fabric looks increasingly enticing and you want to upgrade an existing workspace to Fabric? For example, let’s say you’ve started with a pay-per-user workspace, but now you want that workspace to have Fabric features, such as Copilot, Lakehouse, etc. Or, as a typical use case for small to mid-size companies, you could have a Corporate BI workspace with org semantic model(s) that you want to transition to Fabric, such as to take advantage of DirectLake.
Performance
Performance is difficult to translate because Power BI Pro/PPU run in a shared capacity, meaning compute resources (v‑cores) are pooled across many tenants and dynamically allocated, whereas Fabric capacities are dedicated, meaning that Microsoft grants specific resources expressed as number of cores and memory. Therefore, Fabric performance is predicable while Pro/PPU might not be, although I’m yet to hear from client complaining about unpredictable performance.
Also, keep in mind that Power BI Pro limits you to a quota of 1 GB per dataset, PPU to 100 GB per dataset, and Fabric starts at 3 GB per dataset with F2 and doubles the grant up the chain. This is important for semantic models with imported data.
Although the tool wasn’t designed for estimating upgrade scenarios, you could start with the Fabric Capacity Estimator (preview) to get an initial ballpark estimate for the Fabric capacity. Start low, then monitor the capacity performance using the Microsoft Fabric Capacity Metrics app and be prepared to upgrade if necessary, such as when more parallelism is needed.
Cost
This is easier. Here are the advertised, undiscounted and unreserved prices:
Power BI Pro: $14/user/month (free with M365 E5 plan)
PPU: $24/user/month ($14 discount with M365 E5 plan)
Fabric: Starts at $262.80 per month with F2 and doubles the price up the chain. Finding what capacity you need requires evaluating what workloads you will be running to ensure you have enough resources.
It’s important to note that Fabric capacities lower than F64 require a Power BI Pro license for every user who accesses shared content, regardless of viewing or creating content. Microsoft Copilot and ChatGPT got this wrong by adamantly claiming that viewers don’t require Pro license, while Grok got it right, so be careful which agent you use when researching. The Fabric Capacity estimator also correctly identifies the required Pro licenses.
Of course, Fabric gives you features unfortunately not available in the pay per user licensing plans, so the actual decision in favor of Fabric will probably transcend just performance and cost. When evaluating the performance of the lower Fabric SKUs, you might find the following blogs I wrote on this subject helpful:
https://prologika.com/wp-content/uploads/2016/01/logo.png00Prologika - Teo Lachevhttps://prologika.com/wp-content/uploads/2016/01/logo.pngPrologika - Teo Lachev2025-12-24 17:14:362025-12-29 12:31:11Performance and Cost Considerations from Power BI Pro/PPU to Fabric
What credentials do you use to refresh your Power BI semantic models from Azure SQL SKUs, such as Azure SQL Database. Probably your credentials or a designated Entra account? Both are not ideal for a variety of reasons, including requiring a password. More advanced users might be using service principals, which are more secure but require secret renewal after a maximum of 24 months, which is a hustle.
Somewhere along the way without me noticing, Microsoft added a better authentication option for refreshing Power BI semantic models: workspace identity. This option lets the Power BI workspace using its own managed identity to authenticate to the data source. And it’s available in all Power BI and Fabric SKUs!
What’s not clear from the documentation is how to grant permissions to the workspace identity to read data from Azure SQL SKUs but it’s no different that granting access to the Azure Data Factory managed identity.
Create the workspace identity as explained in the documentation. It has to be done for each workspace that has your published model(s).
In SSMS, connect to your Azure SQL Database using Entra credentials that has permissions to manage security (SQL login won’t work).
Open a new query connected to your database.
Execute the following script assuming you want to grant read permissions to the workspace identity:
CREATE USER [<workspace name>] FROM EXTERNAL PROVIDER;
ALTER ROLE db_datareader ADD MEMBER [<workspace name>];
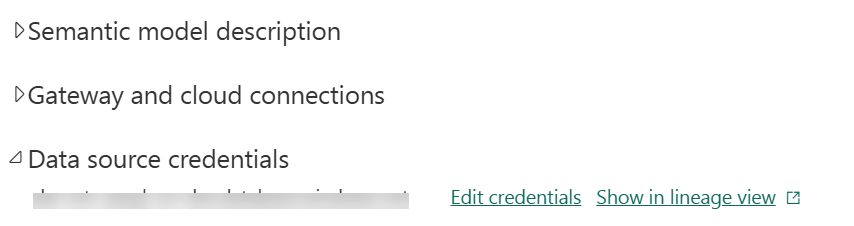
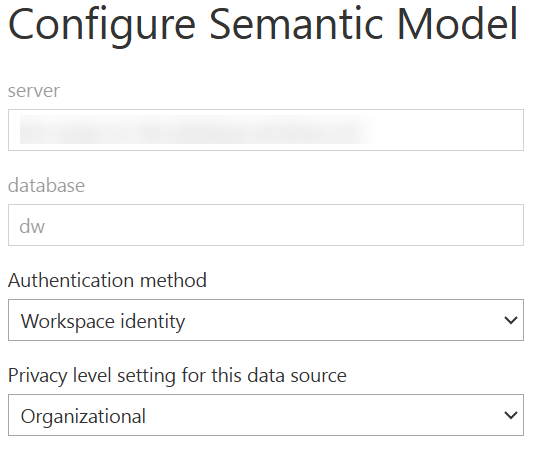
Then back to Power BI, configure your semantic model for workspace identity authentication:
Navigate to the semantic model settings and click “Edit credentials”.
Select “Workspace identity” as the authentication method.
That’s it. Using the workspace identity to read data during model refresh is more secure and easier to manage.
Atlanta BI fans, please join us in person for our next meeting on Monday, December 1st at 18:30 ET. I’ll show you how to Fabric DirectLake semantic models can help you tackle long refresh cycles and scalability headaches. And your humble correspondent will walk you through some of the latest Power BI and Fabric enhancements. Improving will sponsor the meeting. For more details and sign up, visit our group page.
Delivery: In-person Level: Intermediate Food: Pizza and drinks will be provided
Agenda:
18:15-18:30 Registration and networking
18:30-19:00 Organizer and sponsor time (news, Power BI latest, sponsor marketing)
19:00-20:15 Main presentation
20:15-20:30 Q&A
Overview: Are your Power BI semantic models hitting memory limits? Tired of bending backwards to mitigate long refresh cycles and scalability headaches? Join me for a deep dive into Fabric Direct Lake — a game-changing feature that can help enterprise customers eliminate refreshes, lower licensing cost, and work with production-scale data instantly.
You’ll learn:
-Why Direct Lake is a breakthrough for large semantic models
-How to migrate from Import mode with real-world tools and strategies
-Common pitfalls and how to avoid them
-Performance insights and practical tips from actual project
Bonus: See how AI tools like Grok, Copilot or ChatGPT can streamline your migration process!
Whether you’re a BI pro, data engineer, or decision-maker, this session will equip you with the knowledge to scale smarter, design better, and deliver faster.
Speaker: Teo Lachev is a consultant, author, and mentor, with a focus on Microsoft BI. Through his Atlanta-based company Prologika (a Microsoft Gold Partner in Data Analytics and Data Platform) he designs and implements innovative solutions that bring tremendous value to his clients. Teo has authored and co-authored several books, and he has been leading the Atlanta Microsoft Business Intelligence group since he founded it in 2010. Microsoft has recognized Teo’s contributions to the community by awarding him the prestigious Microsoft Most Valuable Professional (MVP) Data Platform status for 15 years. Microsoft selected Teo as one of only 30 FastTrack Solution Architects for Power BI worldwide.
Sponsor: Prologika (https://prologika.com) helps organizations of all sizes to make sense of data by delivering tailored BI solutions that drive actionable insights and maximize ROI. Your BI project will be your best investment!
https://prologika.com/wp-content/uploads/2016/01/logo.png00Prologika - Teo Lachevhttps://prologika.com/wp-content/uploads/2016/01/logo.pngPrologika - Teo Lachev2025-11-26 14:47:552025-11-28 16:39:00Atlanta Microsoft BI Group Meeting on December 1st (Migrating Semantic Models to Fabric Direct Lake)
Atlanta BI fans, please join us in person for our next meeting on Monday, November 3rd at 18:30 ET. Jason Romans (Microsoft MVP) will show you how to use Semantic Link Labs to troubleshoot unreliable reports and semantic models. And your humble correspondent will walk you through some of the latest Power BI and Fabric enhancements. Improving will sponsor the meeting. For more details and sign up, visit our group page.
Delivery: In-person Level: Intermediate Food: Pizza and drinks will be provided
Agenda:
18:15-18:30 Registration and networking
18:30-19:00 Organizer and sponsor time (news, Power BI latest, sponsor marketing)
19:00-20:15 Main presentation
20:15-20:30 Q&A
Overview: It’s dangerous to go alone—take Semantic Link Labs!
When users are the first to discover that a Power BI report is broken, the damage is already done. Trust is lost, adoption slows, and credibility suffers. Instead of wandering into these traps unprepared, what if you had the Master Sword in hand—ready to defeat broken models and guard against treacherous usability pitfalls? That’s the power of Semantic Link Labs.
In this session, we’ll set out on a quest through Microsoft Fabric notebooks and pipelines, using Semantic Link Labs as our weapon and shield against unreliable reports. Along the way, we’ll face down the “mini-bosses” of BI development:
• Reports that collapse due to structural changes
• Models that underperform because best practices were skipped
• Usability pitfalls that make reports “technically fine” but functionally broken for end users
You’ll learn how to install and configure Semantic Link Labs, explore its legendary features, and see how it integrates seamlessly into Fabric. We’ll then take it a step further, automating health checks and governance with notebooks and pipelines—turning one-time fixes into repeatable spells.
By the end of this adventure, you’ll uncover your own “Triforce of Best Practices”—a report that tracks the best practices of all semantic models in your environment. You’ll leave equipped with a map, a shield, and the Master Sword itself: the tools you need to keep your BI world in legendary shape, where broken reports are discovered early, performance issues are vanquished, and best practices reign supreme.
Speaker: Jason Romans is a Business Intelligence engineer in Nashville, TN working with the Microsoft Business Intelligence stack. Jason is a Microsoft MVP who started his career as a DBA and over the years moved to working in his passion of Business Intelligence and data modeling. His first computer was a Commodore 64 and he’s been hooked ever since. Blog: www.thedaxshepherd.com Sessionize: https://sessionize.com/jason-romans/ LinkedIn: https://www.linkedin.com/in/jason-r-sql-jar
Sponsor: Improving is a leading IT professional services firm committed to helping companies achieve lasting success through modern technology. With core expertise in AI, Data, and Applications, we specialize in transforming legacy systems, building cloud-native platforms, and delivering intelligent, future-ready solutions for today’s complex business needs.
https://prologika.com/wp-content/uploads/2016/01/logo.png00Prologika - Teo Lachevhttps://prologika.com/wp-content/uploads/2016/01/logo.pngPrologika - Teo Lachev2025-10-29 12:18:032025-10-29 12:18:03Atlanta Microsoft BI Group Meeting on November 3rd (Semantic Link Labs: A Link to the Future)
Atlanta BI fans, please join us in person for our next meeting on Thursday, October 9th (note that we are meeting on Thursday for this meeting) at 18:30 ET. Sukhwant (Senior Product Manager, Microsoft) will explain why you should consider Fabric SQL databases. And your humble correspondent will walk you through some of the latest Power BI and Fabric enhancements. For more details and sign up, visit our group page.
Delivery: In-person Level: Intermediate Food: Pizza and drinks will be provided
Agenda:
18:15-18:30 Registration and networking
18:30-19:00 Organizer and sponsor time (news, Power BI latest, sponsor marketing)
19:00-20:15 Main presentation
20:15-20:30 Q&A
Overview: Microsoft Fabric is an all-in-one analytics platform, right? Wrong! With the introduction of SQL databases last year, we now have an all-in-one data platform. During this session you will hear directly from the product team about why we added SQL databases to Fabric, who should be using them, how this is different from Azure SQL databases, how to get started through an end-to-end demo, and the integration story with the rest of the platform.
If you’re a DBA that’s been trying to move applications for running SQL or a business user with limited database skills and no DBAs to be found, you’ll want to hear all about this exciting new offering that is simple, automated, and optimized for AI.
Speaker: Sukhwant has served as a Product Manager at Microsoft for the past few development cycles. During this time, she’s focused on the entire product management lifecycle, from working with development teams and user experience to collaborating with cross-functional teams to drive customer satisfaction in ensuring our products not only meet but exceed customer expectations.
Before joining Microsoft, she held various full-time/contracting roles as a technology leader for over two decades in software lifecycle development, system integration and enterprise architecture design. Her expertise extends to Data Strategy, Analytics, and Web Content Management. Throughout her career, she has successfully led numerous projects, both small and large, from inception through to implementation. She is a proponent of the servant-leader philosophy, which aims to continuously improve and empower those she works with.
Sponsor: At CloudStaff.ai, we’re making work MORE. HUMAN. We believe in the power of technology to enhance human potential, not replace it. Our innovative AI and automation solutions are designed to make work easier, more efficient, and more meaningful. We help businesses of all sizes streamline their operations, boost productivity, and solve real-world challenges. Our approach combines cutting-edge technology with a deep understanding of human needs, creating solutions that work the way people do! https://cloudstaff.ai
https://prologika.com/wp-content/uploads/2016/01/logo.png00Prologika - Teo Lachevhttps://prologika.com/wp-content/uploads/2016/01/logo.pngPrologika - Teo Lachev2025-10-03 12:22:122025-10-03 12:22:12Atlanta Microsoft BI Group Meeting on October 9th (Everything You Want to Know About SQL Databases in Fabric)