Prologika Newsletter Spring 2024
 One of the main goals and benefits of a semantic model is to centralize important business metrics and KPIs, such as Revenue, Profit, Cost, and Margin. In Power BI, we accomplish this by crafting and reusing DAX measures. Usually, implementing most of these metrics is straightforward. However, some might take significant effort and struggle, such as metrics that work at aggregate level. In an attempt to simplify such scenarios, the February 2024 release of Power BI Desktop includes a preview of visual calculations that I’ll review in this newsletter.
What’s a Visual Calculation?
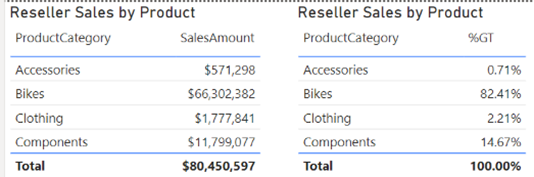
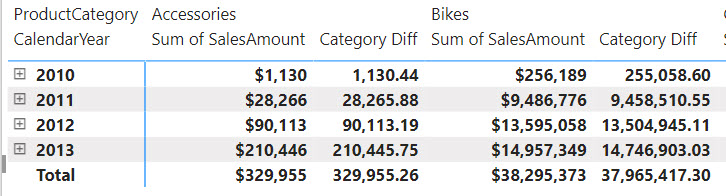
As its name suggests, a visual calculation is a visual-scoped DAX measure that works at the aggregate (visual) level. Don’t confuse the term “calculation” here with calculated columns, tables, or groups. Replace “calculation” with “measure” and you will be fine. Consider the following matrix:
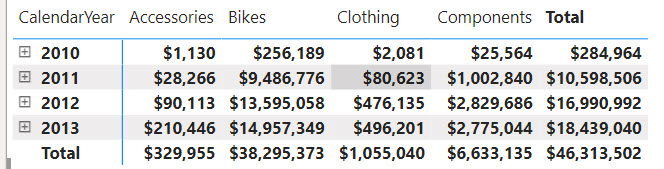
Suppose you need a measure that calculates the difference between the product categories in the order they are sorted in the visual. Implementing this as a regular DAX measure is a challenge. Yet, if we had a way to work with the cells in the visual, we can easily find a way to get this to work. Ideally, this would work similar in Excel, but DAX doesn’t know about relative cell references. However, visual calculations kind of do.
Let’s right-click on the visual and select “New calculation”. Alternatively, click the visual and then click the “New calculation” ribbon button in the Home ribbon. In the visual-level DAX formula bar, enter the following formula:
Category Diff = [Sum of SalesAmount] - PREVIOUS([Sum of SalesAmount], COLUMNS)
The Category Diff measure computes the difference between the current “cell” and the cell for the previous category. For example, for Bikes it will be $9,486,776-$28,266 (Accessories value).
The Good
As you can see, visual calculations can simplify aggregate-level metrics. Notice the use of the PREVIOUS function which is one the new DAX functions specifically designed for visual calculations. Notice also that the PREVIOUS function has additional arguments and one of them is the AXIS argument which specifies if the function should evaluate cells positionally on columns or rows. Traditional DAX functions don’t support the AXIS arguments because they are generic and not designed to operate on a visual level.
Finally, notice that visual-level formulas can only reference fields or measures placed in the visual. This is important as you’ll see later.
The Bad
Among the various limitations, the following will cause some pain and suffering:
1. You can’t export the data of a visual that has a visual calculation.
2. Drillthrough is disabled.
3. Can format visual calculations unless the visual supports it (the matrix visual does support measure formatting).
4. Can’t apply conditional formatting.
5. Can’t change sort order.
6. Can’t use field parameters.
The Ugly
The way Microsoft advertises this feature is that it is “easier than regular DAX” and performs better. My concern is that tempted by these promises, users will abuse visual calculations, such as for creating metrics that should be implemented as regular DAX measures so that any visual can benefit from them. And not before long, such users would find themselves into an Excel-like spreadmart hell which is what they tried to avoid by embracing Power BI.
I see a similar issue with DAX implicit measures, which Power BI users create by dragging a field and dropping it on a visual. I consider them a bad practice for a variety of reasons. Microsoft apparently doesn’t share the same concern (see their comments to my LinkedIn post on the same subject here). To their point, because visual calculations can only “see” fields placed in the visual, they naturally shield the user from abusing them. Let’s give it some time and see who’s right. Meanwhile, I wish this documentation article provides best practices and guidance on when to use implicit, explicit, and visual measures, including their limitations.
Visual calculations are incredibly useful but for limited scenarios. Therefore, please use these visual calculations only when regular DAX measures will not suffice. Business metrics should be centralized and should return consistent results, no matter the reporting tool or visual they are placed in. This is important for achieving the elusive single version of truth.

Teo Lachev
Prologika, LLC | Making Sense of Data
![]()