Planning to attend the PASS Summit this year? The PASS Summit is the go-to conference for data professionals that will take place November 6-9, in Seattle, WA. You have two options to register:
Early bird registration priced at $1,699 has started and it will continue until March 23, 2018. As a bonus, use code LGSTRMZB8 at registration to get streaming access to all PASS Summit 2017 content!
Scenario: You want to overwrite the formatting of some field in a Power BI Visual, such as in the case of showing the field in one visual with decimals and then in another without decimals. Or, you might want to overwrite the default format when connected live to a semantic model. You search left and right, bing the Internet, and still no clue as to why Power BI doesn’t have this feature.
Answer (that you probably won’t like): Most visuals already support display units and decimals. Table and matrix would probably get this feature very soon. We don’t have ETA for full custom format string override (per visual). Your vote counts so vote on ideas.powerbi.com.
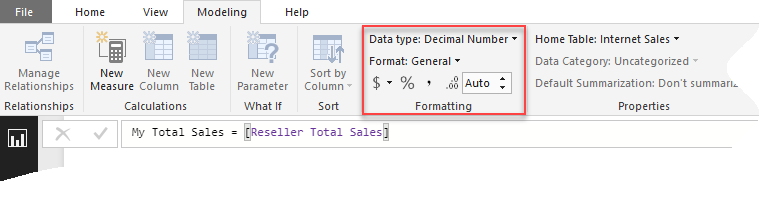
As a best practice, I recommend applying format settings in the model so that it’s applied consistently to all reports.
In the narrower case of formatting measures, you can create a new measure and change its formatting. This also works when Power BI Desktop connects to a Tabular semantic model because you can create local DAX measures on top of the semantic model. Just create a measure that piggy-backs on an existing measure, whose format you want to change. Then, use the Formatting section to change its format.
https://prologika.com/wp-content/uploads/2016/01/logo.png00Prologika - Teo Lachevhttps://prologika.com/wp-content/uploads/2016/01/logo.pngPrologika - Teo Lachev2018-02-07 12:07:042018-02-07 12:07:04Visual-level Formatting in Power BI
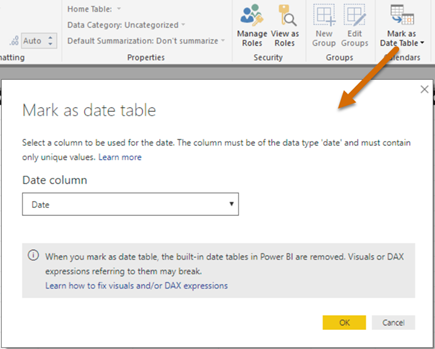
In my “Understanding Dates in Power BI Quick Measures” blog, I mentioned that having a Date table is a best practice but Quick Measures didn’t support it. Fortunately, the February update of Power BI Desktop fixes this. Now you can mark a Data table as such, as you’ve been able to do in Excel Power Pivot since the beginning.
Marking a date table accomplishes three things:
Disables the Power BI-generated date hierarchies (aka as inline hierarchies). Good riddance! Check the same blog for details of why inline hierarchies should be avoided.
Allows you to use your Date table for time calculations in Quick Measures.
Makes DAX time calculations work even if the relationship between a fact table and the Date table is created on a field that is not a date field, such as a smart integer key (YYYYMMDD). Previously, you had to create the relationship on a field of Date data type.
https://prologika.com/wp-content/uploads/2016/01/logo.png00Prologika - Teo Lachevhttps://prologika.com/wp-content/uploads/2016/01/logo.pngPrologika - Teo Lachev2018-02-06 22:21:432020-12-20 21:01:56Mark as Date Table in Power BI
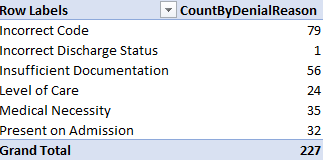
Scenario: You have a concatenated field stored in a table. For example, a medical claim might have several denial reasons. Instead of representing this as a Many-to-Many relationship, you’ve decided to store this a comma-delimited field, such as to allow the user to see all codes on one row. However, users are asking to produce counts grouped by each reason code, such as this one:
Solution: Follow these steps to implement a DAX measure that dynamically parses the string.
Implement a DenialReason table with a single column DenialReason that stores the distinct reason codes. Add the table to your Power BI Desktop/Tabular model. Leaving it hanging without a relationship.
Add a CountByDenialReason DAX measure that parses the string:
The NOT ISMPTY clause checks if the row contains any reasons. The PATHCONTAINS checks if the row has the denial reason whose context is passed from the report. In my case, the DenialReason field has a comma-delimited string if multiple reasons are stored on the row. Because PATHCONTAINS requires a pipe “|” delimiter, I use the SUBSTITUTE function to replace commas with pipes. If match is found for that reason, the IF operator returns one, which is summed in SUMX to return the actual count.
If you have a large table, you might get a better performance if you do the replacement in a wrapper SQL view or in Query Editor and avoid SUBSTITUTE altogether.
https://prologika.com/wp-content/uploads/2016/01/logo.png00Prologika - Teo Lachevhttps://prologika.com/wp-content/uploads/2016/01/logo.pngPrologika - Teo Lachev2018-02-03 17:47:552018-02-03 17:47:55Reporting on Concatenated Field in DAX
A while back I wrote about the ROI for BI and this blog happened to be one of my post popular blogs. I’m a big fan of a BI semantic model for the reasons I outlined in my “Why Semantic Layer” newsletter. Although written five years ago, these are still valid reasons and a semantic model plays a prominent role in every organizational BI solution.
But management cares about business value and not architectures. Allow me to share just one feedback that I got today from one of our insurance customers. In the insurance business, a loss triangle is very important way to analyze losses incurred from claims. Previously, it would take an actuary in this company a month to compile the data and produce a loss triangle report for several important measures, such as Loss Paid Inception to Date. With the semantic model we implemented, it takes seconds.
How long does it take you to compile your reports?
https://prologika.com/wp-content/uploads/2016/01/logo.png00Prologika - Teo Lachevhttps://prologika.com/wp-content/uploads/2016/01/logo.pngPrologika - Teo Lachev2018-01-31 20:34:182018-02-01 17:40:23Business Value of Semantic Model
A week ago, I wrote that Power BI sharing improved by giving you the ability to include specific reports and dashboards in an app. Recall that that there are three ways to share Power BI content: workspaces, apps, and dashboard sharing. Only the last two lets you share content out of a workspace, such as by sharing with free users if the workspace is in a Power BI Premium capacity.
The fast-changing cloud world brought in another nice enhancement this week: the ability to share reports, just like you could share dashboards.
Suppose you have published some content to a workspace and want to share some reports with a certain group of users and other reports with another group of users. An app can’t do it because there is a 1:1 relationship between an app and a workspace and in the process of creating an app you specify a fixed list of recipients. However, you can now share these reports individually without having to create a dashboard.
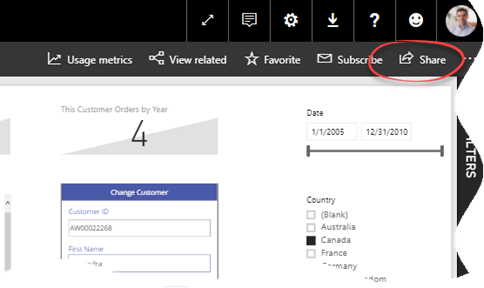
Once you open the report in powerbi.com, just click Share in the top-right corner, and you’ll be presented with the same options as when you share a dashboard. Again like dashboard sharing, you can share reports with external users thanks to the the Power BI B2B integration, as I explain in my last newsletter.
https://prologika.com/wp-content/uploads/2016/01/logo.png00Prologika - Teo Lachevhttps://prologika.com/wp-content/uploads/2016/01/logo.pngPrologika - Teo Lachev2018-01-28 16:40:152018-01-28 16:40:15Power BI Sharing Got a Bit Better 2
MS BI fans, join us for the next Atlanta MS BI and Power BI Group meeting on January 29th at 6:30 PM. Julie Smith will hack sweet reports in Power BI. Innovative Architects will sponsor the meeting. And your humble correspondent will show you two new cool Power BI features: integration with PowerApps and Q&A in Power BI Desktop. For more details, visit our group page.
Presentation:
H*ckin Sweet Reports with Power BI
Level: Intermediate
Date:
January 29, 2018
Time
6:30 – 8:30 PM ET
Place:
South Terraces Building (Auditorium Room) 115 Perimeter Center Place Atlanta, GA 30346
Overview:
Power BI is constantly evolving; this session is an overview of the current elements of Power BI and ways to implement them, based on experience in the field using it. Topics include the Power BI Service, Power BI Desktop, Power BI Embedded, Pricing models and some details of Power BI Premium. Sample data set used in this presentation is from @Dog_Rates on Twitter.
Speaker:
Julie Smith has spent close to 20 years moving data using varied tools such as MS Access, MySQL, and SQL Server versions 2000 and on. She is a Business Intelligence Consultant at Innovative Architects, where she has been implementing Power BI v2 and Azure solutions for the last couple of years.
Sponsor:
Since 2005, Innovative Architects has been serving industries to help solve business and technology challenges. We provide business consulting, development and implementation services for Microsoft platforms which include BizTalk, SharePoint, .NET, Business Intelligence, Mobile Apps and much more.
Prototypes with Pizza
“Power BI Writeback and Desktop Q&A” by Teo Lachev
https://prologika.com/wp-content/uploads/2016/01/logo.png00Prologika - Teo Lachevhttps://prologika.com/wp-content/uploads/2016/01/logo.pngPrologika - Teo Lachev2018-01-25 17:46:082021-02-17 01:01:16Atlanta MS BI and Power BI Group Meeting on January 29th
One Power BI aspect that I’m not crazy about is sharing. It’s my experience that most organization could benefit from a simplified sharing where users or groups are added to a workspace with different roles and permissions, such as Content Manager, Browser, Administrator. This could have worked conceptually like SSRS security. At some point, we could have nested workspaces and custom roles, such as a role that gives viewers permissions to rearrange tiles.
Alas, Power BI doesn’t support this security model. Instead, it supports dashboard sharing and apps. This can be confusing. For instance, if you have Power BI Premium, you might be tempted to add Power BI Free users to a workspace after you’ve heard that Power BI Premium lets you share content with free users. Unfortunately, adding Power BI Free users to a workspace accomplishes nothing and they will quickly discover this fact when they attempt to access the workspace content and get prompted to upgrade to Power BI Pro (workspaces are a Power BI Pro feature). Instead, you must share with free users using dashboard sharing or apps and both options have pros and cons. Another issue is that any Power BI user who is a member of the workspace can create apps, which can surely lead to chaos.
On the upside, apps shield users from content changes. You can change content in a workspace, but app recipients don’t see the changes unless you republish the app. In time, Microsoft might add features to apps to make them a more compelling choice for sharing.
For example, recently Microsoft added an “Included in App” toggle to reports and dashboards to let you exclude content from an app. Previously, publishing an app would publish all the content in a workspace, which presented another issue because not all workspace content could be suitable for sharing.
https://prologika.com/wp-content/uploads/2016/01/logo.png00Prologika - Teo Lachevhttps://prologika.com/wp-content/uploads/2016/01/logo.pngPrologika - Teo Lachev2018-01-20 19:46:482018-01-20 19:46:48Power BI Sharing Got a Bit Better
Natural queries (aka Q&A) has been a prominent feature since Power BI Service existed. Wouldn’t be nice to do the same in the Power BI Desktop? You can, but make sure to enable first Q&A from File, Options and Settings, Options (“Preview features”) tab because it’s currently a preview feature. Once you do this and restart Power BI Desktop, you should see “Ask A Question” button in the Home ribbon.
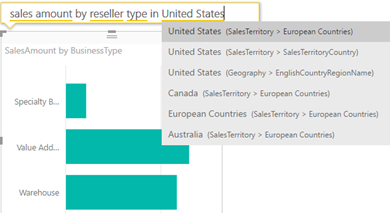
Sometimes the fastest way to get an answer from your data is to ask a question using natural language. For example, “what were total sales last year.” Use Power BI Q&A on the cloud or desktop to explore your data using intuitive, natural language capabilities and receive answers in the form of charts and graphs.
As of this time, Q&A requires data to be imported. It doesn’t work with DirectQuery connections. There are two ways to activate Q&A in Power BI Desktop:
Double-click an empty space anywhere on a page.
Click the “Ask A Question” button in the Home ribbon’s tab.
This adds an empty “Stacked Column Chart” visual and a Q&A area above it that prompts you to ask a question about your data. On the desktop, Q&A works the same way as in Power BI Service. As you type in your question, it guides you through the metadata fields and visualizes the data.
Once you’re done with the question, you can use the visual just like any other visuals. Unlike Power BI Service, once you deactivate the visual, such by clicking somewhere else on the page, the Q&A box disappears, and you can’t bring it back to see what question was asked.
https://prologika.com/wp-content/uploads/2016/01/logo.png00Prologika - Teo Lachevhttps://prologika.com/wp-content/uploads/2016/01/logo.pngPrologika - Teo Lachev2018-01-13 14:28:272018-01-13 14:28:27Q&A in Power BI Desktop
UPDATE: Microsoft has added support for multi-valued parameters in the DAX Query Designer. Please read the discussion thread below for more info. You can use the approach discussed in this article if you need more control over the parameter handling, but the Microsoft-provided way should suffice for most cases and it’s easier to implement.
Déjà vu today with a twist. SSRS multivalue parameters in SSAS reports but this time in DAX. Now that SSAS Designer supports DAX queries, we should be able to do everything we were able to do in MDX, right? Unfortunately, as you will quickly discover, Microsoft “forgot” about multivalue parameters when working on the DAX Designer.
You can use MDX (no shame there) and write queries the old way, but if you are a DAX purist, you’d need to take the road less traveled which goes through the DAX rabbit hole.
Here are the high-level steps in the SSDT Report Designer/Report Builder and I tried my best to simplify this as much as I can:
Do as much drag and drop using the DAX Graphical Query Designer to auto-generate the DAX query, as you won’t have another chance once you switch to a text mode. You can also use the graphical mode to declare your parameter(s) and to let SSRS autogenerate the report-level parameters and queries.
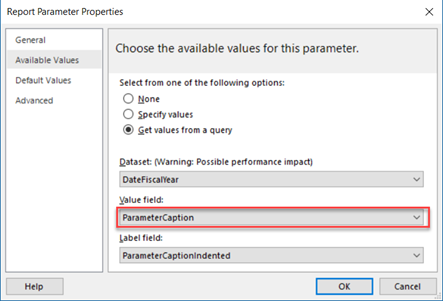
If you let the DAX Query Designer auto-generate the parameter queries, change the Available Values of the report-level parameters to use ParameterCaption field (not the ParameterValue column). If the parameter uses default values, change the Default Values tab to set the default values by captions (not using pipe-delimited format that the DAX Designer auto-generates). Again, that’s because we’d use the parameter caption.
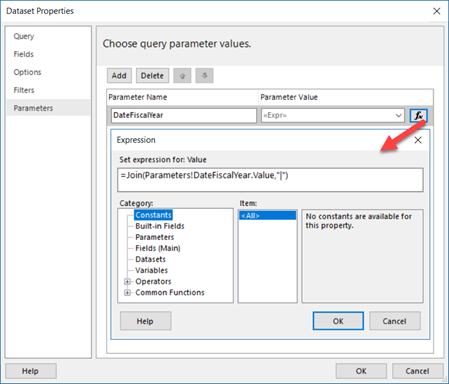
Go to the properties of the main dataset, flip to the Parameters tab and change the expression to concatenate the parameter values with a pipe “|”, such as =Join(Parameters!DateFiscalYear.Value,”|”). You’ll see why in a moment.
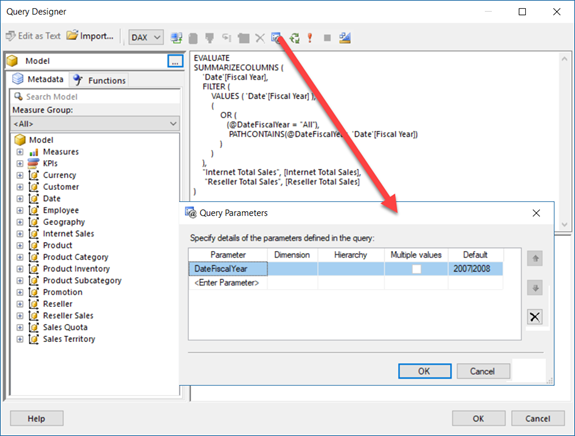
Now open the main DAX report query and switch to Text mode. Promise yourself never to go back to the Graphical mode (the one that lets you drag and drop). Click the Parameters button and reconfigure the parameter by selecting the empty value in the Dimension column. For testing the query inside the query designer, you might want to enter some pipe-delimited values in the Default column.
Change the main query to support multivalue parameters. The following query highlights the important changes:
EVALUATE SUMMARIZECOLUMNS ( ‘Date'[Fiscal Year], FILTER ( VALUES ( ‘Date'[Fiscal Year] ), ( OR ( ( @DateFiscalYear = “All” ), PATHCONTAINS ( @DateFiscalYear, ‘Date'[Fiscal Year] ) ) ) ), “Internet Total Sales”, [Internet Total Sales], “Reseller Total Sales”, [Reseller Total Sales] )
I removed the variable (VAR) definitions (not needed after simplifying the query). The filter expression uses an OR condition. If the user selects the parameter “All” value, then all rows are returned. If specific values are selected, the PATHCONTAINS function would return TRUE for that row in the filtered column (‘Date'[Fiscal Year] in this case) that matches one of the selected values. If you have more parameters, simply add more FILTER clauses.