I’m conducting an assessment for a client facing memory pressure in Power BI Premium. You know these pesky out of memory issues when refreshing a biggish dataset. They started with P1, moved to P2, and now are on P3 but still more memory is needed. The runtime memory footprint of the problematic semantic model with imported data is 45 GB and they’ve done their best to optimize it.
Since its beginning, Power BI Pro per-user licensing (and later Premium Per User (PPU) licensing) has been very attractive. Many organizations with a limited number of report users flocked to Power BI to save cost. However, organizations with more BI consumers gravitated toward premium licensing where they could have unlimited number of report readers against a fixed monthly fee starting at listed price of $5,000/mo for P1. Sounds like a great deal, right?
I must admit that I detest the premium licensing model because it boxes into certain resource constraints, such as 8 backend cores and 25 GB RAM for P1. There are no custom configurations to let you balance between compute and memory needs. And while there is an auto-scale compute model, it’s very coarse. The memory constraints are especially problematic given that that imported models are memory resident and require more than twice the memory for full refresh. From the outside, these memory constraints seem artificially low to force clients into perpetual upgrades. The new Fabric F capacities that supersede the P plans are even more expensive, justifying the price increase with the added flexibility to pause the capacity which is often impractical.
It looks to me that the premium licensing is pretty good deal for Microsoft. Outgrown 25 GB of RAM in P1? Time to shelve another 5K per month for 25 GB more even if you don’t need more compute power. Meanwhile, the price of 32GB of RAM is less than $100 and falling.
So, what should you do if you are strapped for cash? Consider evaluating and adopting one or more of the following techniques, including:
Switching to PPU licensing with a limited number of report users. PPU is equivalent of P3 and grants 100GB RAM per dataset.
Optimizing aggressively the model storage when possible, such as removing high-cardinality columns
Configuring aggressive incremental refresh policies with polling expressions
Moving large fact tables to a separate semantic model (remember that the memory constraints are per dataset and not across all the datasets in the capacity)
Implementing DirectQuery features, such as composite models and hybrid tables
Switching to a hybrid architecture with on-prem semantic model(s) hosted in SQL Server Analysis Services where you can control the hardware configuration and you’re not charge for more memory.
Lobbying Microsoft for much larger memory limits or to bring your own memory 🙂
It will be great if at some point Power BI introduces customized capacities. Even better, how about auto-scaling where the capacity resources scale up and down on demand within minutes, such as adding more memory during refresh and reducing the memory when the refresh is over?
https://prologika.com/wp-content/uploads/2016/01/logo.png00Prologika - Teo Lachevhttps://prologika.com/wp-content/uploads/2016/01/logo.pngPrologika - Teo Lachev2024-08-03 16:41:072024-08-03 16:41:07Power BI and Fabric Capacities: Thinking Outside the Box
Atlanta BI fans, please join us in person for the next meeting on Monday, August 5th at 6:30 PM ET. Elayne Jones and Matt Kim (Solutions Architects at Coca-Cola) will show us how to bring Azure DevOps data to life by creating data models and interactive reports in Power BI. Your humble correspondent will help you catch up on Microsoft BI latest. CloudStaff.ai will sponsor the event. For more details and sign up, visit our group page.
Details
Presentation: Elevate Program Management with Power BI & DevOps Delivery: In-person Date: August 5, 2024 Time: 18:30 – 20:30 ET Level: Intermediate Food: Pizza and drinks will be provided
Agenda:
18:15-18:30 Registration and networking
18:30-19:00 Organizer and sponsor time (events, Power BI latest, sponsor marketing)
19:00-20:15 Main presentation
20:15-20:30 Q&A
Venue
Improving Office
11675 Rainwater Dr
Suite #100
Alpharetta, GA 30009
Overview: Have you ever opened Azure DevOps and felt overwhelmed by the vast sea of program management options? In large organizations, tracking progress across disparate projects and work items can be challenging. In this session, find out how to bring Azure DevOps data to life by creating data models and interactive reports in Power BI. Sleek Power BI visuals make even the most technical DevOps content both accessible to executives and actionable for project managers.
Speaker: Elayne Jones and Matt Kim are both Solutions Architects at Coca-Cola Bottlers Sales and Services. Elayne and Matt specialize in developing solutions that drive efficiency within organizations by utilizing the full set of Power Platform technologies. Elayne and Matt work together on a team focusing on designing and implementing automated solutions to enhance both internal and external stakeholders’ user experiences and to enforce consistency in reporting data.
Sponsor: Cloudstaff.ai
https://prologika.com/wp-content/uploads/2016/01/logo.png00Prologika - Teo Lachevhttps://prologika.com/wp-content/uploads/2016/01/logo.pngPrologika - Teo Lachev2024-07-30 20:37:282024-07-30 20:37:28Atlanta Microsoft BI Group Meeting on August 5th (Elevate Program Management with Power BI & DevOps)
This post summarizes my research around the increasingly popular RAG apps, and it’s meant more as an internal memo to myself to summarize existing findings should one day a suitable project comes along. However, someone starting with RAG development might find this useful (we are all LLM rookies). RAG is a fascinating topic and presents another great case for generative AI in data analytics.
RAG (retrieval-augmented generation) apps apply AI to let end users intelligently search data, such as PDF or Word documents, using natural questions. The most common scenario is for searching internal data because public LLM models don’t have access to your corporate data repositories and therefore know nothing about your data.
Suppose your HR department has accumulated a large knowledge base of files detailing internal policies, such as health plans. Using a home-grown RAG app, the user can type natural questions, such as “Which plan supports vision?” and the RAG application should retrieve and rank related documents. Or a law firm might have documents related to matters and be interested in letting internal users ask natural questions to find the details of a specific case. As you can imagine, many companies can benefit from RAG <insert your company smart search needs here>.
Understanding RAG
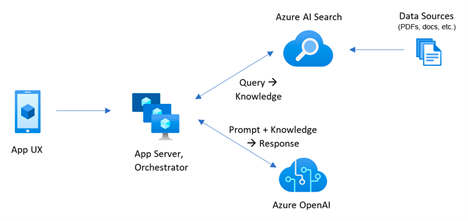
Here is a typical high-level RAG architecture:
The user uses some sort of UI, such as a web portal, to submit the natural question. The app backend gets the question and submits it to a search service (Retrieval), such as Azure AI Search. Previously, you have configured Azure AI Search to create an index (knowledge base) by indexing the data found in files or popular databases. The following Azure AI Search features should be strongly considered (ideally, both should be implemented):
Embedding vectors – As a part of indexing the data, each text chunk should have an embedding vector, such as a vector produced by Azure OpenAI LLM embedding model. This allow Azure AI Search to find related documents when related terms are used in the question, such as “vision exam” and “eye exam”, but the underlying documents don’t contain these exact terms.
Semantic ranking – Once the related documents are identified, Azure AI Search can apply ranking to sort the related documents in descending order of relevance using an optional feature called Semantic Ranker.
Processing more complicated data can be done with Azure Document Intelligence Service (previously Form Recognizer). It’s capable of extracting data from more complicated structured files, such as invoices, medical forms, etc.
Once Azure AI Search returns the related text sections, the natural question and text are then sent to Azure OpenAI (Augmentation) which does the magic of parsing the semantics of the user input and describing the output in natural language typical to LLM-powered chat apps (Generative AI), such as “The plan A has coverage for vision”.
Further reading and code samples
A good starting point to learn about LLM in general and RAG is the Generative AI for Beginners free training (kudos to Kevin Jourdain for the hint). You can find more implementation-specific and in-depth RAG knowledge especially for Azure-based implementations in the excellent Pamela Fox’s YouTube Channel, such as the “Vector search, RAG, and Azure AI search” presentation.
Microsoft has also provided a code intensive end-to-end Python app. This app uses custom code for extracting the text using the Azure Document Intelligence Service, chunking the text, generating embeddings, integrating with Azure AI Search and Azure Open AI, and implementing a web app for the user interface.
An easier code to start with is the AG Academy’s Python sample. It uses custom code for chunking the text (either using the Python PDFReader library or Microsoft Document Intelligence service), and then integrating with Azure AI Search and Azure OpenAI.
Observations
Naturally, given that my developer skills are somewhat rusty (long live low-code BI solutions!), I’m inclined to find a low(er)-code approach that saves development effort. It looks like Microsoft is reasoning along the same lines as they’ve came up with the Azure AI Search Import and Vectorize Wizard (currently in preview). Based on my research, this wizard can avoid tons of custom code to:
Extract and chunk text.
Process documents of different types stored in the same folder (for some reason the files must be in ADLS Gen 1 or Fabric One Lake, since ADLS Gen 2 hierarchical folders are not supported).
Generate embedding vectors by integrating with Azure OpenAI embedding model, such as text-embedding-ada-002.
Refresh the index on schedule.
You still must write code for the user interface and integrating with Azure AI Search and Azure OpenAI. I’d love to see Microsoft enhancing the wizard to integrate further with Azure OpenAI text-based models in order to avoid the current two-step process that requires custom code for getting the results from Azure Search and them sending them to Azure OpenAI.
In my previous post, I covered how large language models, such as ChatGPT, can be used to convert natural queries to SQL. Let’s now see how Text2DAX fairs. But wait, we have a Microsoft Fabric copilot already for this, right? Yes, but what happens when you click the magic button in PBI Desktop? You are greeted that you need to purchase F64 or larger capacity. It’s a shame that Microsoft has decided that AI should be a super premium feature. Given this horrible predicament, what would a mortal developer strapped for cash do? Create their own copilot of course!
Building upon the previous sample, this is remarkably simple. As I mentioned in the first blog, one great LLM feature is the loose input. To make the schema generation simple, I obtained the table and column names from the Adventure Works semantic model (a *.pbix file opened in PBI Desktop) by running the following query in DAX Studio:
select Table_Name as TableName, Column_Name as ColumnName
from $SYSTEM.DBSCHEMA_COLUMNS
where column_olap_type = 'attribute' and table_name <>'$MySelectedMeasure' and table_name <> '$Parameter' and table_name <> '$DynamicMeasure'
order by table_name
This gave me the model schema in a two-column format (I had to remove the $ in front of the table name which is a relic from OLAP days where dimension names were prefixed with $). Also, notice that I haven’t included model relationships yet.
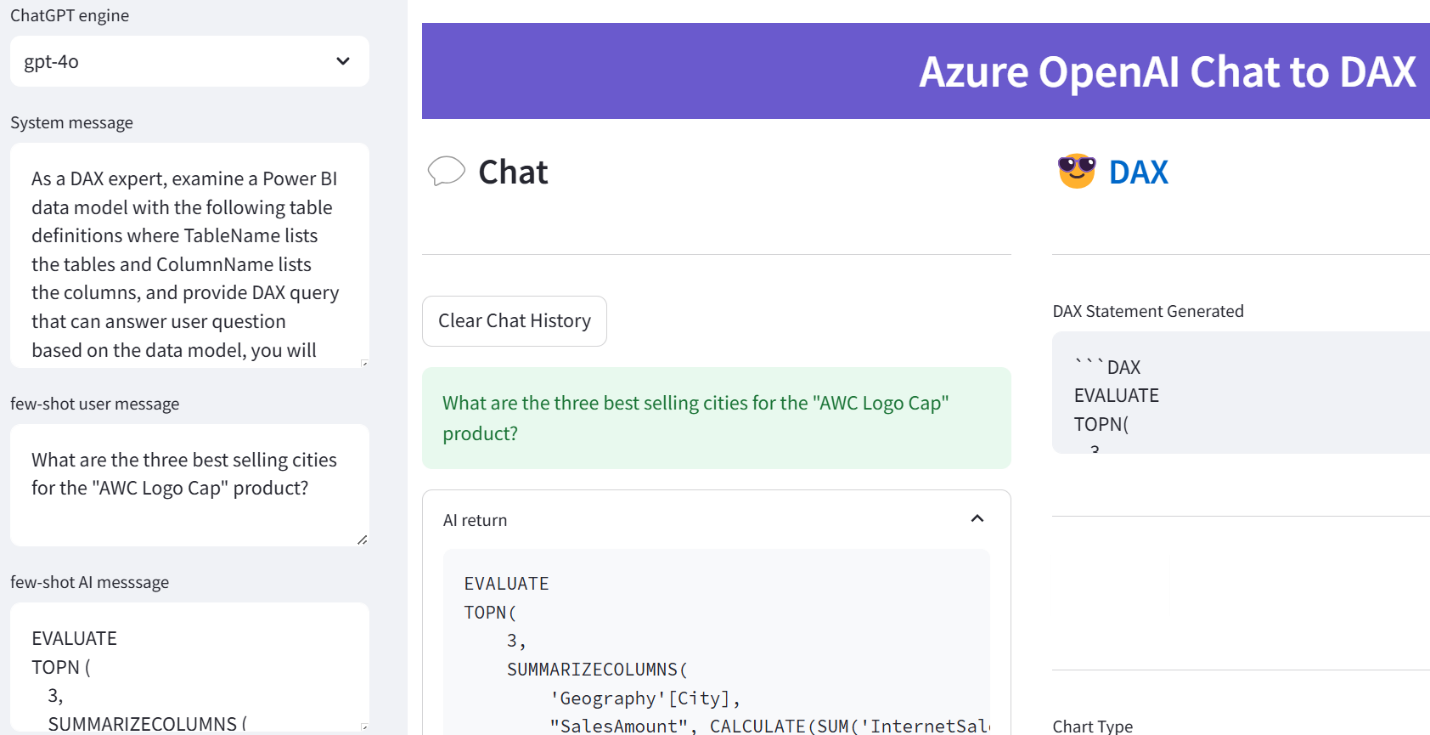
As a DAX expert, examine a Power BI data model with the following table definitions where TableName lists the tables and ColumnName lists the columns, and provide DAX query that can answer user questions based on the data model, you will think step by step throughout and return DAX statement directly without any additional explanation.
As with Text2SQL, I used a user role prompt to feed a natural question “What are the three best selling cities for the “AWC Logo Cap” product?” followed by an assistant role prompt containing the expected DAX query (noticed that I’ve made a mistake by not using a SUM function to summarize the SalesAmount column):
EVALUATE
TOPN (
3,
SUMMARIZECOLUMNS (
'DimGeography'[City],
"SalesAmount", CALCULATE('FactInternetSales'[SalesAmount], 'DimProduct'[EnglishProductName] = "AWC Logo Cap")
)
)
ORDER BY [SalesAmount] DESC
Then I started asking questions and my amazement grew as the complexity increased. Here are some samples:
What are the three best selling cities for the “AWC Logo Cap” product?
EVALUATE
TOPN (
3,
SUMMARIZECOLUMNS (
'Geography'[City],
"SalesAmount",
CALCULATE (
SUM('InternetSales'[SalesAmount]), -- notice that LLM fixed my syntax error
'Product'[ProductName] = "AWC Logo Cap"
)
),
[SalesAmount], DESC)
What was YTD sales variance for 2012 compared to last year?
— Here LLM switch to a measure definition
VAR CurrentYearSales =
CALCULATE (
SUM('InternetSales'[SalesAmount]),
'Date'[CalendarYear] = 2012,
DATESYTD('Date'[Date])
)
VAR PreviousYearSales =
CALCULATE (
SUM('InternetSales'[SalesAmount]),
'Date'[CalendarYear] = 2011,
DATESYTD('Date'[Date])
)
VAR SalesVariance = CurrentYearSales - PreviousYearSales
RETURN SalesVariance
What was the customer churn in 2012?
Now, this is impressive! To start with, LLM had to discover what a “churn” is and to figure out that it needs a date context. At its first attempt, it created an incorrect measure because the Date dimension doesn’t relate to the Customer dimension.
Relationships are important concept in Power BI semantic modeling, and they are both a blessing and a curse. Thanks to these explicit paths, the end user doesn’t need how to join tables. But they also introduce rigidity and are subject of various limitations, such as that Power BI doesn’t support diamond or closed loop relationships (interestingly, at some point Microsoft was planning to implement UI to prompt the user which path to take but this never materialized.
Let’s now tell the model about the relationships. I added the following after the Table Definitions section to enumerate a few of the model relationships.
Now running the previous query, we get a much better outcome because the measure now evaluates over the InternetSales table. It would have blown my mind if it had used CustomerID (business key) instead of CustomerKey (surrogate key) 😊
In summary, it appears that LLM can effectively assist us in writing code. The emphasis is on assist because I view the LLM role as a second set of eyes. Hey, what do you think about this problem I’m trying to solve here? LLM doesn’t absolve us from doing our homework and learning the fundamentals, nor it can compensate for improper design. While LLM might not always generate the optimum code and might sometimes fabricate, it can definitely assist you in creating business calculations, generating test queries, and learning along the way.
BTW, you can use any of the publicly available LLM apps, such as Copilot, ChatGPT, Google Gemini or Perplexity (you don’t need the sample app I’ve demonstrated) for Text2SQL and Text2DAX and probably you would obtain similar results if you give it the right prompts. I used this app because I was interested in automating the process.
As inspired by Kevin Jordain, who clued me about the increased demand for using natural questions to analyze client’s data, John Kerski, who did a great presentation to our Atlanta BI Group on integrating Power Query with Azure OpenID, and Kyle Hale, who believes (wrongly 😊) that the Databricks Genie will make Power BI and semantic modeling obsolete, I set on a quest to find how effective Large Language Models (LLM) are in generating SQL from natural questions, also known as Text2SQL. What a better way to spend some free time around the 4th of July holiday, right?
I have to say that I was impressed with LLM. I used the excellent Ric Zhou’s Text2SQL sample as a starting point inside Visual Studio Code. The sample uses the Python streamlit framework to create a web app that submits natural questions to Azure OpenAI.
My humble contributions were:
I switched to the Azure OpenAI chatgpt-4o model.
Because the Python openai module has deprecated ChatCompletion, I transitioned the code to use the new way of interacting, as I explained in the related GitHub issue.
I used the AdventureWorksDW2019 database which I deployed to Azure SQL Database.
I was amazed how simple the LLM input was. Given that it’s trained with many popular languages, including SQL, all you have to do is provide some context, database schema (generated in a simple format by a provided tool), and a few prompts:
[{'role': 'system', 'content': 'You are smart SQL expert who can do text to SQL, following is the Azure SQL database data model <database schema>},
{'role': 'user', 'content': 'What are the three best selling cities for the "AWC Logo Cap" product?'},
{'role': 'assistant', 'content': 'SELECT TOP 3 A.City, sum(SOD.LineTotal) AS TotalSales \\nFROM [SalesLT].[SalesOrderDe...BY A.City \\nORDER BY TotalSales DESC; \\n'},
{'role': 'user', 'content': natural question here'}]
Let’s decipher this:
The first prompt provides context to the model for our intention to act as a SQL expert.
The sample includes a tool that generates the database schema consisting of table and columns in the following format below. Noticed that referential integrity constraints are not included (the model doesn’t need to know how the tables are related!) There is nothing special in the syntax. It is fluid (impressive!), which is a paradigm shift from structured XML or JSON where missing a bracket crashes the system. So, I could have expressed the schema using the following notation and it would still work (ideally, we should also provide the column data types):
Table: FactSalesQuota
– SalesQuotaKey
– other columns
or
Table: FactSalesQuota
Columns: column1, column2
The next prompt assumes the role of an end user who will ask a natural question, such as ‘What are the three best selling cities for the “AWC Logo Cap” product?’
The next prompt assumes the role of an assistant who hints the model what the correct query should be.
The final prompt acts as a user who now provides what natural question you enter.
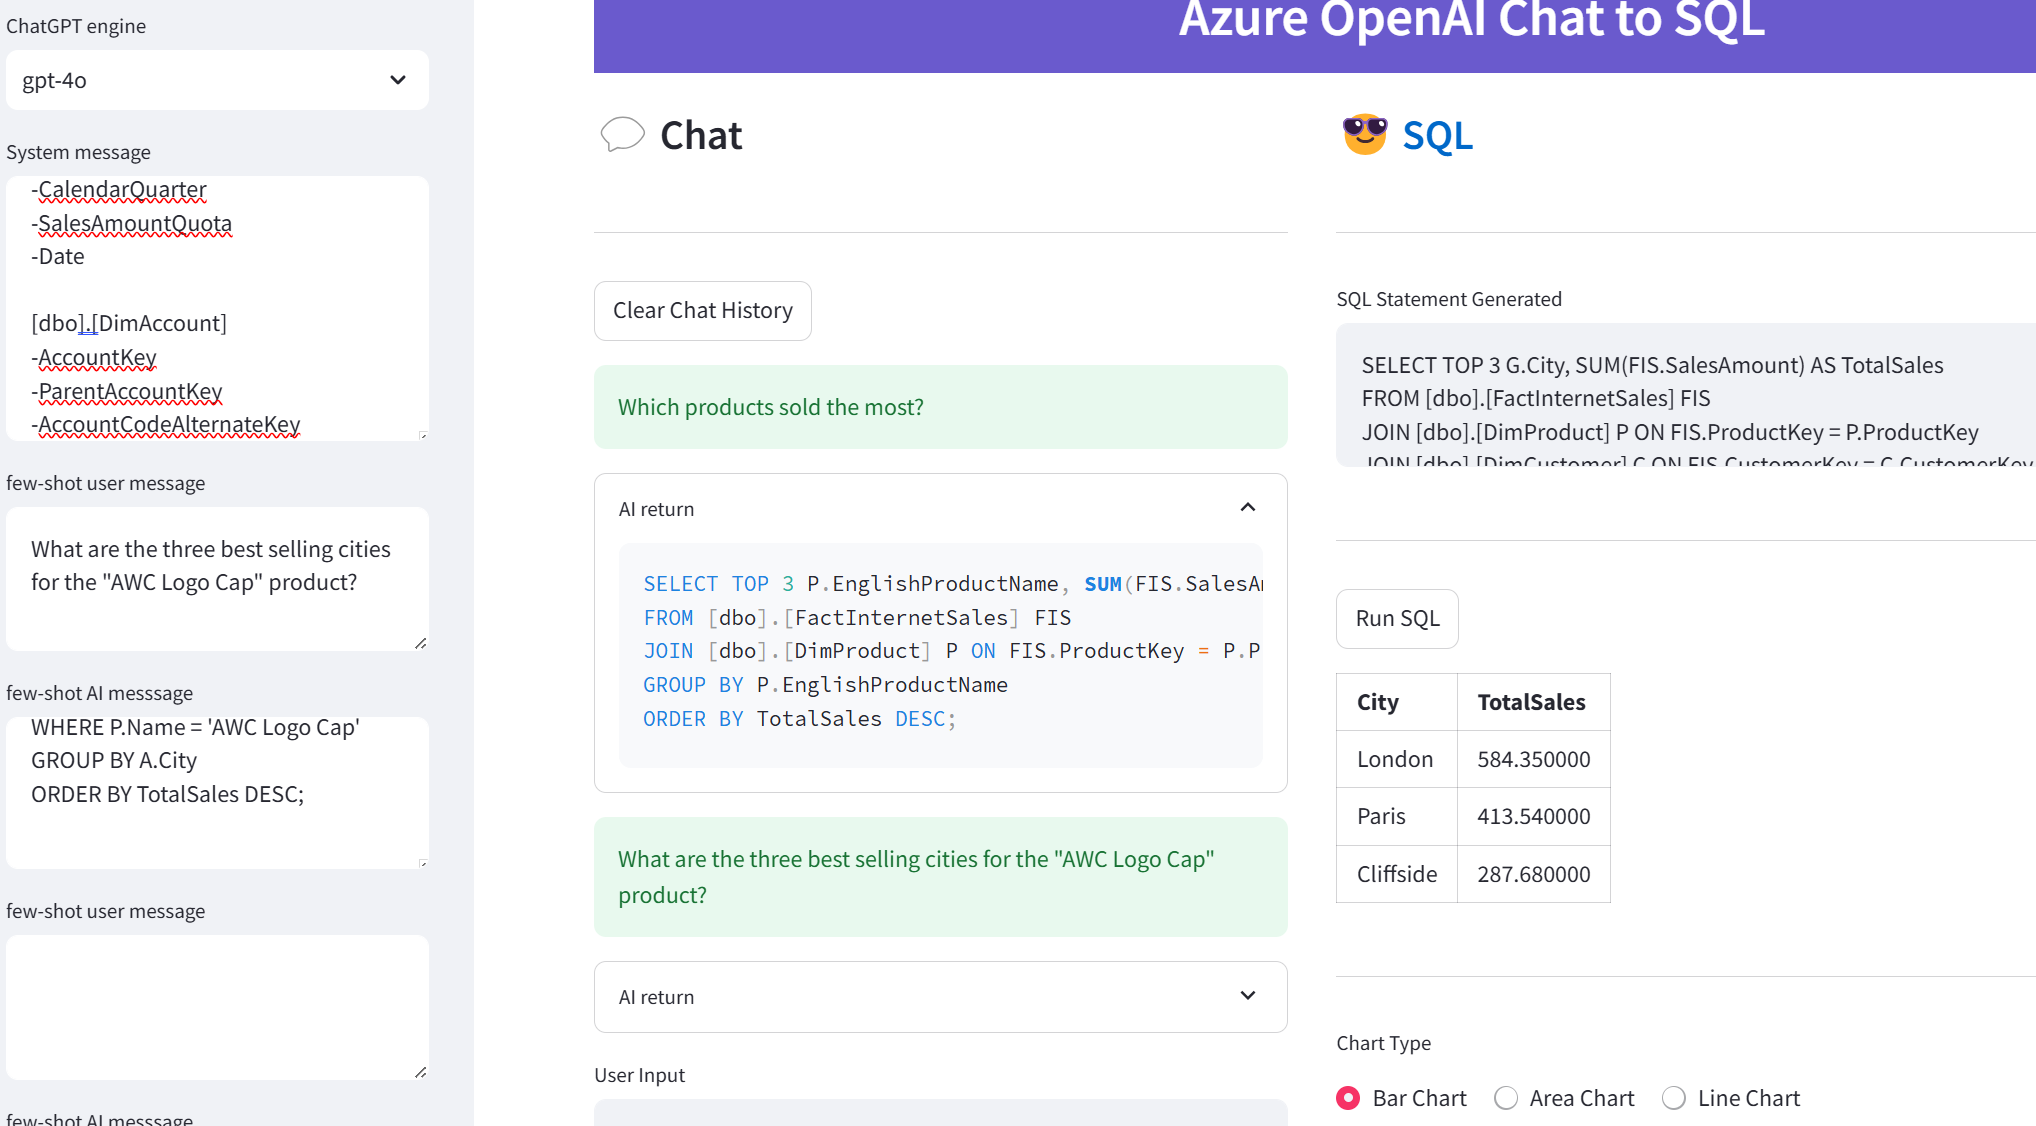
The sample also supports running the query against the database and visualizing the results as a table, bar chart, area chart, or line chart. Here are some results
What are the three best selling cities for the “AWC Logo Cap” product?
SELECT TOP 3 G.City, SUM(FIS.SalesAmount) AS TotalSales
FROM [dbo].[FactInternetSales] FIS
JOIN [dbo].[DimProduct] P ON FIS.ProductKey = P.ProductKey
JOIN [dbo].[DimCustomer] C ON FIS.CustomerKey = C.CustomerKey
JOIN [dbo].[DimGeography] G ON C.GeographyKey = G.GeographyKey
WHERE P.EnglishProductName = 'AWC Logo Cap'
GROUP BY G.City
ORDER BY TotalSales DESC;
Which products sold the most?
SELECT P.EnglishProductName, SUM(FIS.SalesAmount) AS TotalSales
FROM [dbo].[FactInternetSales] FIS
JOIN [dbo].[DimProduct] P ON FIS.ProductKey = P.ProductKey
GROUP BY P.EnglishProductName
ORDER BY TotalSales DESC;
Which customers bought something in 2012 but didn’t buy anything in 2011?
SELECT DISTINCT C.CustomerKey, C.FirstName, C.LastName
FROM [dbo].[FactInternetSales] FIS2012
JOIN [dbo].[DimCustomer] C ON FIS2012.CustomerKey = C.CustomerKey
WHERE FIS2012.OrderDateKey BETWEEN 20120101 AND 20121231
AND C.CustomerKey NOT IN (
SELECT DISTINCT FIS2011.CustomerKey
FROM [dbo].[FactInternetSales] FIS2011
WHERE FIS2011.OrderDateKey BETWEEN 20110101 AND 20111231);
All SQL statements were syntactically and logically correct. Pretty amazing, right? Especially considering that the model had to figure out how the tables related, such as that DimCustomer is related to FactInternetSales but not to FactResellerSales.
In summary, it appears that LLM can be used effectively for generating SQL from natural text. This is opening new possibilities for ad hoc data analytics and for assisting users with learning or generating code. I believe that simplified schema is very important, such as star schema. This underscores the importance of schema design for data analytics, something that AI can’t do (yet).
What about Text2DAX? Can LLM do it? You bet! DAX happens to be one of the programming languages used for training, so stay tuned for the next blog post where I’ll present you with a poor man’s DAX copilot.
Atlanta BI fans, please join us in person for the next meeting on Monday, July 1st at 6:30 PM ET. John Kerski (Microsoft MVP) will shows us how to integrate ChatGPT with Power BI. Your humble correspondent will help you catch up on Microsoft BI latest. CloudStaff.ai will sponsor the event. For more details and sign up, visit our group page.
Details
Presentation: Commenting Power Query with Azure OpenAI Delivery: In-person Date: July 1, 2024 Time: 18:30 – 20:30 ET Level: Intermediate Food: Pizza and drinks will be provided
Agenda:
18:15-18:30 Registration and networking
18:30-19:00 Organizer and sponsor time (events, Power BI latest, sponsor marketing)
19:00-20:15 Main presentation
20:15-20:30 Q&A
Venue
Improving Office
11675 Rainwater Dr
Suite #100
Alpharetta, GA 30009
Overview: Large Language Models (such as ChatGPT) can greatly enhance the way you develop and deliver Power BI solutions. In this session I will show you how to integrate Azure Open AI into Power BI using prompt engineering techniques.
Speaker: John Kerski has over a decade of experience in technical and government leadership. He specializes in managing Data Analytics projects and implementing DataOps principles to enhance solution delivery and minimize errors. John’s expertise is showcased through his ability to offer patterns and templates that streamline the adoption of DataOps with Microsoft Fabric and Power BI. His in-depth knowledge and hands-on approach provide clients with practical tools to achieve efficient and effective data operations.
Sponsor: CloudStaff.ai
https://prologika.com/wp-content/uploads/2016/01/logo.png00Prologika - Teo Lachevhttps://prologika.com/wp-content/uploads/2016/01/logo.pngPrologika - Teo Lachev2024-06-25 11:14:362024-06-25 11:14:36Atlanta Microsoft BI Group Meeting on July 1st (Commenting Power Query with Azure OpenAI)
Just passed DP-600 and therefore I’m officially a Fabric Analytics Engineer. Besides renewals, I intend this to be my last Microsoft certification. After more than 30 years of certifying (12 certifications and 30 exams) and helping other certify with training and books, I think it’s time to close this chapter. Call me certifiable…
“Where are the prophets, where are the visionaries, where are the poets To breach the dawn of the sentimental mercenary” “Fugazi”, Marillion
I’ve written in the past about the dangers of blindly following “modern” data architectures (see my posts “Are you modern yet?” and “Data Lakehouse: The Good, the Bad, and the Ugly”) but here we go again. Once upon a time, a large company hired a large Microsoft partner to solve a common and pervasive challenge. Left on their own, departments have set up their own data servers, thus creating data silos leading to data duplication and inconsistent results.
How did the large vendor attempt to solve these horrible issues? Modern Data Warehouse (MDM) architecture of course. Nothing wrong with it except that EDW and organizational semantic model(s) are missing and that most of the effort went into implementing the data lake medallion architecture where all the incoming data ended up staged as Parquet files. It didn’t matter that 99% of the data came from relational databases. Further, to solve a data change tracking requirement, the vendor decided to create a new file each time ETL runs. So even if nothing has changed in the source feed, the data is duplicated should one day the user wants to go back in time and see what the data looked like then. There are of course better ways to handle this that doesn’t even require ETL, such as SQL Server temporal tables, but I digress.
At least some cool heads prevailed and the Silver layer got implemented as a relational ODS to serve the needs of home-grown applications, so the apps didn’t have to deal with files. What about EDW and organizational semantic models? Not there because the project ran out of budget and time. I bet if that vendor got hired today, they would have gone straight for Fabric Lakehouse and Fabric premium pricing (nowadays Microsoft treats partners as an extension to its salesforce and requires them to meet certain revenue targets as I explain in “Dissolving Partnerships“), which alone would have produced the same outcome.
What did the vendor accomplish? Not much. Nor only didn’t the implementation address the main challenges, but it introduced new, such as overcomplicated ETL and redundant data staging. Although there might be good reasons for file staging (see the second blog above), in most cases I consider it a lunacy to stage perfect relational data to files, along the way losing metadata, complicating ETL, ending up serverless, and then reloading the same data into a relational database (ODS in this case).
I’ve heard that the vendor justified the lake effort by empowering data scientists to do ML one day. I’d argue that if that day ever comes, the likelihood (pun not intended) of data scientists working directly on the source schema would be infinitely small since more than likely they would require the input datasets to be shaped in a different way which would probably require another ETL pipeline altogether.
I don’t subject my clients to excessive file staging. My file staging litmus test is what’s the source data format. If I can connect to a server and get in a tabular (relational) format, I stage it directly to a relational database (ODS or DW). However, if it’s provided as files (downloaded or pushed, reference data, or unstructured data), then obviously there is no other way. That’s why we have lakes.
Fast forward a few years, and your humble correspondent got hired to assess the damage and come up with remediation. Data lakes won’t do it. Lakehouses and Delta Parquet (a poor attempt to recreate and replace relational databases) won’t do it. Fabric won’t do it and it’s too bad that Microsoft pushes Lakehouse while the main focus should be Fabric Data Warehouse, which unfortunately is not ready for prime time (but we have plenty of other options).
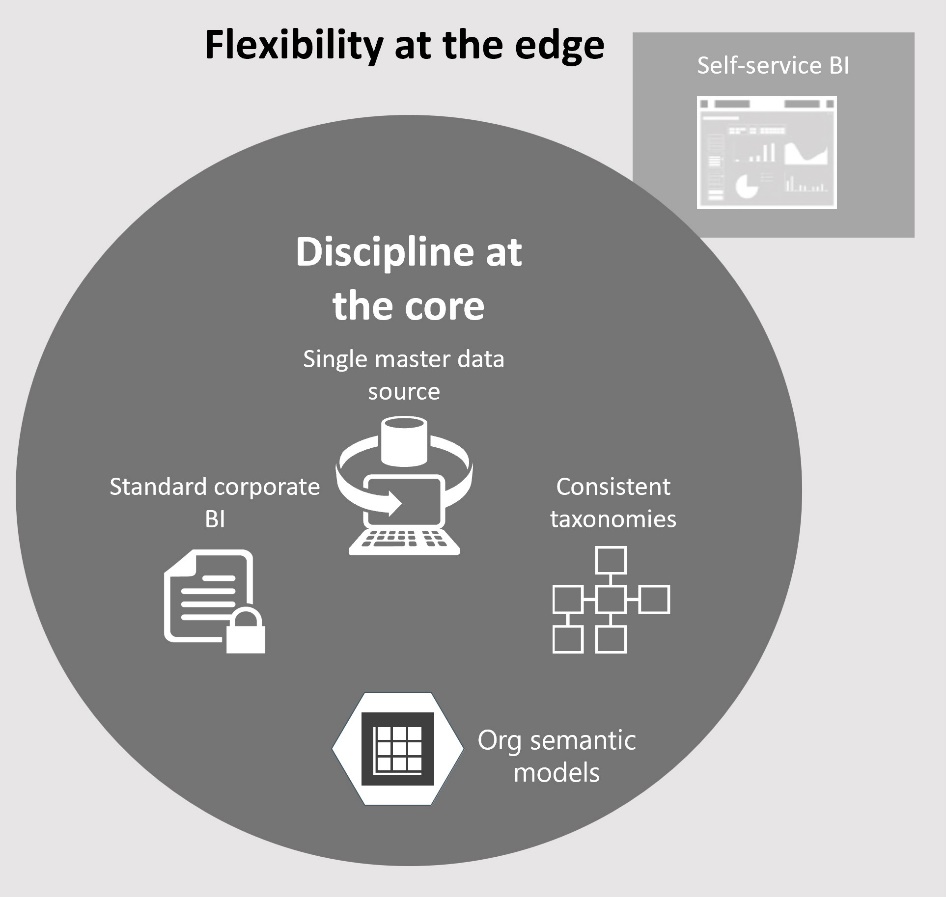
What will do it? Going back to the basics and embracing the “Discipline at the core, flexibility at edge” ideology (kudos to Microsoft for publishing their lessons learned). From a technology standpoint, the critical pieces are EDW and organizational semantic models. If you don’t have these, I’m sorry but you are not modern yet. In fact, you aren’t even classic, considering that they have been around for long, long time.
So, keep on implementing these medallion lakes to keep my consulting pipeline full. Drop a comment how they work for you.
Atlanta BI fans, please join us in person for the next meeting on Monday, June 3rd at 6:30 PM ET. Shabnam Watson (Consultant and Owner of ABI Cube) will discuss the benefits of using the Direct Lake storage mode in Microsoft Fabric. Your humble correspondent will help you catch up on Microsoft BI latest. CloudStaff.ai will sponsor the event. For more details and sign up, visit our group page.
Presentation: Power BI Direct Lake storage mode: How to achieve blazing fast performance without importing data Delivery: In-person Time: 18:30 – 20:30 ET Level: Beginner/Intermediate Food: Pizza and drinks will be provided
Agenda:
18:15-18:30 Registration and networking
18:30-19:00 Organizer and sponsor time (events, Power BI latest, sponsor marketing)
19:00-20:15 Main presentation
20:15-20:30 Q&A
Venue
Improving Office
11675 Rainwater Dr
Suite #100
Alpharetta, GA 30009
Overview: Power BI engine in Microsoft Fabric has been significantly revamped to work directly with Delta files in OneLake. This brand-new storage mode is called Direct Lake which allows Power BI to achieve super-fast query performance on billion row datasets without having to import the data into Power BI. Join this session to learn how you can work with Direct Lake with just a few clicks.
Speaker: Shabnam is a business intelligence consultant and owner of ABI Cube, a company that specializes in delivering data solutions using the Microsoft Data Platform. She has over 20 years of experience and is recognized as a Microsoft Data Platform MVP for her technical excellence and community involvement. She is passionate about helping organizations harness the power of data to drive insights and innovation. She has a deep expertise in Microsoft Analysis Services, Power BI, Azure Synapse Analytics, and Microsoft Fabric. She is also a speaker, blogger, and organizer for SQL Saturday Atlanta – BI version, where she shares her knowledge and best practices with the data community.
Sponsor: CloudStaff.ai
https://prologika.com/wp-content/uploads/2016/01/logo.png00Prologika - Teo Lachevhttps://prologika.com/wp-content/uploads/2016/01/logo.pngPrologika - Teo Lachev2024-05-28 11:53:322024-05-28 11:54:16Atlanta Microsoft BI Group Meeting on June 3rd (Power BI Direct Lake storage mode)
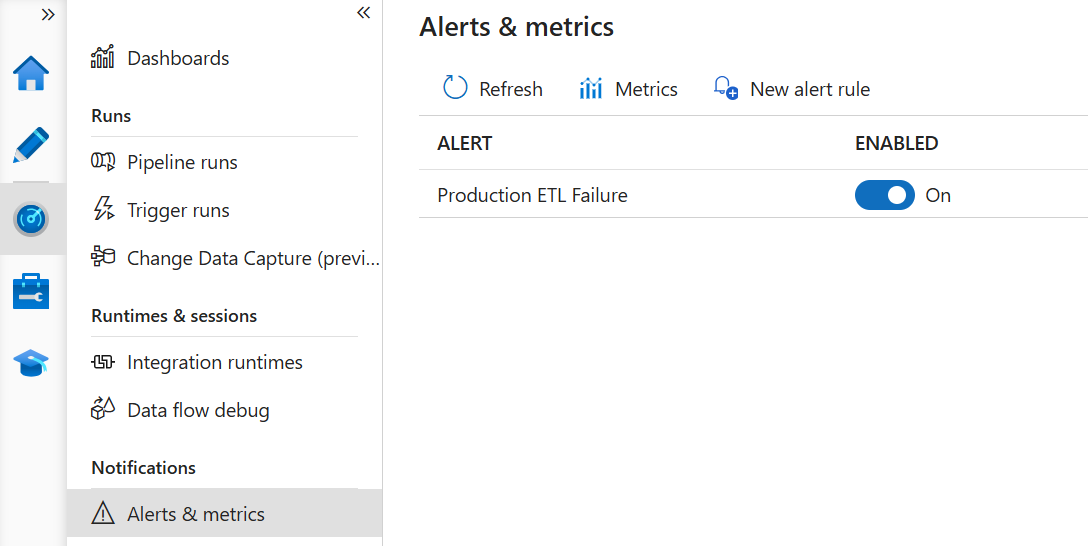
Alerting is an important monitoring task for any ETL process. Azure Data Factory can integrate with a generic Azure event framework (Azure Monitor) which makes it somewhat unintuitive for ETL monitoring. You can set up and change the alerts using the ADF Monitoring hub.
You might find the following tips useful for setting up an ADF alert:
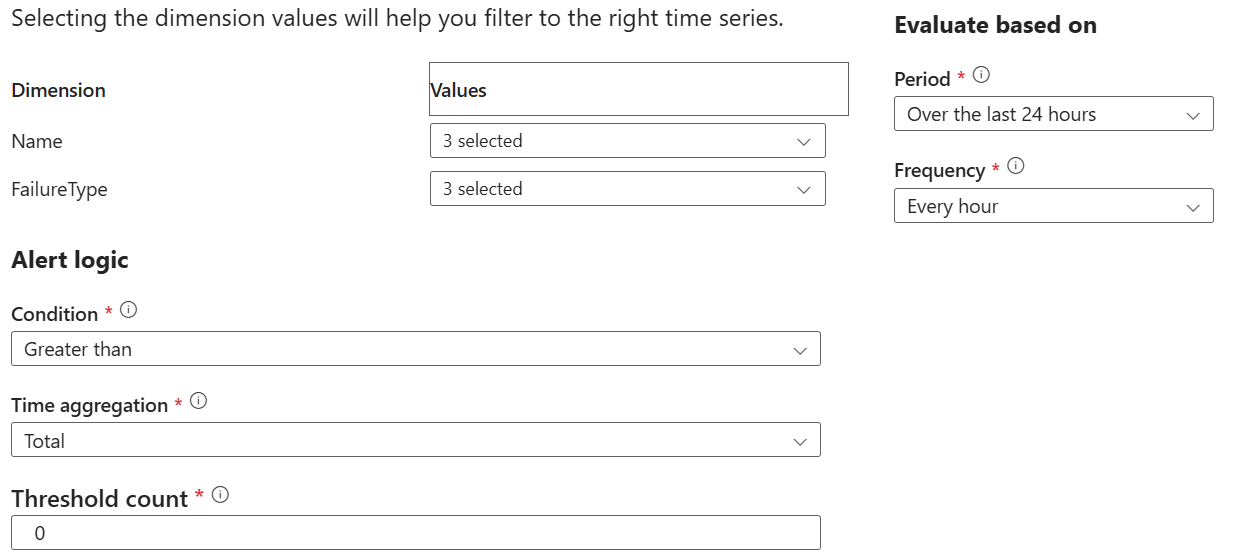
Dimension – I like to nest pipelines where a master pipeline starts dimension and fact master pipelines, which in turn execute unit pipelines, such as a loading a dimension table. This allows me to restart ETL at any level. In the Dimension dropdown (nothing to do with DW dimensions), I select all such master pipelines because if an error is triggered downstream, it will bubble up to the master.
Failure Type – I select all failure types.
Condition – I configure the alert to be generated as soon as one failure occurs.
Period – This is a tricky one. It specifies over what period the threshold failure count will be evaluated. Let’s say you schedule the ETL process nightly at 12 AM. If you specify a value lower than 24 hours, let’s say 6 hours, Azure Monitor will check for failures every 6 hours. If ETL fails at say 12:15 AM, you will get the alert the next time Azure Monitor runs as you should. But then, after it checks in another 6 hours and finds no failure, it will send a notification that the failure is resolved, while probably it’s not. Therefore, I set the period to 24 hours. Obviously, this will be an issue if ETL runs weekly but 24 hours is the longest period supported.
Frequency – I set this to the longest frequency of 1 hour as it doesn’t make sense to check frequently for failures if the process runs once in a day. With this setup, the threshold count will be evaluated every hour for each 24-hour cycle.
https://prologika.com/wp-content/uploads/2016/01/logo.png00Prologika - Teo Lachevhttps://prologika.com/wp-content/uploads/2016/01/logo.pngPrologika - Teo Lachev2024-04-15 17:32:062024-04-15 17:36:46Tips for Configuring Azure Data Factory Alerts