Notes on Fabric F2 Performance: Report Load
What a better way to spend a lazy holiday afternoon than to do more Fabric performance testing? In my previous post, I shared my results from a single-threaded ETL load test to gauge the F2 ingest performance and F2 did pretty well (or at least outperformed Azure SQL DB). Will F2 hold as parallelism increases? Throughput testing is especially important for report loads because parallel tasks can run within a report, such as visuals executing DAX queries in parallel, and across reports, such as when concurrent report requests overlap.
I used the artifacts are included in the “Microsoft Dashboard in a Day” for this test and load tested only the first report page.
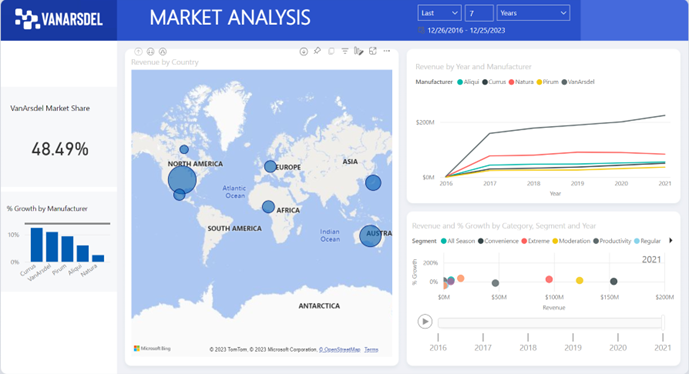
The Sales fact table in the semantic model has over seven million rows so it represents a good size dataset. Naturally, the more involved the report is and the more data the semantic model has, the more CPU power and parallelism are needed. I used the Microsoft Power BI Dedicated Capacity Load Assessment Tool and configured it to filter the report on different years in order to avoid report caching. I ran four tests for 1, 2, 3 and 4 virtual users with no think time, and each test ran for 10 minutes.
Here are the results:
| Users | Total report renders | Renders per user |
| 1 | 63 | 1×63 |
| 2 | 100 | 2×50 |
| 3 | 135 | 3×45 |
| 4 | 164 | 4×41 |
Here are some additional findings:
- Within the first minute or so, F2 generates reports fast, presumably because bursting comes into play to let F2 borrow and recruit more CPU resources. As the sustained load continues, Fabric starts scaling back and throttling CPU.
- As time goes by, report executions are getting increasingly slower. While during the first minute a report can take 1-2 seconds for example, later it might take as much as 40 seconds to render (users are unlikely to tolerate this). This happens even with one virtual user, presumably because the quarter of the core is insufficient.
- I haven’t encountered any errors. All report executions succeeded irrespective of how long they take.
What all these tests mean is that if Fabric is appealing to you, F2 can be a viable option for smaller organizations where report users are expected to run reports sporadically. In case of a sudden load, such as everyone running reports at 8 AM on Monday, Fabric bursting can elevate the pressure for the first minute or so. Of course, you need to weigh in many other factors, such as relenting control to Microsoft, waiting for the technology to mature, avoiding lock-in, evaluating budget (note that viewers would still need at least Power BI Pro individual licenses for capacities lower than F64), and various other considerations I covered in my previous Fabric-related posts.