At least five of the top 10 IT trends in 2019 identified by Gartner involve machine learning in one form or the other. The list includes autonomous things, augmented analytics, AI-driven development, digital twins, and immersive experience. Gartner also predicts that by 2022, at least 40 percent of new application development projects will have machine learning (ML). Therefore, it’s not surprising to see vendors making huge investments in predictive analytics. This newsletter focuses on two important Power BI enhancements for ML that will be available for public review soon: AutoML and integration with Azure Predictive Analytics services (Azure ML and Cognitive Services).
AutoML
The problem with machine learning is that it’s hard and there aren’t that many data scientists out there (or least ones that you can afford). The promise of AutoML is to bring predictive analytics to data analysts just like self-service BI brought descriptive analytics to business users. Power BI AutoML is based on another recent technology introduced by Microsoft: ML.NET. ML.NET is for .NET developers who want to incorporate machine learning features in .NET apps without external dependencies or tools.
As it stands, Power BI AutoML requires a premium capacity (either via Power BI Premium or Power BI Embedded). The process starts with the data analyst creating an entity containing the data to be predicted. For example, the entity might return a list of customers who have purchased a product in the past with some fields that the data analyst believes are significant to “convert” a customer into a buyer, such as demographics fields. Then, the data analyst can use AutoML to create a predictive model that forecasts the likelihood of future customers to purchase a product. This could be useful for a targeted campaign or to implement “customers who purchased this product have also purchased another product” but many other ML scenarios are possible. The process for implementing an AutoML model is simple and starts with clicking the AI Insights button on the entity page.
This starts a wizard that walks the data analyst through a few steps that I described in more detail in my “First Look at Power BI AutoML” blog. In the same blog, I shared some ideas to simplify the experience even further that I hope Microsoft will implement.
Integration with Azure ML and Cognitive Services
While AutoML is a “quick and dirty” way for data analysts to implement predictive models, data scientists need more control. They have many tools in the Microsoft ecosystem, ranging from R and Python in SQL Server to cloud-based PaaS services, such as Azure ML. One of the easiest tool is Azure ML.However, currently Power BI doesn’t integrate natively with Azure ML experiments, so you must resort to using the Web connector to call the experiment’s web service. I demonstrate how you can do this in a singleton way (one row at a time) in chapter 11 of my latest Power BI book (you can download the code from the book page). This method is still available but it’s cumbersome to implement and it’s slow.
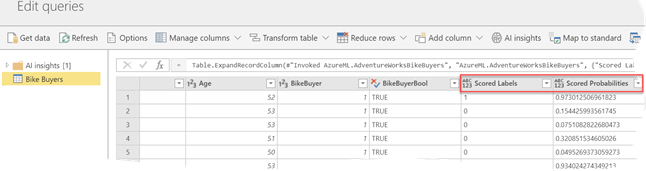
It simplifies the integration with Azure ML and Cognitive Services – In the case of Azure ML, all you have to do is to select the predictive web service and map the source columns as input to the model. Power BI will invoke the web service and add new predictive columns (in this case, to predict if the customer will be a buyer and the probability for this to happen).
It’s much faster – Power BI calls the service in batch mode, which is significantly faster than predicting one row at the time.
The Cognitive Services integration works in a similar way. It allows you to augment your Power BI data with cognitive features, such as sentiment analysis and image recognition. For more information, watch the related announcements: integration with Cognitive Services and Azure ML, and the new Auto ML features (skip to 1:08:30).
The forthcoming AutoML and Integration with Azure ML and Cognitive Services will be major enhancements to the Power BI predictive analytics capabilities. Both features will be available in public preview soon.
Teo Lachev Prologika, LLC | Making Sense of Data Microsoft Partner | Gold Data Analytics
Happy Holidays! I hope you’re enjoying this special time of the year. According to Gartner, “poor data quality is hitting organizations where it hurts – to the tune of $15 million as the average annual financial cost in 2017″. Data integration is another huge challenge, you know it and I know it. Microsoft hopes that Power BI dataflows will help data analysts tackle these issues and dataflows are the subject of this newsletter. But before I give you my opinion about this newcomer, I’m excited to announce the availability of the fourth edition of my “Applied Microsoft Power BI” book – the only Power BI book that it’s updated every year to keep it up with the ever-changing world of Power BI and the Microsoft Data Platform! The book is making slowly its way to the retailers and it should be available on Amazon in the first days of 2019.
What’s a dataflow?
I’m sure that by now you’ve heard about Power Query – a tool that is integrated with Power BI Desktop to help the data analyst clean and shape the data. The issue with the Power Query though is that it’s tightly coupled with Power BI Desktop while data integration challenges sometimes need to be solved at a larger scale. Think of dataflows as “Power Query in the Cloud”. Dataflows is to self-service BI what ETL is to Power BI pros.
A dataflow is a collection of Power Query queries, also known as entities, and it lives in a Power BI organizational workspace.
For example, if I want to stage data from Salesforce, I can create a dataflow with as many entities as Salesforce tables I want to stage. Unlike Power Query, which can only output to a table in a data model, a dataflow saves its output as a pair of a CSV file (data) and JSON file (metadata) in a Microsoft provided data lake store.
So, for the BI pros who are familiar with SSIS projects for ETL, think of a dataflow as a project and queries as SSIS packages. Just like you can deploy an SSIS project and schedule it to run at a specific time, you can schedule a dataflow, and this will execute all its queries.
The Good
There is a lot to like about dataflows. I can think of two primary self-service scenarios that can benefit from dataflows:
Data staging – Many organizations implement operational data stores (ODS) and staging databases before the data is processed and loaded in a data warehouse. As a business user, you can use data-flows for a similar purpose. For example, one of our clients is a large insurance company that uses Microsoft Dynamics 365 for customer relationship management. Various data analysts create data models from the same CRM data, but they find that refreshing the CRM data is time consuming. Instead, they can create a dataflow to stage some CRM entities before importing them in Power BI Desktop. Even better, you could import the staged CRM data into a single dataset or in an organizational semantic model to multiple data copies and duplicating business logic.
Certified datasets – One way to improve data quality and promote better self-service BI is to prepare a set of certified common entities, such as Organization, Product, and Vendor. A data steward can be responsible for designing and managing these entities. Once in place, data analysts can import the certified entities in their data models.
There is a solid architecture, vision, and investments behind dataflows. You create dataflows using a tool that you’re already familiar with: Power Query. If you know Power Query, you know dataflows. Microsoft has provided the data lake storage and pricing is included in Power BI Pro/Power BI Premium. So, you have everything you need to get started with dataflows today. Ingesting the dataflow output is very fast too because you import CSV files.
The Bad
My blog on same subject started with positioning as I was left with the impression from watching the MS presentations that Microsoft encourages business users to consider dataflows for any data integration task, from data staging to loading data warehouses and even replacing data warehouses and ETL (heard that vibe before?) But Matthew Roche clarified that “dataflows don’t replace data warehouses and ETL any more than Power BI desktop replaces a full set of BI pro tools. Dataflows complement these pro tools, and enable users who are not BI pros to fill in more gaps in a BI solution, similar to other Power BI capabilities. Although dataflows mean that self-service users can do more without help, the same patterns still apply”. So, consider this if you hear a different propaganda and use the right tool for task at hand.
You need Power BI Premium to realize the full potential of dataflows. For some obscure reason, features like linked and computed entities are not available in Power BI Pro. I wonder how many customers will feel pushed to go Power BI Premium as more and more features are only available there. I don’t mind scalability and performance related features but incremental refresh and linked entities?
Lastly, the CSV output is both a blessing and a curse. True, ingestion is fast, but text files are not a relational database. Business users can’t make direct changes to the staged data. Further, the only option is to import the dataflow output in Power BI as DirectQuery is not available for text files.
The Ugly
As dataflows stand today (in preview), you (almost) can’t access directly the output generated by dataflows. This precludes the continuum between self-service and organizational worlds. For example, IT might need to import a certified dataset into a data warehouse. But you can only connect to a dataflow in Power BI Desktop because the CSV files are not directly accessible. True, Power BI Premium lets you bring your own data lake storage (currently a preview feature), but a better option in my opinion was to provide access to the raw data in both Power BI Pro and Premium given that this is your data lake and your data.
Semantics relates to discovering the meaning of the message behind the words. In the context of data and BI, semantics represents the user’s perspective of data: how the end user views the data to derive knowledge from it. A modeler translates the machine-friendly database structures and terminology into a user-friendly semantic model that describes the business problems to be solved. To address this need, you create a semantic model. In my “Why Semantic Layer?” newsletter I explained the advantages of an organizational semantic model. In this newsletter, I’ll discuss how Power BI extends semantic modeling and converges it on a single platform. But before I go into details and speaking of semantic models, I’m excited to announce the availability of my new “Applied DAX with Power BI” workshop and its first in-person and public enrollment class on Oct 15-16 in Atlanta! Space is limited so RSVP today.
Semantic Model Flavors
In Microsoft BI, you can implement a semantic model using Power BI Desktop, Excel (Power Pivot) and Analysis Services (Multidimensional and Tabular). The first two are typically used by data analysts, while Analysis Services is considered a professional technology. Thus, we can classify semantic models into two broad categories: personal (self-service) and organizational. Behind the scenes, Power BI Desktop, Power Pivot and Analysis Services Tabular use the same foundation and storage engine. Nevertheless, up to now there have been feature differences and a strict division between these two types.
Personal
Organizational
Author
Data analyst
BI Pro
Tool
Power BI Desktop, Excel (Power Pivot)
SSDT and Analysis Services
Scope
Narrow (usually to solve specific need)
Wide (multiple subject areas)
Implementation effort
Short
Longer (data warehouse, ETL, model, testing)
Data capacity
Limited (up to a few million rows)
Larger (millions or billions of rows)
Data quality
Trust author
Trust modeler and testers
Data centralization
May lead to data duplication
Single version of truth
Deployment
Power BI Service, Power BI Report Server
SSAS (on premises)
Azure Analysis Services (cloud)
Consumers
Department, project
Potentially entire organization
How Power BI Changes Semantic Modeling
Power BI will blur the boundary between the personal and organizational aspects of semantic modeling. First, we’ve already seen how Microsoft introduced the following “pro” features in Power BI that don’t even exist or more difficult to implement with Analysis Services:
Incremental refresh – Delivers the ability to refresh portions of a larger dataset, such as the last 7 days. Currently, the largest dataset size supported by Power BI Premium is 10 GB, but Microsoft has already announced that soon Power BI will support larger datasets. What this means for you is that you’d be able to deploy organizational semantic models to Power BI Premium and schedule them for incremental refresh. My blog “Notes on Power BI Incremental Refresh” provides the details on this feature.
Composite semantic models – A composite model has heterogenous storage, such as some tables are imported and some are DirectQuery, as I discussed in my blog “Power BI Composite Models: The Good, The Bad, The Ugly“. This brings a lot of flexibility to how you connect to data.
Aggregations – Aggregations are predefined data summaries to speed up queries with very large models. My blog “A First Look at Power BI Aggregations” covers Power BI aggregations.
On the tooling side of things, Power BI Desktop will also pick “pro” features, such as perspectives and displays folders. Microsoft hopes that in time Power BI Desktop will serve the needs of both data analysts and BI pros. However, the lack of extensibility and source control, as well as performance issues caused by committing every model change to the background Analysis Services instance, makes me skeptical that pros will embrace Power BI Desktop. But because Microsoft announced plans to open the Power BI Tabular management endpoint (recall that published Power BI datasets are hosted in a “hidden” Tabular server), pros can still use SSDT and community tools, such as Tabular Editor, to design and deploy their models to Power BI Premium.
In time Power BI Premium will become a single cloud platform for hosting Microsoft BI artifacts (semantic models and reports) and facilitating the continuum from personal to organizational BI. This is a great news for BI practitioners frustrated by tooling and deployment differences. At the end, the personal and organizational paths will converge without feature discrepancies. The only difference would be the scope of your organizational model and how for you want it to become “organizational”.
Teo Lachev Prologika, LLC | Making Sense of Data Microsoft Partner | Gold Data Analytics
BI and data integration projects often benefit from an operational data source (ODS), whose benefits and design I discussed in my “Designing an Operational Data Store (ODS)” newsletter. A corporate ODS typically fall into the organizational BI area, which means that it’s implemented and sanctioned by IT. Wouldn’t be nice to let Business stage the data needed for business applications and analytics? Of course, it would! Think of the Microsoft Common Data Services as a cloud staging database or ODS by Business and for Business. But before I discuss the details, makes sure to review our Terms of Use, which has been updated as part of our commitment to transparency and to address the requirements set forth by the new European privacy law (General Data Protection Regulation). By continuing to use the Prologika website and its online services, you consent that you have read, understand and accept the terms of the Prologika Privacy Policy. If you have any questions regarding our updated Privacy Policy, please contact us by writing to info@prologika.com.
What’s Common Data Services?
Microsoft introduced Common Data Services were introduced as a part of the reimagined Business Application Platform as a “one connected platform that empowers everyone to innovate” and to put all the data you need into a standardized data model. Common Data Services consists of two offerings: Common Data Service for Apps (CDS for Apps) and Common Data Service for Analytics (CDS for Analytics).
Why two flavors? Think of the Microsoft Common Data Service for Apps (CDS for Apps) as a cloud OLTP-like repository by Business and for Business. Officially introduced in 2016 and running on Azure SQL Database, CDS for Apps is now the entity and data model behind Dynamics 365. This is where Dynamics 365 stores its data. Because it’s transaction-oriented, it’s layered on top of SQL Server. By contrast, Common Data Service for Analytics (CDS for Analytics) is oriented towards supporting analytical requirements.
How Do They Compare?
The following table compares the two CDS types.
CDS for Apps
CDS for Analytics
Primary usage
OLTP
OLAP
Primary tool for loading data
PowerApps/Power Query
Power Query
Primary tool for reading data
PowerApps/Power BI
Power BI
Data storage
Azure SQL Database
Azure Blob Storage (a CSV text file per entity and a JSON file for the schema)
Both CDS types support standardized entities, whose definitions are documented in the GitHub repository of the Common Data Model. Currently, the schema of these entities is designed and controlled by Microsoft and it’s limited to Dynamics entities, such as Account, Opportunity, and so on. However, Microsoft hopes that other vendors will provide solutions and extend the CDS schema. Of course, because CDS is your database, you can extend it with your own custom entities. Note that both CDS types target business users willing to store and analyze data in a business-friendly staging database. Over time Microsoft hopes that partners will deliver more value to CDS by implementing apps (CDS apps are like the prepacked apps that already exist in Power BI, such as for Salesforce and Dynamics). Let’s now highlight some of the differences of the two CDS flavors.
Common Data Service for Apps
The main usage scenario for CDS for Apps is to jumpstart the development of PowerApps applications with a standardized data model that you can extend to your own needs.
The Good
There is a lot to like about CDS for Apps. Let’s start with pricing. Other vendors, such as Oracle and Teradata, have similar visions and products but their offerings are very expensive. The CDS for Apps pricing is included in the PowerApps licensing model because PowerApps is the primary client for creating CDS for Apps-centered solutions. Using CDS outside selected Dynamics 365 plans (that include it already) will cost you at least $7 per user and per month. CDS for Apps is more than just a data repository. It’s a business application platform with a collection of data, business rules, processes, plugins and more. In this regard, it resembles SQL Server Master Data Services (MDS). The modeler can:
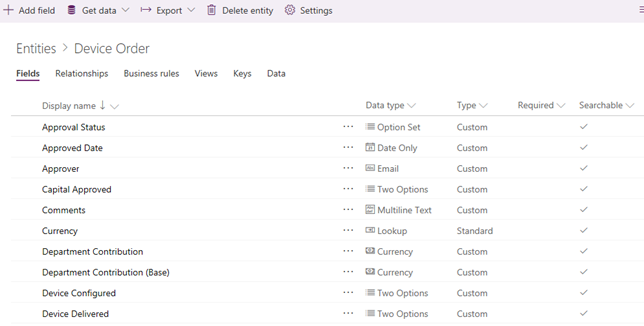
Define and change entities, fields, relationships, and constraints. For example, the screenshot shows a custom Device Order entity that I’ve created.
Business rules, such as to prepopulate Ship Date based on Order Date.
Secure data to ensure that users can see it only if you grant them access. Role-based security allows you to control access to entities for different users within your organization
Besides the original PowerApps canvas apps (like InfoPath forms), CDS for Apps also opens the possibility to create model-driven PowerApps applications (require PowerApps P2 plan). Model-driven apps are somewhat like creating Access data forms but more versatile. Because PowerApps knows CDS for Apps, you can create the app bottom-up, i.e. start with CDS for Apps and then generate the app based on the actual schema and data. For example, you can use PowerApps to build a model-driven app for implementing the workflow for approving a certain process. Model-driven apps are a new style of a PowerApps application that makes it easy to build entity forms, entity views, and workflows. How do you get data into CDS for Apps custom entities? Your PowerApps app can write to it. Or, you can create and schedule a project that uses Power Query (yep, the same one as in Power BI) to load data from somewhere into CDS for Apps.
The Bad
How do you get data out from CDS for App, such as to import data from some entities into a Power BI model? Microsoft has released a preview build of the Common Data Service for Apps connector for Power BI. However, this connector is even slower that the Dynamics connector. It uses the OData v4 Web API. Based on my limited tests, it took the connector about a minute to download 40,000 rows from Dynamics, clocking 10% slower than the Dynamics connector. To make things worse, the connector doesn’t support query folding, so Power BI must download the entire dataset before Power Query applies filters. Because the connector doesn’t support also REST filter and select predicates, so you can’t filter data or select a subset of columns at the source. Microsoft is actively working on improving the connector performance and it might get better in time.
Continuing down the list of limitations, CDS for Apps doesn’t support change tracking (to capture changes to a given row) and incremental loads, such as to load or refresh only the data that has changed yesterday or previous month. These are all essential features that could make ODS even more valuable.
The Ugly
For years people were complaining that after migrating from the on-premises Dynamics to the cloud, they lost the ability to connect to its database directly and they had to rely on the REST APIs (slow) or Data Export Service to export the data to an SQL Server Database (fast but requires additional effort and budget). Unfortunately, although CDS for Apps stores data in Azure SQL Database, Microsoft doesn’t expose its database directly to get data out fast and bypass the REST endpoint. When I raised this issue to Microsoft I got feedback that CDS for Apps is a business platform and there are layers on top of data to handle security, rules, calculations, and so on. However, the argument that CDS for Apps is more than just a database is nonsensical to me. Try to explain to a customer that cakes have layers and CDS for Apps has layers, and therefore getting something out of it is slow. As I mentioned, the “layered nature” of the CDS is conceptually like MDS. In fact, I see a lot of overlap. MDS also supports rules, security, etc. but it doesn’t force me to go through the web service interface if all I need is the raw data. Hence, my wish to support direct connectivity to the Azure SQL Database endpoint of CDS for Apps.
Common Data Service for Analytics
CDS for Analytics is a standard feature of Power BI so every Power BI Pro user can access it. CDS for Analytics is exposed to the end user in Power BI as datapools. A datapool is a collection of entities associated with a Power BI app workspace. An entity maps to a text file in Azure Storage. Business users will rely on Power Query to populate (manually or via a scheduled refresh) entities in CDS for Analytics. You can access the workspace datapool in the workspace content page
The Good
I can think of three primary scenarios where CDS for Apps can deliver value as it stands today:
Offline data staging – Let’s say IT doesn’t allow direct connectivity to LOB applications but you need to create some reports on top of this data. You can stage the data as text files into CDS for Analytics. I don’t think CDS for Analtyics would bring much value if you could connect directly to it in Power BI Desktop if direct connectivity is an option. The more you move the data, the more problems you may run into. At least for now, having apps on top of text files doesn’t look like a good reason to me but I guess we have to see what apps will become available in time.
Prepackaged third-party solutions – Sometime ago, a software vendor asked me how they can deploy a solution to Power BI for their customers but still retain ownership. Back then I didn’t have a good answer but CDS for Apps might be a good option now. In fact, besides the Power Query as a primary tool for loading entities, any service that can write to Azure Storage can bring data to CDS for Analytics. The ISV can write the entities as CSV files and tell CDS Analytics to “mount” the storage container. CDS Analytics can now see these mounted entities and treat them as part of the whole. Worried about protecting intellectual property? Currently only the Insight App installer would have access to the installed workspace and artifacts (other users in the organization would just see the published reports which are shared with them).
Prepackaged insights – Like CDS for Apps, CDS for Analytics understands the Common Data Model. Over time, Microsoft and partners can contribute prepackaged “insights” that are built on top of popular LOB apps, such as Dynamics or Salesforce.
Pricing is also right. CDS for Analytics is included in Power BI although it storage counts towards the workspace quota. Another thing I like about CDS for Analytics is that the Power BI connector is very fast unlike the CDS for Apps connector.
The Bad
As of now datapools support only a small subset of the Power Query connectors. This is probably just a temporary limitation for the preview cycle. I’d imagine that all Power BI connectors for cloud and on-premises data sources will be eventually available. Continuing on the list of limitations, like CDS for Apps, CDS for Analytics doesn’t support incremental refreshes so be careful downloading millions for rows every night.
The Ugly
CDS for Analytics promises to break silos but a datapool is associated with a Power BI workspace. This architecture fragments CDS for Analytics into Power BI workspaces. However, most users would probably require access to common entities, such as Customer, Product. Not only this is not possible but the datapool storage is also limited by the workspace quota. So, if you are a Power BI Pro user who has access to an app workspace, you’re currently limited to 10 GB storage quota which includes not only Power BI datasets but also CDS entities. I wish that CDS has no association to workspaces and it was designed a global staging area, just like Azure Storage. Microsoft has promised at some point in future to allow you to reference entities between datapools in different workspaces and create calculated entities on top of them.
The success of Common Data Services for Apps will depend largely on adoption and contributions by Microsoft partners. Although it lacks typical ODS features and fast connectivity, CDS for Apps gains in “business platform” features. CDS for Analytics and Power BI Insights are new additions to Power BI. CDS for Analytics delivers Operational Data Store (ODS) to business users that is populated and maintained by business users. Microsoft and partners can augment CDS for Analytics with Power BI Insights apps.
Teo Lachev Prologika, LLC | Making Sense of Data Microsoft Partner | Gold Data Analytics
With hundreds of vendors out there, choosing a BI tool isn’t easy. If you’ve been following me for a while, you know that I love Power BI. One of the Power BI most prominent strengths is that it’s a part of the much broader Microsoft Data Platform that spans various on-premises and cloud offerings for data storage, processing, and analysis. Thanks to this integration, you can implement real-time dashboards, extend your Power BI reports with predictive capabilities, integrate with Big Data, and much more. In this newsletter, I’ll talk about an exciting integration option: extending Power BI with business applications, thanks to its integration with PowerApps and Flow. And if you happen to be in the Microsoft office in Alpharetta, feel free to ask for a demo of the Power BI Writeback that Prologika prepared and deployed to the Microsoft environment. You’ll be directed to one of the big screens when you can test the report that I mention in this newsletter.
What’s PowerApps?
Every organization requires some sort of custom data-driven apps. And every organization is under pressure to do more with less. Have you used Microsoft Access? If so, you probably remember that Access makes it easy to create data-driven forms. But they were available only in Access and could access only Access database. You might also remember InfoPath – an app for designing, distributing, filling and submitting electronic forms containing structured data which Microsoft discontinued in 2014. Think of PowerApps as the evaluation and replacement of InfoPath. PowerApps is an Azure-hosted service that lets you build data-driven business apps that run in a browser or on mobile devices. Unlike Access and InfoPath, PowerApps supports many cloud or on-premises data sources. Connectivity to on-premises data sources requires installed a data gateway, which is the same software that Power BI uses to tunnel into your corporate network.
Targeting power users and developers, PowerApps requires minimum code and it has its own expression language. In the process of building an app, you specify where you want your data to come from. Then, you choose pre-defined layouts for your forms and link them together. You can develop the app online or by downloading a Windows-based desktop app. Developing the app is free. Sharing the app requires a plan, but if use Office 365, chances are that your O365 business plan already includes PowerApps.
What’s Flow?
As I explained in my “Going with the Flow” blog, Microsoft Flow is another cloud service for creating automation flows without writing code, similar to Zapier’s “zaps” and IFTTT’s “recipes”. Like PowerApps, Flow targets business users and developers willing to create basic multistep flows for automating tasks. For example, you might want to start a workflow when an email is received from specific recipients or containing specific words. Microsoft Flow makes it possible to automate this scenario and many, many more. Business users can connect their accounts, take advantage of pre-built templates, and create their own flows in an easy visual designer. And your PowerApps app can start a flow thanks to the fact that PowerApps and Flow work together.
How Can PowerApps and Flow Enrich BI?
After the integration with Visio, Power BI just took another leap forward with the introduction of the PowerApps custom visual. You can use this visual in your Power BI reports to bridge the Data Analytics and Developer worlds. Now your Power BI apps can integrate with Line of Business (LOB) applications in versatile ways and the app can trigger workflows. All this with minimum code! Suppose you have a Power BI report that shows sales by customers. As the user browses the data, he realizes that some changes need to be made. Granted, the user can open the appropriate business app and make the changes there, and then go back to the report to see the changes. But read-only reports and are so 20th century. Instead, why can’t we allow the user to make the changes on the report by integrating it with PowerApps? This scenario is commonly referred to as writeback.
This is exactly the approach my Customer Writeback app demonstrates. The user selects a customer in the table and the customer details show up in the Change Customer visual to the right. This is the PowerApps visual that references my Customer Writeback PowerApps app. The user can make changes in the PowerApps form and save the changes back to the underlying database. Then the user can refresh the report to see these changes. Bringing this one step further, the app can start a workflow, such as when a formal approval is required to approve the changes.
If you have experience with PowerApps, implementing this scenario takes minutes. You can find the implementation steps and source code in my “Power BI Writeback” blog.
The Power BI integration with PowerApps and Flow opens exiting new possibilities and redefines the meaning of a report. These three technologies let you integrate your reports with “smart” applications that you can implement with almost no code! Featuring more than 100 data sources, you can use PowerApps and Flow as an integration hub to mash data from almost any place, create workflows, and then embed PowerApps forms in Power BI reports.
Teo Lachev Prologika, LLC | Making Sense of Data Microsoft Partner | Gold Data Analytics
Happy Holidays! I hope you’re enjoying this special time of the year – time for sharing and giving. Speaking of sharing, how does your company share BI artifacts with your B2B or B2C partners? Do you still send Excel spreadsheets or embed canned SSRS reports? If so, Power BI offers a better sharing model and I’ll show you how in this letter. And about Power BI, I’m proud to announce that the third revision of my “Applied Power BI Book” should be out in a week or so. Thoroughly updated to reflect the latest of the ever-changing cloud world of Power BI and featuring 20% new content, this book is the self-study resource your organization needs to master Power BI.
Sharing in Power BI Service
Many organizations share reports with external users for Business to Business (B2B) or Business to Consumer (B2C) scenarios. If all you need is granting some external users access to some cool interactive reports and dashboards inside powerbi.com, you can do so by just sharing the content out using dashboard sharing or apps, as you do with internal users. But there are some special considerations though so read on.
Like using Power BI for internal use, external users need to be authenticated by a trusted authority. To authenticate external users, Power BI relies on Azure Active Directory (AAD). Therefore, the external organization and user need a record in AAD. If the user doesn’t have an AAD account, the user will be prompted to create one. Let’s say Elena from Adventure Works wants to grant Matthew from Prologika access to some Power BI content. Elena creates a workspace to host the external content and then she invites Matthew. To do so, she can simply share a dashboard or create an app, and then add Matthew’s email as a recipient. Matthew receives an invitation email with a link to the dashboard or app. Matthew clicks the link to access the content. Azure AAD verifies that Prologika and Matthew have records in AAD. If so, AAD will ask Matthew to sign in with his AAD credentials and grant him access to the shared Power BI content.
About cost, Power BI licensing for external users is not much different from licensing internal users. In a nutshell, the external user must have a Power BI Pro license to access Power BI content in the sharing tenant. This license can be acquired in one of three ways:
The sharing organization is on Power BI Premium – If Adventure Works is on Power BI Premium and the sharing workspace is in a premium capacity, Elena can share content to external users, just like she can share content with internal Power BI Free users.
The sharing organization assigns Power BI Pro licenses – Elena can assign one of her organization’s Power BI Pro licenses to Matthew.
The external organization assigns Power BI Pro licenses – In this case, Matthew has a Power BI Pro license from the Prologika’s Power BI tenant. Matthew can bring in his license to all organizations that share content with Prologika.
Sharing with Power BI Embedded
Sharing in Power BI Service is simple, but it has some important drawbacks:
Dependency on Azure Active Directory (AAD) – Every user must have an AAD account.
Not adequate support for B2C – AAD is expected to support Live IDs soon, such as outlook.com emails, but you’d need to wait for other providers. Yet, many B2C apps allow external customers to authenticate with email addresses of their choice. UPDATE 3/11/2018:Power BI Service now supports sharing using personal emails.
Per-user license – Despite that Power BI offers three licensing options for external users, every user must be covered by a Power BI Pro license.
Read-only reports – Users are limited to read-only reports. They can change existing reports or create new reports.
Collectively known as Power BI Embedded, the Power BI embedded APIs can help your developers overcome these challenges in a cost-effective way. A developer can integrate any modern web-enabled app to embed Power BI dashboards, reports, and even natural questions, so that they appear as a part of your company’s offering (see the screenshot below), instead of redirecting the user to powerbi.com. Reports not only preserve their interactive features, but also users can edit them or create new reports from scratch (if your app lets them)!
There are two ways to acquire Power BI Embedded. If your organization is on Power BI Premium, you already have everything you need to embed content for both internal and external users (assuming a P plan as EM plans are more restrictive and for embedding only). Most smaller companies and Independent Software Vendors (ISVs) looking for embedding content to external users only, would gravitate toward the Azure Power BI Embedded plans. Starting at $750/month, there are currently six Azure plans depending on how much capacity (memory, cores, and report views) you need. The Azure plans can also result in significant cost savings because they allow you to quickly scale up and down, and even pause them! For example, if the most report activity happens within normal working hours, you can scale it down to a lower plan outside the peak period.
Have you used Power BI Embedded before? When Microsoft introduced Power BI Premium in June 2017, they also revamped Power BI Embedded. Previously, Power BI Embedded was for embedding content for external users only. It was implemented as a Microsoft Azure Service and it had its own content storage and different APIs. The problem was that the old Power BI Embedded didn’t have feature parity with Power BI Service. This all changed with the new Power BI Embedded. Think of the new Power BI Embedded as Power BI Service with its own licensing model that has the same features as Power BI Service. The old Power BI Embedded will be discontinued in mid-2018, so it’s time to migrate and modernize your apps.
Power BI Embedded can deliver tremendous value to your business partners by bringing the powerbi.com engaging experience but embedded in your portals and apps. If you need implementation help with Power BI Embedded, drop us an email at https://prologika.com/contact/. Prologika has successfully helped a few organizations integrate their apps with Power BI Embedded. Learn about the business value from one of our engagements in the Microsoft’s “ZynBit Empowers Sales with Microsoft Power BI Embedded” case study.
As you’d probably agree, the BI landscape is fast-moving and it might be overwhelming. If you need any help with planning and implementing your next-generation BI solution, don’t hesitate to contact me. As a Microsoft Gold Partner and premier BI firm, you can trust us to help you plan and implement your data analytics projects, and rest assured that you’ll get the best service. Regards,
Teo Lachev
Teo Lachev President and Owner Prologika, LLC | Making Sense of Data Microsoft Partner | Gold Data Analytics
As I’m writing this newsletter, Florida and Georgia (I live in Atlanta, GA) are in the midst of planning for hurricane Irma, which is expected to be one of the most powerful Atlantic Ocean hurricanes in recorded history. I hope that this won’t be the case and we don’t have to deal with a disaster of the magnitude of hurricane Harvey that took place just two weeks ago in Houston, TX. To avoid and mitigate this, a great deal of planning happens at every level: from government to citizens. Did you know that over 5 million of people in Florida were evacuated, making this the biggest US displacement of people to date? Speaking of planning, how does your company approach Business Performance Management? Do you use Excel spreadsheets or expensive high-end planning software? Next, I’ll share how Prologika helped a large organization improve its budgeting and planning process, powered by a cost-effective solution based on Microsoft BI.
Why Business Performance Management?
Wikipedia defines Business Performance Management (BPM) as “a set of performance management and analytic processes that enables the management of an organization’s performance to achieve one or more pre-selected goals”. A simpler BPM definition might be a methodology to help the company predict its performance. An integral part of a BPM strategy is a process for Budgeting, Planning, and Forecasting that typically has the following workflow:
Every planning year, a planner in the Financial department creates a budget for a certain number of future periods. The budget is revised and multiple versions are proposed to management. Once budget is approved, it becomes fixed for the duration of the planning year.
As actuals come in, the planner works on forecast scenarios. Multiple forecast scenarios are typically prepared as the planning year progresses over time.
The planner monitors the variance between actuals and budget, actuals and forecast versions, and between forecast versions to improve the planning accuracy.
Business Needs
When it comes to Finance, nothing is simple and BPM is no exception. In fact, it very well might be that that your BPM solution might be the most complicated software you’ve ever developed. The temptation is to buy a prepackaged software but even that route would require a lot of customization and compromises. To gauge complexity, let’s look at some of the business requirements we faced.
Similar to a Telco, this company has customers and service plans. As a B2B organization, their customers are other companies. Planning is done at the customer and service plan level, and across multiple subject areas. For example, the Excel report shows a subset of the measures for planning growth of the customer base. The planner can change the budget and forecast values of some measures, called drivers. For example, the planner can overwrite Gross Adds for future periods. Further, the planner can overwrite a rule in each cell to change how the driver cell value is computed. The rules are:
0 (default rule) – By default, planned values are calculated as 3-mo average of previous periods. For example, Gross Adds for Aug 2017 for the first plan is 221 and has a Gross Adds Rule of 0. This means that the system will calculate the value as a 3-mo simple average of the values of the previous three months (221, 218, and 223). Note that a previous month might fall in the Actuals range. Also notice that recursive calculations are required, where the value of each month is based on the same measure for previous periods.
1 (6-mo average) – Instead of 3-mo average, 6-mo average is used.
2 (seasonality index) – The value is computed by multiplying the driver values for the past 12 months by a seasonality index.
Any other value – The planner enters the driver value manually.
The driver measures are used to calculate other (output) measures. For example, Average of Subscribers has a formula that is based on Gross Adds and other measures. Finally, the drivers and output measures are allocated across a Chart of Accounts dimension (not shown on the report) to give managers the financial perspective of how the company is doing.
The Solution
Previously, the company has used an Excel-based home-grown solution. However, the process was manual, lengthy, error-prone, and it couldn’t give management a quick and accurate picture of the company’s performance. A Business Analytics group was responsible for retrieving and consolidating actuals. Then, the Finance group would manually input actuals into an Excel template. Complicated Excel formulas were used to calculate drivers and output measures but even Excel had difficulty with more complex recursive measures. Most of the time and effort was spent on working the system than on business performance management. The company looked at other high-end financial solutions, with a starting price tag of $300K, plus yearly maintenance fees and consulting feeds. At the end, the company entrusted Prologika to implement the solution.
We used Analysis Services 2016 Multidimension, Initially, we considered Tabular but we realized that the solution complexity exceeded the Tabular capabilities, including:
No support for writeback – Currently, Tabular doesn’t writeback although third-party solution such as Power Planner can be overcome this limitation.
No support for recursive measures – Currently, Tabular doesn’t support recursive measures, where the measure DAX formula references the same measure.
No scope assignments – Tabular doesn’t support scope assignments for allocations.
No parent-child dimensions and hierarchy functions – Tabular doesn’t support parent-child hierarchies and functions for navigating the hierarchy, such as Parent, Children, etc.
This is a classic example of using the best tool for the job. While Tabular could be a good fit for perhaps 80% of semantic models out there, Multidimensional is probably your best bet for Financial projects and projects that require massive data volumes. No tool is perfect. “When all you have (know) is a hammer, everything looks like a nail” doesn’t work for BI.
MS BI Events in Atlanta
Atlanta MS BI and Power BI Group: “Did Qlik run out of BI power?”presentation by Carlos Rodriquez on 9/25
Atlanta MS BI and Power BI Group: “Topic: TBD” presentation by Slalom Consulting on 10/30
As you’d probably agree, the BI landscape is fast-moving and it might be overwhelming. If you need any help with planning and implementing your next-generation BI solution, don’t hesitate to contact me. As a Microsoft Gold Partner and premier BI firm, you can trust us to help you plan and implement your data analytics projects, and rest assured that you’ll get the best service. Regards,
Teo Lachev
Teo Lachev President and Owner Prologika, LLC | Making Sense of Data Microsoft Partner | Gold Data Analytics
As I mentioned in my Spring newsletter “15 Reasons Why Microsoft is Leading the BI Space”, Microsoft BI is enjoying resurgent interest from customers and industry observers, and Power BI gets lots of attention. I’m sure that you’ve also heard the announcements about Power BI Premium – a new dedicated licensing model for Power BI. In fact, Power BI Premium is so important to Microsoft that it’s positioned as a new product under the Power BI umbrella name instead of a new licensing model. In this newsletter, I’ll discuss what Power BI means for you and why you should strongly consider it. If you live in these cities, consider joining me at SQL Saturday Chattanooga on June 24th or the Atlanta MS BI Group on June 26th when I’ll present “Understanding Power BI Premium” and discuss its inner workings in more detail. My June calendar has the details about these events.
Why Power BI Premium?
According to Microsoft, for less than 2 years since Power BI became generally available, more than 5 million users are currently using it. As the product matures, the following growing pain points have emerged:
Per-user licensing model – Large organizations find it difficult to license Power BI per user. A case in point – one year after a successful Power BI hybrid pilot, a Fortune 100 organization has purchased whopping 5 Power BI Pro licenses. There are several reasons for the slow adoption by large companies but one of them is the per-user license.
Cost prohibitive with large user base – The per-user licensing model doesn’t include a “reader” license. If a report has a Power BI Pro features, all users accessing reports would need Power BI Pro licenses. So, if you a report that used Power BI Pro features, such as gateways or live connections, and you won’t this report to be available to 1,000 users, you had to foot $10,000/month bill because everyone required Power BI Pro.
Performance – Power BI Service is a shared cloud environment. Although no one has shared performance issues with me, it’s possible that the performance of your reports might be negatively affected by other organizations.
No “premium” features – When I teach Power BI I often get feedback that some missing features, such as caching and incremental refresh, are important. This goes back to performance but the reason why they are not currently available is because they might impact performance in a shared environment.
Confusing licensing – Previously, there was some overlap between Power BI Free and Power BI Pro. Many organizations find it very difficult to navigate what features are available where.
What’s There to Like in Power BI Premium?
There are several reasons why Power BI might be appealing to your organization.
To start with, larger organizations can save on licensing cost. If all users would need access to reports with Pro features, the breakpoint at which Power BI Premium reduces cost is above 500 users. That’s because, Power BI Premium allows Power BI Free users to access Pro content without Power BI Pro licenses. You can use the Power BI Premium calculator to experiment with what-if scenarios and calculate your licensing cost.
Cost savings is not the only reason to consider Power BI Premium. You also get dedicated capacity. When you purchase Power BI Premium, you buy a dedicated environment for your organization. Think of it as buying a dedicated IaaS service, such as an Azure VM, versus a PaaS service, such as an Azure SQL Database, that is shared with other users on the same server. For more information about how this works and what Premium plans are available, read the Power BI Premium whitepaper.
Almost organization I’ve consulted with has the need to embed reports for a third party. Previously, if you want to embed Power BI reports, you had to use the Azure Power BI Embedded Service, which was separate from the Power BI Service. Consequently, Power BI Embedded had to catch up with Power BI Service. For example, it still doesn’t have connectivity to on-premises data sources. The good news is that Power BI Embedded marries Power BI Service (Power BI Premium = Power BI Service + Power BI Embedded) so there will be feature parity. If you are concerned about the increased licensing cost (Power BI Embedded has an hourly-based session licensing model), Microsoft unveiled low-cost Power BI Premium plans targeted to report embedding only and starting at $625/month.
Another appealing detail concerning embedded analytics is that unlike Power BI Premium which requires reports authors to have Power BI Pro licenses, creating new embedded reports or changing existing embedded reports by external users don’t require a Power BI Pro license. Of course, if your organization purchases a Power BI Premium plan, such as P1 starting at $5,000/month, not only will you be able to use Power BI Premium for internal use, but you can also embed reports for external customers. In other words, one Power BI Premium license covers both internal and external reporting.
Finally, Power BI Premium-only features are in the works, such as real-time caching by pinning datasets to memory, incremental dataset refresh, secondary model copies for disaster recovery, and geo replicas to reduce latency by replicating instances around the world.
Changes to the Power BI Portfolio
You might wonder how Power BI Premium impacts your current Power BI usage. The table below shows how Power BI Premium changes the Power BI portfolio.
Today
Future
Power BI Desktop
Connect to 70+ data sources
Data transformations
Report creation and exploration
No changes
Power BI Free
No live connections, No gateway connectivity
Smaller capacity limits and data refresh rates
Only simple dashboard sharing
Power BI Pro feature parity No sharing (not even simple dashboard sharing)
Power BI Pro
Access to all data sources
Larger capacity limits and data refresh rates
All sharing options (simple, workspaces, org content packs)
No changes
Power BI Premium
Increased capacity limits Dedicated environment Content distribution (reader license) Power BI Report Server More features in future (read the whitepaper)
So, don’t panic! You can continue using Power BI under the current per-user licensing model (Power BI Free and Power BI Pro) if Power BI Premium makes no sense to you. Another good news is that Power BI Free now has all the Power BI Pro features, so hopefully we won’t see “This report requires Power BI Pro license” anymore. The bad news is that with per-user licensing, Power BI Free is for individual use only. A Power BI Free user can’t share any Power BI content (not even simple dashboard sharing). And, unless you purchase Power BI Premium, content can’t be shared with Power BI Free users (Both inbound and outbound sharing are not available for Power BI Free users).
Power BI Report Server
Delivering on its on-premises reporting roadmap, Microsoft has extended SQL Server Reporting Services (SSRS) to support Power BI reports. The extended SSRS will be known as Power BI Report Server. Moreover, Microsoft has decoupled SSRS from SQL Server so it gets more frequent updates. Moving forward, SSRS becomes two products:
SSRS – This is the SSRS we know it but with no Power BI integration. It will get new RDL features but no Power BI integration features.
Power BI Report Server – It gets both RDL and Power BI features. As far as the reason for the name change, the Power BI name is a strong brand while SSRS has been associated with the old style paginated reports.
You can get Power BI Report Server in two ways:
As a part of the Power BI Premium plan where you get the same number of licensed on-premises cores as the v-cores you purchased within your Power BI Premium plan. You can use these licensed cores only for Power BI Premium Report Server (SQL Server requires a separate license if you install it on the same box as Power BI Premium Report Server).
Standalone and covered by a SQL Server Enterprise Edition with Software Assurance license. Currently, SQL Server doesn’t check for Software Assurance in any way (there isn’t such SKU). So, Power BI Premium licensing would be an honor system for customers who want to get it standalone (with SQL Server Enterprise Edition licenses).
So, although Power BI Premium Report Server has divorced SQL Server, you can still cover by the SQL Server license (kind of when you send your kid to college but she still lives with you). In both cases, developers publishing Power BI reports to the Power BI Report Server will require a Power BI Pro license at $9.99/user/mo.
As you’d probably agree, the BI landscape is fast-moving and it might be overwhelming. If you need any help with planning and implementing your next-generation BI solution, don’t hesitate to contact me. As a Microsoft Gold Partner and premier BI firm, you can trust us to help you plan and implement your data analytics projects, and rest assured that you’ll get the best service. Regards,
Teo Lachev
Teo Lachev President and Owner Prologika, LLC | Making Sense of Data Microsoft Partner | Gold Data Analytics
I hope you’re enjoying the beginning of 2017 and you’re staying healthy and busy. It’s been a hectic and exciting period for me. I published the second edition of my “Applied Microsoft Power BI” book in January to keep it up to date. It’s great to see all the momentum and interest surrounding Power BI. Just last month, I taught my “Applied Power BI” class three few weeks in a row! On the implementation side of things, companies of all sizes are adopting Power BI. And, one of our customers made the Power BI blog with their CRM platform that uses Power BI Embedded to deliver interactive reports to their users!
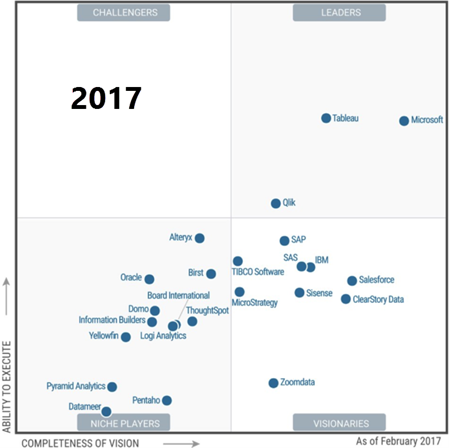
The Gartner 2017 Magic Quadrant for BI and Data Analytics
Speaking of Power BA and its momentum, industry observers are taking notice. As Kamal Hathi (General Manager, Microsoft BI) announced, the newly released Garner Magic Quadrant for Business Intelligence and Data Analytics gave Microsoft a very high score. Read the full report here.
Of course, there are many competing definitions of what constitutes a BI and Analytics platform. Note that Gartner reviewed only Power BI and certain aspects of Cortana Analytics. Reporting Services, Analysis Services and the other on-premises and cloud Microsoft BI-related solutions are not covered, such as Azure SQL Database, SQL Data Warehouse, Azure ML, Query Catalog, Cognitive Services, HDInsight, Data Lake, StreamInsight). If we take them in consideration, where will the dot be?
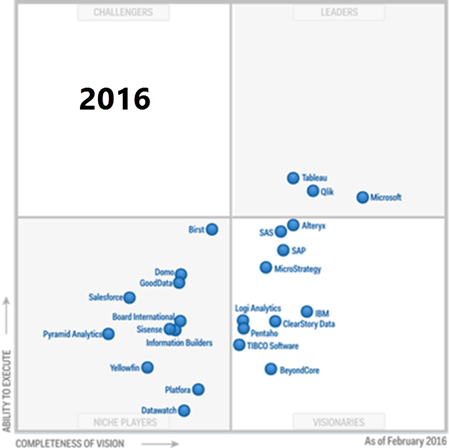
The image below shows the Microsoft’s lift between last year and this year in the Gartner magic quadrant. What a leap!
I’m surprised to find that the dot is not higher on the ability to execute, especially considering that Gartner ranked Microsoft and its main rival (Tableau) almost the same. You might also find my two-part blog about Tableau vs. Microsoft useful if you are tasked to compare these two vendors.
Understanding the 15 Critical Capabilities
As explained in the report, to evaluate vendors, Gartner uses 15 critical capabilities to support five main use cases: Agile Centralize BI Provisioning, Decentralized Analytics. Governed Data Discovery, Embedded BI, and Extranet Deployments. The following table includes my comments on each of the 15 capability.
Capability
My Rank
Teo’s Comments
Infrastructure
BI Platform Administration, Security and Architecture Capabilities that enable platform security, administering users, auditing platform access and utilization, optimizing performance and ensuring high availability and disaster recovery.
Medium to High
There are a lot of things here: Security – More work is required to support external users in Power BI, Power BI Embedded, and SSRS Administering users – Power BI supports a progressive deployment depending on the desired level of integration with Office 365 (unmanaged tenant, managing tenant, and federated AD) Auditing: Power BI supports auditing access and utilization but more work is required for proactive monitoring and improving its data governance capabilities Performance and HA: Highly-redundant and scalable backend, consisting of SSAS Tabular farm and Azure services.
Cloud BI Platform-as-a-service and analytic-application-as-a-service capabilities for building, deploying and managing analytics and analytic applications in the cloud, based on data both in the cloud and on-premises
High
Power BI supports both pure cloud and hybrid architectures depending on data volumes and security requirements. No other vendor offers both architectures.
Data Source Connectivity and Ingestion Capabilities that allow users to connect to the structured and unstructured data contained within various types of storage platforms, both on-premises and in the cloud.
High
As of this time, Power BI supports close to 70 connectors to let you connect to cloud and on-premises data sources. No scripting required.
Data Management
Metadata Management Tools for enabling users to leverage a common SOR semantic model and metadata. These should provide a robust and centralized way for administrators to search, capture, store, reuse and publish metadata objects such as dimensions, hierarchies, measures, performance metrics/key performance indicators (KPIs), and report layout objects, parameters and so on. Administrators should have the ability to promote a business-user-defined data mashup and metadata to the SOR metadata.
Medium to High
Microsoft offers an organizational BI Semantic Model (BISM) which is typically implemented as an Analysis Services Tabular or Multidimensional models. On the self-service side of things, users can create Excel or Power BI Desktop models. IT can promote a self-service Excel model to a Tabular model. Although not officially supported because Power BI Desktop is changing every month, IT can upgrade a Power BI Desktop model to a Tabular model.
Self-Contained Extraction, Transformation and Loading (ETL) and Data Storage Platform capabilities for accessing, integrating, transforming and loading data into a self-contained storage layer, with the ability to index data and manage data loads and refresh scheduling.
Medium
SSIS is the most popular on-premises ETL tool. More work is required to bring similar capabilities in the cloud (I think Azure Data Factory is a step backwards)
Self-Service Data Preparation The drag-and-drop, user-driven data combination of different sources, and the creation of analytic models such as user-defined measures, sets, groups and hierarchies. Advanced capabilities include semantic autodiscovery, intelligent joins, intelligent profiling, hierarchy generation, data lineage and data blending on varied data sources, including multistructured data
High
Power BI Desktop and Excel has a fantastic query editor (originated from Power Query) that scores big with business users. Other vendors that score high in the Magic Quadrant don’t have such native capabilities. Power BI and Excel have best of class self-modeling capabilities (much better than Tableau). Azure Query Catalog can be used for dataset autodiscovery.
Analysis and Content Creation
Embedded Advanced Analytics Enables users to easily access advanced analytics capabilities that are self-contained within the platform itself or available through the import and integration of externally developed models.
High
Not sure what is meant here by “advanced analytics capabilities”. Power BI supports Quick Insights (brute-force machine learning), integration with R, Azure Machine Learning, clustering, forecasting, binning, but I might be missing something.
Analytic Dashboards The ability to create highly interactive dashboards and content, with visual exploration and embedded advanced and geospatial analytics, to be consumed by others.
High
“Highly interactive dashboards and content” is what Power BI is all about.
Interactive Visual Exploration Enables the exploration of data via an array of visualization options that go beyond those of basic pie, bar and line charts to include heat and tree maps, geographic maps, scatter plots and other special-purpose visuals. These tools enable users to analyze and manipulate the data by interacting directly with a visual representation of it to display as percentages, bins and groups.
Medium
Power BI covers all stated requirements in this category. However, while its visualization capabilities are improving every week, more work is required to catch up with the Tableau and Qlik in some areas, such as cell drillthrough, ability to repeat visualizations, such as to nest a bar into a table, conditional binding, exression-based properties and filters, and others.
Smart Data Discovery Automatically finds, visualizes and narrates important findings such as correlations, exceptions, clusters, links and predictions in data that are relevant to users without requiring them to build models or write algorithms. Users explore data via visualizations, natural-language-generated narration, search and NLQ technologies.
Medium to High
Through Quick Insights, Power BI can automatically find correlations, outliers, and other hidden trends. It doesn’t currently have native narrative capabilities, except for the custom visual from Narrative Science. Power BI is one of the few vendors that offers natural queries.
Mobile Exploration and Authoring Enables organizations to develop and deliver content to mobile devices in a publishing and/or interactive mode, and takes advantage of mobile devices’ native capabilities, such as touchscreen, camera, location awareness and natural-language query
High
Native apps for iOS, Android and Windows to surface both Power BI and SSRS reports.
Sharing of Findings
Embedding Analytic Content Capabilities including a software developer’s kit with APIs and support for open standards for creating and modifying analytic content, visualizations and applications, embedding them into a business process, and/or an application or portal. These capabilities can reside outside the application (reusing the analytic infrastructure), but must be easily and seamlessly accessible from inside the application without forcing users to switch between systems. The capabilities for integrating BI and analytics with the application architecture will enable users to choose where in the business process the analytics should be embedded.
High
An Azure cloud service, Power BI Embedded allows you to embed reports for external users with very appealing cost-effective licensing model. On premises, SSRS offers similar capabilities.
Publish, Share and Collaborate on Analytic Content Capabilities that allow users to publish, deploy and operationalize analytic content through various output types and distribution methods, with support for content search, scheduling and alerts. Enables users to share, discuss and track information, analysis, analytic content and decisions via discussion threads, chat and annotations.
High
Power BI supports subscriptions and data alerts but we can do better, such as to allow an admin to subscribe other users. Power BI workspaces and groups allow users to share BI artifacts, participate in discussion lists, and share calendars. Power BI Mobile allows users to annotate reports.
Overall platform capabilities
Platform Capabilities and Workflow This capability considers the degree to which capabilities are offered in a single, seamless product or across multiple products with little integration.
Medium to High
The integration hub is Power BI Service which integrates Power BI reports, Excel reports, SSRS reports. More work is required on integration with Excel reports that connect to SSAS models.
Ease of Use and Visual Appeal Ease of use to administer and deploy the platform, create content, consume and interact with content, as well as the visual appeal.
High
As far as deployment, Power BI is “five seconds to sign up, five minutes to wow!” As far as the visual appeal, beauty is the eye of the beholder but Power BI has done respectable job to follow best visualization practices.
MS BI Events in Atlanta
Atlanta MS BI and Power BI Group: “Comparing Power BI to Tableau” presentation by Slalom Consulting on 3/27
Atlanta MS BI and Power BI Group: “Using Power BI with Visual Studio Team Services” on 4/24.
As you’d probably agree, the BI landscape is fast-moving and it might be overwhelming. If you need any help with planning and implementing your next-generation BI solution, don’t hesitate to contact me. As a Microsoft Gold Partner and premier BI firm, you can trust us to help you plan and implement your data analytics projects, and rest assured that you’ll get the best service.
Regards,
Teo Lachev Prologika, LLC | Making Sense of Data Microsoft Partner | Gold Data Analytics
I hope you’re enjoying the holiday season. I wish you all the best in 2017! The subject of this newsletter came from a Planning and Strategy assessment for a large organization. Before I get to it and speaking of planning, don’t forget to use your Microsoft planning days as they will expire at the end of your fiscal year. This is free money that Microsoft gives you to engage Microsoft Gold partners, such as Prologika, to help you plan your SQL Server and BI initiatives. Learn how the process works here.
Just like a data warehouse, Operational Data Store (ODS) can mean different things for different people. Do you remember the time when ODS and DW were conflicting methodologies and each one claimed to be superior than the other? Since then the scholars buried the hatchet and reached a consensus that you need both. I agree.
To me, ODS is nothing more than a staging database on steroids that sits between the source systems and DW in the BI architectural stack.
What’s Operational Data Store?
According to Wikipedia “an operational data store (or “ODS”) is a database designed to integrate data from multiple sources for additional operations on the data…The general purpose of an ODS is to integrate data from disparate source systems in a single structure, using data integration technologies like data virtualization, data federation, or extract, transform, and load. This will allow operational access to the data for operational reporting, master data or reference data management. An ODS is not a replacement or substitute for a data warehouse but in turn could become a source.”
OK, this is a good starting point. See also the “Operational Data Source (ODS) Defined” blog by James Serra. But how do you design an ODS? In general, I’ve seen two implementation patterns but the design approach you take would really depends on how you plan to use the data in the ODS and what downstream systems would need that data.
One to One Pull
ODS is typically implemented as 1:1 data pull from the source systems, where ETL stages all source tables required for operational reporting and downstream systems, such loading the data warehouse. ETL typically runs daily but it could run more often to meet low-latency reporting needs. The ETL process is typically just Extract and Load (it doesn’t do any transformations), except for keeping a history of changes (more on this in a moment). This results in a highly normalized schema that’s the same is the original source schema. Then when data is loaded in DW, it’s denormalized to conform to the star schema. Let’s summarize the pros and cons of the One:one Data Pull design pattern.
Pros
Cons
Table schema
Highly normalized and identical to the source system
The number of tables increase
Operational reporting
Users can query the source data as it’s stored in the original source. This offloads reporting from the source systems
No consolidated reporting if multiple source systems process same information, e.g. multiple systems to process claims
Changes to source schema
Source schema is preserved
Additional ETL is required to transform to star schema
ETL
Extraction and load from source systems (no transformations)
As source systems change, ETL needs to change
Common Format
This design is preferred when the same business data is sourced from multiple source systems, such as when the source systems might change or be replaced over time. For example, an insurance company might have several systems to process claims. Instead of ending up with three sets of tables (one for each source system), the ODS schema is standardized and the feeds from the source systems are loaded into a shared table. For example, a common Claim table stores claim “feeds” from the three systems. As long as the source endpoint (table, view, or stored procedure) returns the data according to an agreed “contract” for the feed, ODS is abstracted from source system changes. This design is much less normalized. In fact, for the most part it should mimic the DW schema so that DW tables can piggy back on the ODS tables with no or minimum ETL.
Pros
Cons
Table schema
Denormalized and suitable for reporting
The original schema is lost
Operational reporting
Relevant information is consolidated and stored in one table
Schema is denormalized and reports might not reflect how the data is stored in the source systems
Schema changes to source systems
As long as the source endpoints adhere to the contract, ODS is abstracted from schema changes
A design contract needs to be prepared and sources systems need to provide the data in the agreed format
ETL
Less, or even no ETL to transform data from ODS to DW
ETL needs to follow the contract specification so upfront design effort is required
Further Recommendations
Despite which design pattern you choose, here are some additional recommendations to take the most of your ODS:
Store data at its most atomic level – No aggregations and summaries. Your DW would need the data at its lowest level anyway.
Keep all the historical data or as long as required by your retention policy – This is great for auditing and allows you to reload the DW from ODS since it’s unlikely that source systems will keep historical data.
Apply minimum to no ETL transformations in ODS – You would want the staged data to keep the same parity with the source data so that you can apply data quality and auditing checks.
Avoid business calculations in ODS – Business calculations, such as YTD, QTD, variances, etc., have no place in ODS. They should be defined in the semantic layer, e.g. Analysis Services model. If you attempt to do so in ODS, it will surely impact performance, forcing to you to pre-aggregate data. The only permissible type of reporting in ODS is operational reporting, such as to produce the same reports as the original systems (without giving users access to the source) or to validate that the DW results match the source systems.
Maintain column changes to most columns – I kept the best for last. Treat most columns as Type 2 so that you now when a given row was changed in the source. This is great for auditing.
Here is a hypothetical Policy table that keeps Type 2 changes. In this example, the policy rate has changed on 5/8/2010. If you follow this design, you don’t have to maintain Type 2 in your DW (if you follow the Common Format pattern) and you don’t have to pick which columns are Type 2 (all of them are). It might be extreme but it’s good for auditing. Tip: use SQL Server 2016 temporal tables to simplify Type 2 date tracking.
Atlanta MS BI Group: Presentation and sponsorship by SolidQ on 2/27.
As you’d probably agree, the BI landscape is fast-moving and it might be overwhelming. If you need any help with planning and implementing your next-generation BI solution, don’t hesitate to contact me. As a Microsoft Gold Partner and premier BI firm, you can trust us to help you plan and implement your data analytics projects, and rest assured that you’ll get the best service.
Regards,
Teo Lachev Prologika, LLC | Making Sense of Data Microsoft Partner | Gold Data Analytics
 At least five of the top 10 IT trends in 2019 identified by Gartner involve machine learning in one form or the other. The list includes autonomous things, augmented analytics, AI-driven development, digital twins, and immersive experience. Gartner also predicts that by 2022, at least 40 percent of new application development projects will have machine learning (ML). Therefore, it’s not surprising to see vendors making huge investments in predictive analytics. This newsletter focuses on two important Power BI enhancements for ML that will be available for public review soon: AutoML and integration with Azure Predictive Analytics services (Azure ML and Cognitive Services).
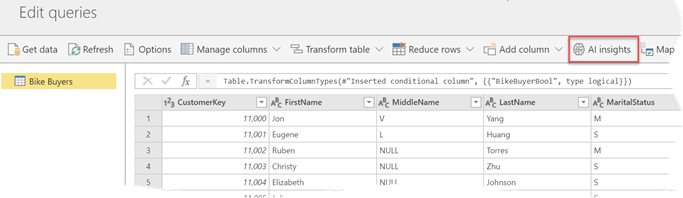


 Happy Holidays! I hope you’re enjoying this special time of the year. According to
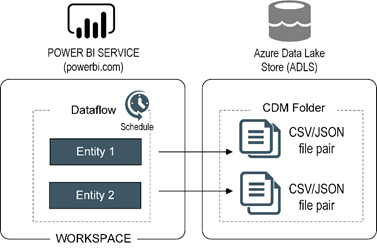
 Semantics relates to discovering the meaning of the message behind the words. In the context of data and BI, semantics represents the user’s perspective of data: how the end user views the data to derive knowledge from it. A modeler translates the machine-friendly database structures and terminology into a user-friendly semantic model that describes the business problems to be solved. To address this need, you create a semantic model. In my “
 BI and data integration projects often benefit from an operational data source (ODS), whose benefits and design I discussed in my “
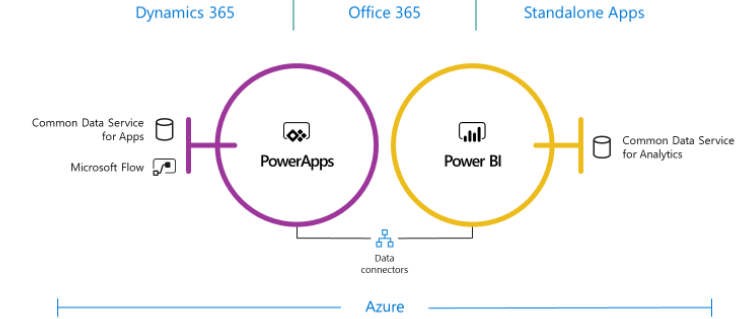
 With hundreds of vendors out there, choosing a BI tool isn’t easy. If you’ve been following me for a while, you know that I love Power BI. One of the Power BI most prominent strengths is that it’s a part of the much broader Microsoft Data Platform that spans various on-premises and cloud offerings for data storage, processing, and analysis. Thanks to this integration, you can implement real-time dashboards, extend your Power BI reports with predictive capabilities, integrate with Big Data, and much more. In this newsletter, I’ll talk about an exciting integration option: extending Power BI with business applications, thanks to its integration with PowerApps and Flow. And if you happen to be in the Microsoft office in Alpharetta, feel free to ask for a demo of the Power BI Writeback that Prologika prepared and deployed to the Microsoft environment. You’ll be directed to one of the big screens when you can test the report that I mention in this newsletter.
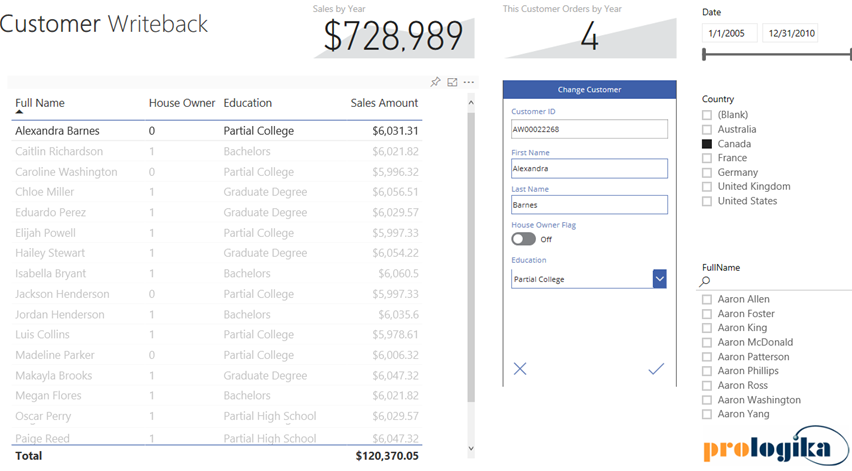
 hope you’re enjoying this special time of the year – time for sharing and giving. Speaking of sharing, how does your company share BI artifacts with your B2B or B2C partners? Do you still send Excel spreadsheets or embed canned SSRS reports? If so, Power BI offers a better sharing model and I’ll show you how in this letter. And about Power BI, I’m proud to announce that the third revision of my “Applied Power BI Book” should be out in a week or so. Thoroughly updated to reflect the latest of the ever-changing cloud world of Power BI and featuring 20% new content, this book is the self-study resource your organization needs to master Power BI.
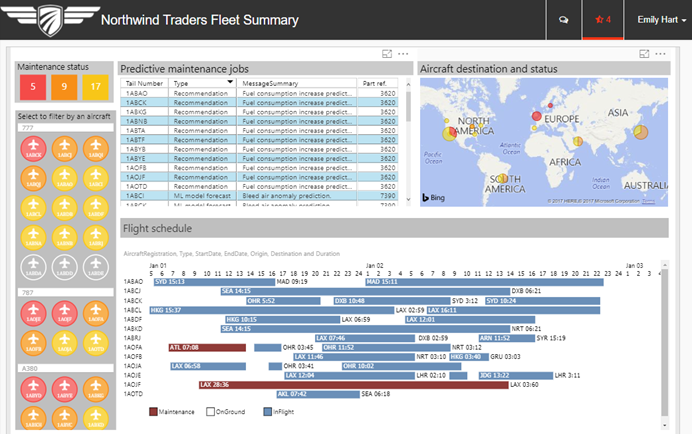
 As I’m writing this newsletter, Florida and Georgia (I live in Atlanta, GA) are in the midst of planning for hurricane Irma, which is expected to be one of the
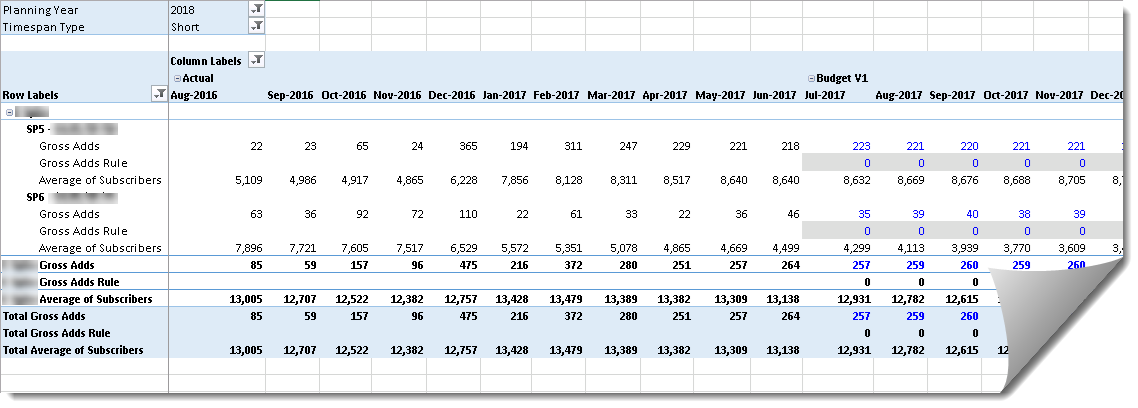

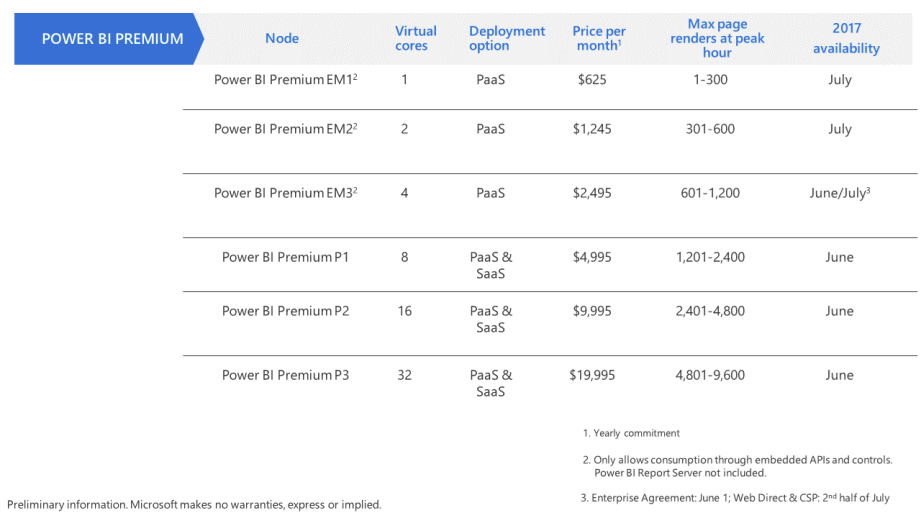
 I hope you’re enjoying the beginning of 2017 and you’re staying healthy and busy. It’s been a hectic and exciting period for me. I published the second edition of my “Applied Microsoft Power BI”