Load testing and troubleshooting Analysis Services often requires capturing a query trace. The lightweight option to do so is to create an Extended Events (xEvents) session. Let’s say you want to capture all query traffic for 24 hours. You might opt to use the SQL Server Profiler, but it’s implemented as a desktop app (there must be an active Windows session but what happens if the Profiler crashes or corporate policy logs you out?) and it may impact the performance of your production server. The recommend way is to set up an xEvents session that logs the required events (same events you see in SQL Server Profiler) to a *.xel file.
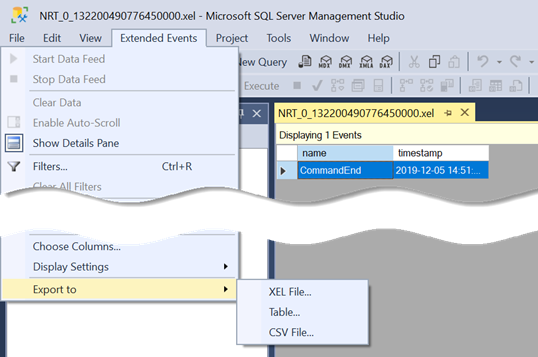
What’s not so obvious is how to analyze the file. The easiest way is to open the .xel file in SQL Server Management Studio (SSMS). You’ll see a new Extended Events menu added to the menu bar. Among other things, this menu allows you to export the trace to a SQL Server table!
What makes an xEvents session even more useful is that it allows you to correlate events. For example, for some obscure reason the Analysis Services PropertiesList info is only available in the QueryBegin event. However, capturing the QueryEnd event is good enough because it gives you all the info you need, such as the query duration, query statement, database name, etc. But what if queries come from a Power BI report via a gateway to an on-prem SSAS instance? In this case, the user identity is in the PropertiesList info because the gateway uses a trusted account to connect to SSAS. So, now you must capture QueryBegin if you want to know who sent the query. Fortunately, you can use the RequestID GUID column in the trace to correlate QueryBegin with QueryEnd to look up the username from the QueryBegin row and to add it to the QueryEnd event.
At Ignite 2019 Microsoft announced the public preview of large datasets in Power BI Premium. This is a significant milestone as now datasets can grow up to the capacity’s maximum memory (previously, the max size was 10 GB with P3 plan), thus opening the possibility of deploying organizational semantic models to Power BI. I consider this feature mostly suitable for organizational BI as I don’t imagine business users dealing with such large data volumes. I tested large datasets during its private preview, and I’d like to share some notes.
The Good
Today, BI developers can deploy organizational semantic models to three Analysis Services Tabular SKUs: SQL Server Analysis Services, Azure Analysis Services, and now Power BI Premium. SQL Server Analysis Services is the Microsoft on-prem offering and it aligns with the SQL Server release schedule. Traditionally, Azure Analysis Services has been the choice for cloud (PaaS) deployments. However, caught in the middle between SQL Server and Power BI, the AAS future is now uncertain given that Microsoft wants to make Power BI as your one-stop destination for all your BI needs. From a strategic perspective, it makes sense to consider Power BI Premium for deploying organizational semantic models because of the following main benefits:
Always on the latest – Both AAS and SQL Server lag in features compared to Power BI Premium. For example, composite models and aggregations are not in SQL Server 2019 and Azure Analysis Services. By deploying to Power BI, which is also powered by Analysis Services Tabular, your models will always be on the latest and greatest.
Feature parity – As I explain in my “Power BI Feature Discrepancies for Data Acquisition” blog, some Power BI features, such as Quick Insights, Explain Increase/Decrease, Power Query, are not supported with live connections to Analysis Services. By hosting your models in Power BI Premiums, these features are now supported because Power BI owns the data, just like you import data in Power BI Desktop and then publish the model.
The Bad
As a Power BI Premium feature, large datasets will require planning and purchasing a premium capacity. Given that you need at least twice the memory to fully process a model (less memory should be required if you process incrementally), you must size accordingly. For example, a 15 GB model would require at least 30 GB of memory to fully process, bringing you into the P2 plan territory. Memory is the most important constraint for Tabular. Unlike SQL Server, which doesn’t license by memory (you can add as much memory you like without paying a dime more in licensing fees), Power BI Power BI Premium plans cap the capacity memory. So, you’ll end up having a dedicated P1 or P2 plan for hosting your organizational semantic model, and another P plan(s) for self-service BI.
I’d like to see elastic scaling happening to Power BI Premium at some point in future. Instead of boxing me into a specific plan, which more than likely will be underutilized, I’d like to see Power BI Premium scaling up and down on demand. This should help lowering the cost.
The Ugly
The lack of DevOps in Power BI Premium will put another hole into your budget. Unlike SQL Server, where you pay only for production use, no special DEV or QA environments and licensing options exist in Power BI Premium. So, you must plan for additional premium capacities, such as for three separate capacities: PROD, DEV, and QA (I know of organizations that need many more DevOps environments). At this price point, even large organizations will reconsider the licensing cost of hosting their models in Power BI. How about leaving QA and DEV on prem? This would require coding for the least common denominator which defeats the benefit of deploying to Power BI Premium. You can get innovative and attempt to reduce licensing cost by purchasing Azure A plans for DEV and QA and stopping the A capacities when they are not in use, but I wonder how many organizations will be willing to go through the pain of doing this. The Cloud should make things easier, right?
Large datasets will open another deployment option for hosting organizational semantic models. This might be an attractive option for some organizations and ISVs. Others will find that staying on-prem could lower their licensing cost. Once the Power BI Premium XMLA endpoint supports write operations (promised for December 2019 in the roadmap), BI developers can use a tool of their choice, such as Tabular Editor or Visual Studio (I personally find Power BI Desktop not suitable for organizational model development, mainly because of its slow performance, lack of source control and extensibility) to develop and deploy semantic models that are always on the latest features and unifying BI on a single platform: Power BI.
https://prologika.com/wp-content/uploads/2016/01/logo.png00Prologika - Teo Lachevhttps://prologika.com/wp-content/uploads/2016/01/logo.pngPrologika - Teo Lachev2019-11-10 10:24:122019-11-10 10:24:12Power BI Large Datasets: The Good, the Bad, and the Ugly
If “XMLA” doesn’t ring a bell especially in the context of Power BI, it stands for Extensible Markup Language for Analysis. Still puzzled? It’s the protocol of Analysis Services (Multidimensional and Tabular). So, when an Excel or Power BI sends a query to a cube, it’s encoded according the XMLA specification (an XML-based format). And, the XMLA endpoint is the web service endpoint that Analysis Services listens for upcoming requests.
Now that I cleared the terminology, Microsoft announced the public preview of the XMLA endpoint in Power BI Premium. Since Power BI uses Analysis Services Tabular to scale and hosts the Power BI Desktop models you deploy, this means you can now access that Analysis Services backend instance which wasn’t accessible before. Or, at least read-only for now, meaning that you can only query it and not deploy organizational Tabular models to it.
What it’s in there for you? Here are some scenarios that this management feature enables:
Besides Excel, you can connect any client that support Analysis Services, such as Tableau, to your published Power BI datasets if you’re looking for ways to diversify reporting. Chris Finlan mentions this as one scenario worth considering for the near-and-dear to my heart Report Builder (aka Power BI Paginated Report Builder).
You can profile your Power BI published datasets by connecting the SQL Server Profiler.
You can stress test your Power BI datasets, such as to ensure that they support the expected workload.
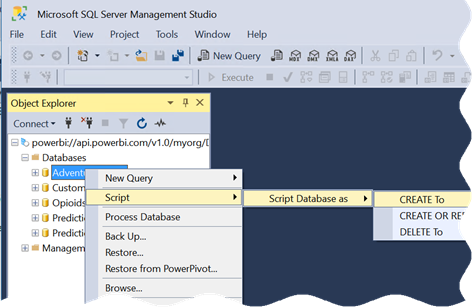
And my favorite, I can script any Power BI model to see how all these hidden features, such as grouping and binning, are coded.
Microsoft is probably finding it increasingly difficult to maintain multiple deployments for Analysis Services: SSAS, AAS, and Power BI. Once the Power XMLA endpoint is writable and Power BI dataset sizes increase, I expect them to nudge customers to deploy organizational Tabular models to Power BI Premium, to be on the latest and greatest on a single platform. I hope that it won’t require Power BI Premium too when it goes GA.
Analysis Services normally requires a live connection between the client and server. If the connection is interrupted, the server considers that the client has lost interest and cancels the running operation.Strictly speaking, there is a ‘long running operations’ (LRO) protocol built over the HTTP XMLA messaging protocol which mitigates the issue of disconnects by attempting to keep alive the request/responses. This helps avoid the HTTP disconnection problem for the client libraries and improve the reliability of client applications. But in the end, your mileage will vary depending on the reliability of the networks in between the client machine and the service endpoint.
You don’t have to worry about the connection quality when you send queries as they usually execute fast. Processing, however, is a different story as it might take very long. As a reference point, a 4 billion database can take easily half a day to refresh. Babysitting processing and hoping that the client doesn’t lose the connection, or that SSMS (or whatever management client you use) doesn’t crash is not fun. Not to mention that such issues might not be immediately evident. For example, a few times when we attempted to process the afore mentioned database, SSMS either hung or crashed at the end of the processing task with errors such as “The operation has been cancelled”. You can easily waste hours and even days to restart failed processing and this can get frustrating.
Is it possible to fire and forget processing tasks? If you use Azure Analysis Services (AAS), you’re in luck.
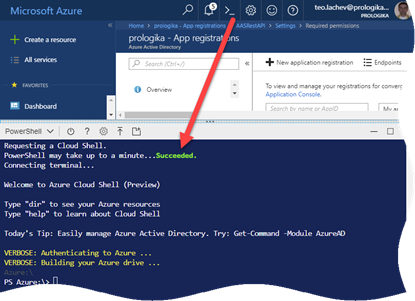
AAS supports processing tasks asynchronously with REST APIs. The difference is that the service component (REST API) maintains the connectivity to the server – thus reducing the chances of HTTP disconnections from the external application. Microsoft has provided a RestAPISample console app to help you get started. As with any REST API invocation, you’d need to register the app in the Azure Portal so that you can authenticate successfully. Other than that, it’s simple to invoke the REST API and Microsoft has provided step-by-step instructions.
Another, although synchronous, option is to run a PowerShell script in the Azure Cloud Shell environment. You can upload the script as a file. The script can ask you to provide credentials interactively (Get-Credentials method) or you can hardcode the credentials. Here is an example of a PowerShell script that processes a specific table.
Of course, the PowerShell option is not immune to connection interruptions but the hope is that because you’re running it on Azure, the connection would be more stable compared to initiating it on your laptop. And you’re offloading the task to Azure so you don’t have to install or run anything locally.
None of the Multidimensional and Tabular semantic models I’ve implemented required scaling out, but I understand that some scenarios might benefit from it, such as B2B or B2C reporting. Depends on the implementation approach, another benefit could be implementing a highly available farm. Implementing a scaled-out, on-premises SSAS farm is not easy. There are different techniques but all of them involve a compromise between availability and latency. Azure Analysis Services sought to make this easier. It’s as easy as changing a slider and AAS synchronizes everything somehow, right? Wrong. Here are the high-level notes of how AAS synchronization works:
As a part of configuring synchronization, you can specify a designated processing node. If you do specify a processing node, processing takes place on that node only and the updated cache is distributed to the query nodes. If you don’t specify a processing node, one of the query nodes handles both processing and querying. The node that handles processing is referred to as a primary node.
AAS synchronization is not automatic. You’re responsible to initiate the synchronization step, either manually from the Azure portal or automated by using Sync-AzureAnalysisServicesInstance from PowerShell, or using the REST API for Azure AS. This means that every time you process the model, you’d need to use one of these mechanisms to sync the model with the query nodes.
When the sync command is initiated, AAS copies the entire AS database from the primary node to blob storage. That’s because the primary (read/write) node is on a different copy than the query nodes so that it can be updated without effecting end-user queries. The file copy happens inside the blob storage (no network traffic is involved). Additional details about the file copy process:
Multi-threaded (unlike the SSAS sync wizard)
Hydrates multiple replicas from a single data folder
The data folder is striped for better I/O
Once the updated database (all files) are copied to the blob storage, the query nodes detach the old copy and attach to the new one.
AAS waits until the model is fully loaded into memory and available for queries before making the copy (replica) online.
How fast is the sync process? We measured with a 50 GB database and it took 20 minutes for the sync process to complete. I guess most time was spent in the last step. So, as it stands, AAS synchronization is more suitable for predictable processing windows, such as in the “classic” case where ETL processes and synchronizes the model once per day, outside working hours. It might not work well for real-time solutions, where new data might arrive throughout the day and business requirements call for minimum latency because you might not have enough time for the file copy to complete.
Another gotcha that we ran into was that there seems to be an issue with the metrics reporting and a scale-out farm. During load testing we saw that the average QPU of a two-node farm (S4 performance tier with max QPU of 400) showed saturation at 200 average QPU. It looks like the Azure portal collects 400 from each node and then divides by the number of nodes. We raised the issue to Microsoft and probably it will addressed soon.
Scaling out is not about reducing query times. It’s about handling more load when scaling up doesn’t go enough. When you scale out to a two-node farm, you’re still limited by the resource constraints (memory, CPU) of each node. Unless you are after a highly available BI solution, scaling out should be your last option. Time spent in optimizing your model design, data storage, and queries is usually much more productive than taking the easy way out and throwing more hardware (and money).
This blog explained how AAS synchronization works. I hope Microsoft will offer more options in future to make it more useful. A welcome enhancement would be the ability to configure an automatic and less granular synchronization, such as to copy only the files that have changed.
Object-level security (OLS) is a frequently requested security feature when implementing semantic models. For example, a current project disallows some sales persons to see sensitive measures, such as Margin and Profit. In Multidimensional, modelers could use cell security to meet such requirements with the risk of compromising performance. Starting with SQL Server 2017 (compatibility level 1200), Tabular supports object-level security to disallow access to entire tables or specific columns without a performance penalty. As it stands, OLS has the following limitations (for a full list, review the documentation):
There is no user interface for defining OLS. Instead, after defining your roles and row filters as you’d typically do, you need the extra step to open the model.bim source code and enter the OLS definition manually. For example, this Users role definition disallows access to the GrossProfit column. Fortunately, SSDT preserves OLS when you make changes to the role in the Role Editor and save. “roles”: [ {
“name”: “Users”,
“description”: “All allowed users to query the model”,
“modelPermission”: “read”,
“tablePermissions”: [
{
“name”: “Reseller Sales”,
“columnPermissions”: [
{
“name”: “Gross Profit”,
“metadataPermission”: “none”
}] }
] }
Unlike Multidimensional cell security, Tabular OLS doesn’t support specifying additional or different conditions that apply to OLS only within the same role. For example, you can’t have a single role that applies one condition (row filter) for data-level security and another condition for object-level security. In other words, OLS inherits the row filters defined in the role. Because of these limitations, security requirements might force you to create multiple roles, such as a Sales RLS role for sales people who can see all columns, and “Sales OLS” role for sales people that are disallowed access to some columns even if the same row filters apply.
OLS enforces access to physical columns only. You can’t secure measures directly. If you need to secure a measure, you need to secure a base column that the measure uses either directly or indirectly.
There is a current bug that we ran into regarding drillthrough and OLS. If a user belongs to a role that defines OLS and the user drills through any column in the secured table, Tabular generates this error:
The ‘<sensitivecolumnname>’ column cannot be found in the ‘$<tablename>’ table.
Microsoft has promised a fix in the next cumulative update. UPDATE 4/24/2018 – This issue was fixed in CU6 of SQL Server 2017.
Use Tabular object-level security to protect sensitive columns or exclude entire tables. Coupled with row-level security (RLS), OLS allows you to implement both data and metadata restrictions, subject to the limitations I discussed in this blog.
As a part of a semantic model assessment, I got to experiment with different configurations of Azure Analysis Services. In this case, the largest fact table has almost 2 billion rows so it’s a good size model. I was particularly interested the correlation between a higher performance tier and query performance. One thing that I like about PaaS is that it’s easy to change and experiment with different configurations. The thing that I don’t like is that I can’t peek under the hood. This is probably done on purpose to keep people like me out, just like these green nets surrounding construction zones. So, I don’t know what hardware AAS is running on and how it’s configured. And I failed to get clarification from Microsoft. So, I might be out of line here, but I thought my findings are worth sharing albeit not officially vetted.
AAS Basic and Standard tiers are advertised as dedicated tiers running on dedicated virtual machines preconfigured with a certain number of cores that are a 20x multiple of the tier QPUs. For example, S2 tier (200 QPUs) comes with 10 cores while S9 (640 QPUs) comes with 32 cores. If you examine the advanced properties of the AAS instance in SSMS, you’ll see Group Affinity masks that confirms this. For example, the mask for S2 is x3FF (or xFFC) which converted to binary is 1111111111, whereas the mask for S9 is FFFFFFFFFFFF for 32 1’s. I don’t know why masks are used given that the VM has already a predefined number of cores. One, and most probable, explanation is that Microsoft co-hosts multiple Analysis Services instances on the same VM. When you provision a new AAS instance, Azure finds a VM that has enough capacity and spins the new service there. If you upgrade AAS, it could get relocated to a different VM if the old one doesn’t have enough capacity. Or, Microsoft might allocates more cores to the VM and a subset to AAS.
Anyone who’s done parallel programming knows that it’s not easy. Safe access and locks need to be used to synchronize access and protect shared resources. The AS xVelocity engine (aka Vertipaq) is a multi-threaded application that accesses RAM as a shared resource. As each thread competes for a global lock for memory allocation/deallocation, scalability decreases. Because processor cores reserve memory in chunks, called cache lines, additional synchronization is required when threads access memory location that are close to each other. Before SQL Server 2016 SP1, this was a serious issue with Tabular. As we’ve learned, starting with SQL Server 2016 SP1, Microsoft switched to using the Intel Threading Building Clocks (TBB) C++ library. Specifically, Tabular now uses the TBB scalable memory allocator. Mind you that TBB is not a CPU-specific extension so any modern Intel CPU should get these benefits. “Analysis Services SP1 uses an Intel TBB-based scalable allocator that provides separate memory pools for every core. As the number of cores increases, the system can scale almost linearly” and “The Intel TBB-based scalable allocator is also expected to help mitigate performance problems due to heap fragmentation that have been shown to occur with the Windows Heap”. Further, starting with SP1, Tabular is NUMA aware with 4-node NUMA system but I don’t know if the AAS VMs are preconfigured for NUMA.
These changes seem to be very beneficial and I do see the promised linear scalability (or close to it) as the number of cores increase. After all, how would you explain a customer that the query times remain the same when they switch to a higher tier? I used this query as a sample query to measure the memory scan performance (the filter is used to prevent Tabular short-circuiting the count by using internal statistics):
The day_id column has a 2.5 GB of total column size with 875 distinct values. The query execution time decreased 2.5 times when switching from S2 to S9, while the storage engine scan time decreased 3 times. Of course, more complicated queries would carry additional overhead in the formula engine which as we know is single threaded.
AAS Tier
Storage Engine Parallelism
Storage Engine Time (ms)
Total Execution Time (ms)
S2 (200 QPUs)
9x
1,563
1,922
S9 (640 QPUs)
29x
516
812
Tabular does an excellent job parallelizing the storage engine queries and maxing out all available cores in short bursts of time. Staring with SQL Server 2016 SP1, you should see substantial performance gains as the number of cores increase if the query is storage engine bound (which it will probably be with larger models).
I plan to update this blog when results from official load testing we plan to do with this semantic model are available.
https://prologika.com/wp-content/uploads/2016/01/logo.png00Prologika - Teo Lachevhttps://prologika.com/wp-content/uploads/2016/01/logo.pngPrologika - Teo Lachev2018-04-04 09:35:172018-04-10 18:30:12Notes on Analysis Services Performance and Parallelism
Incremental data refresh: Organizations can use incremental data refresh to scale datasets to even larger sizes. With incremental data refresh, users can load only new or changed data. When creating a dataset in the Power BI Desktop, a user configures a refresh table for each table in the model that is to load incrementally, and then publishes it to a Power BI Premium workspace. Thereafter, each scheduled refresh loads only new or changed data.
Query acceleration for large datasets (Public Preview): Users can create DirectQuery models over any size data in sources, such as Spark and Azure SQL Data Warehouse, and then accelerate common queries by building in-memory aggregations over some of the data. Common queries use the aggregated cache to return results in a fraction of a second instead of directly querying the source. Users can create datasets of massive size and still provide interactive querying.
Why is this important? Because important professional features have crossed the Analysis Services-Power BI line and now business users can build large-scale models using Power BI Desktop. In fact, it looks like “in-memory aggregations” would come first to Power BI as we don’t have them in Analysis Services (yet). Now, I’m not a big proponent of business users building “massive” models (such datasets should be centralized and sanctioned by professionals) but apparently there is a good case for it. In fact, in my “Why Business Like Yours Choose Power BI Over Sisense” blog, I mentioned that SiSense uses this as a competitive advantage. At that time, the maximum Power BI dataset size was 1 GB. If you wanted to build larger models, you had to use Analysis Services, which has a separate price tag, and requires Visual Studio for development. Not to mention that you have to migrate your models from Power BI Desktop to Analysis Services (supported in AAS but not officially supported with on-premises SSAS) and learn new skills.
A lot has changed since. Notably, Power BI Premium raised the maximum dataset size to 10 GB and it’s likely that this limit would be raised further. While I’m not ready to embrace Power BI Desktop for organizational semantic models yet, soon Power BI Premium users will have the option to use a business-user friendly tool (Power BI Desktop) for implementing larger semantic models. And, of course, another important motivation to take this path is reducing licensing cost.
https://prologika.com/wp-content/uploads/2016/01/logo.png00Prologika - Teo Lachevhttps://prologika.com/wp-content/uploads/2016/01/logo.pngPrologika - Teo Lachev2018-03-21 22:24:532018-04-09 16:15:22Power BI Models Scaling Up
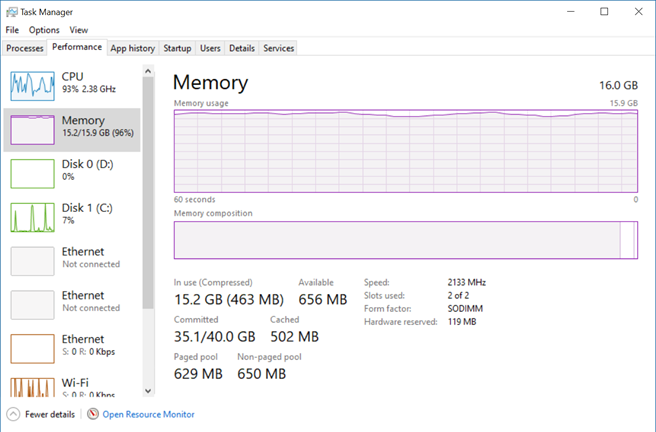
I’m doing an assessment of a data mart and semantic layer for an organizational BI solution. I was given the source of the Analysis Services Tabular model. Upon opening it locally, it took Visual Studio several minutes to open the project. Even worse, after the project was finally loaded, my laptop CPU utilization went into 80-90% and all the 16 GB of memory got exhausted rather quickly. With an empty workspace database! What’s going on?
As it turned out, a business requirement asked for all measures to be in the same table. So, developers introduced a Metrics DAX calculated table and assign it as a home table for all measures organized in display folders. Nothing wrong with that. However, the number of DAX measures were 2,774! It’s common practice to “flatten” DAX measures, such as to have separate measure for time calculations: SalesAmount, SalesAmountQTD, SalesAmountYTD, and so on. This can easily result in a measure explosion, but I haven’t experienced such a performance hit before with other clients.
As it turned out, each measure requires a data structure even with no data. When you select a table in Visual Studio, Visual Studio sends a DAX query asking for the value of each measure in the table: EVALUATE CALCULATETABLE(ROW, “Measure1”, [Measure1], “Measure2”, [Measure2]… It does so because the Measure Grid shows not only the measure formulas but also their values. Currently, there is no way to suppress this query, not even if you hide the Measure Grid. When the server that hosts the workspace database receives the query, it allocates a data structure for each measure. When the query asks for thousands of measures, the server would allocate a lot of CPU and memory resources just to evaluate the query. In this case, the server would exhaust all the memory on my laptop and return an “Out of memory” exception to the client. Visual Studio doesn’t give up and switches then to evaluating each measure separately by sending separate EVALUATE CALCULATETABLE query measure by measure! Once the project is finally loaded, design performance is bad, especially in the Diagram view. Every task, even selecting a table or moving the Visual Studio window from one monitor to another, results in a CPU utilization spike and takes a few seconds until UI becomes responsive.
I asked Microsoft to introduce a switch to suppress the EVALUATE CALCULATETABLE query, such as when the Measure Grid is disabled. I personally don’t care at all about measures values in the grid and I don’t care about the measure grid at all for that matter. These values are meaningless in most cases anyway, such as when they show blank values for time calculations since there is no date context at design time.
While Microsoft is investigating and working on improving the SSDT performance, you can mitigate the performance issue with many measures by doing the following:
If possible, assign measures to multiple home tables.
Switch your project to Manual Calculation Mode (Model menu, Calculation Options, Manual Calculation). Note that manual calculation won’t process calculated columns and relationship automatically. You’d have to switch to automatic calculation or explicitly process the model with Process Default when you make design changes.
Create perspectives to reduce the number of tables in Diagram view.
Scenario: You use Azure Analysis Services and you want to trace events in the SQL Server Profiler. However, you run the Profiler, connect to AAS, and you get greeted with “Unable to locate trace definition file Microsoft Analysis Services TraceDefinition 15.0.0.xml“. The prompt gives you an option to download the trace definition from the server, but nothing happens. You’ll encounter the same issue if you attempt to access a higher version of AAS or Database Engine from a lower version of Profiler, such as when you install SSMS 2012 on your laptop, but you connect to SQL Server 2016 or higher.
Workaround: While we’re waiting for Microsoft to provide the Azure AS trace definition, you can use this workaround:
Navigate to the Profiler trace definition folder. In my case this folder is C:\Program Files (x86)\Microsoft SQL Server\140\Tools\Profiler\TraceDefinitions. Copy the latest trace definition file (in my case it was “Microsoft Analysis Services TraceDefinition 14.0.800.xml”) and paste it as Microsoft Analysis Services TraceDefinition 15.0.0.xml. You need admin privileges to do this.
Start Notepad or Notepad++ with admin rights and open Microsoft Analysis Services TraceDefinition 15.0.0.xml from that folder.
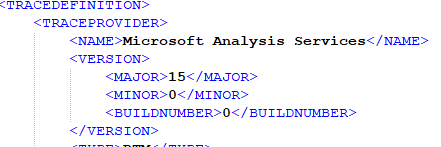
Change the Major version to 15, minor version to 0, and build number to 0 at the top of the file and save the file.
If you want the default trace templates so you don’t have to configure the trace from scratch, navigate to the Profiler’s Templates folder (C:\Program Files (x86)\Microsoft SQL Server\140\Tools\Profiler\Templates\Microsoft Analysis Services). Copy the 140 folder and paste it as 150 folder. This folder has the Replay and Standard template definitions.
As Analysis Services evolves, the version number would increase. You can connect SSMS to AAS and check its version in the server properties. In this case, version 15.0.1.245 corresponds to 150. This why the folder name is 150.
 If “XMLA” doesn’t ring a bell especially in the context of Power BI, it stands for Extensible Markup Language for Analysis. Still puzzled? It’s the protocol of Analysis Services (Multidimensional and Tabular). So, when an Excel or Power BI sends a query to a cube, it’s encoded according the XMLA specification (an XML-based format). And, the XMLA endpoint is the web service endpoint that Analysis Services listens for upcoming requests.