Fabric Semantic Modeling: The Good, the Bad, and the Ugly
In retrospect, I’d say I owe 50% of my BI career to Analysis Services and its flavors: Multidimensional, Tabular, and later Power BI. This is why I closely follow how this technology evolves. Fast forwarding to Fabric, there are no dramatic changes. Unlike the other two Fabric Engines (Lakehouse and Warehouse), Power BI datasets haven’t embraced the delta lake file format to store its data yet. The most significant change is the introduction of a new Direct Lake data access mode alongside the existing Import and DirectQuery.
The Good
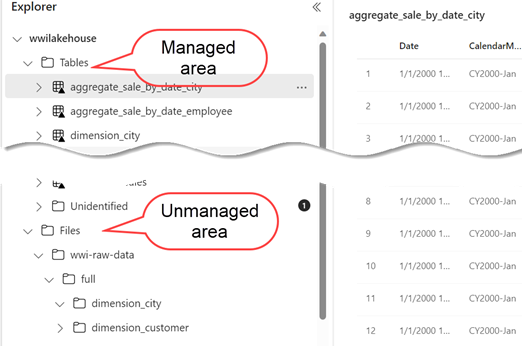
Direct Lake will surely enable interesting scenarios, such as real-time BI on top of streaming data. It requires Parquet delta lake files and therefore it’s available only when connecting to the Lakehouse managed area (Tables folder) and Warehouse tables. Given that Parquet is a columnar format, which is what Tabular VertiPaq is, basically Microsoft has changed the engine to read Parquet files as it does with its proprietary IDF file format.
The primary usage scenario is fast analysis on top of large data volumes without importing data and without delegating the query to another server. Therefore, think of Direct Lake is a hybrid between Import and DirectQuery modes. By “large data volumes”, I mean data that otherwise won’t fit into memory and/or it will require substantial time to refresh but low latency access would be preferable.
Microsoft has accomplished this feat by using the following existing and new Analysis Services features:
- Vertiscan – The ability for Analysis Services to query columnar storage. Instead of using the IDF file format to store the Vertipaq data, DirectLake instead uses the Parquet file format in Lakehouse or Warehouse. The AS engine loads the data from the Parquet files (with some extra effort) and maps the column values into (mostly) the same data structures that would have been used if the data was coming from IDF files. After that, Vertiscan is querying the data as if it was Import data, so query performance should be at par with Import mode.
- On-demand data loading – The ability to page in and out data that was introduced in 2021 for imported data. If the data needs to be paged in, there will be some delay but after that it will be fast until and unless it gets paged out later on. Chris Webb covers on-demand loading in his post On-Demand Loading Of Direct Lake Power BI Datasets In Fabric.
- V-order – an extension to the Parquet file format to get a better compression like VertiPaq
The Bad
Naturally, I’d like to see Direct Lake available outside Fabric.
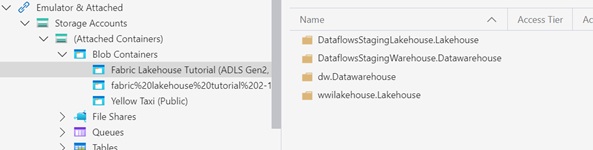
Currently, here is what needs to happen to connect to external Delta Parquet files, such as files located in ADLS:
- Create a lakehouse.
- Create a shortcut in OneLake to the external source table.
- Create the dataset on top of the lakehouse
As you can see, you can’t escape the Fabric gravitational pull to get Direct Lake. Further, the Parquet files produced by the Fabric workloads (Lakehouse/DW/etc.) will typically be faster and more compressed because of the V-order compression.
The Ugly
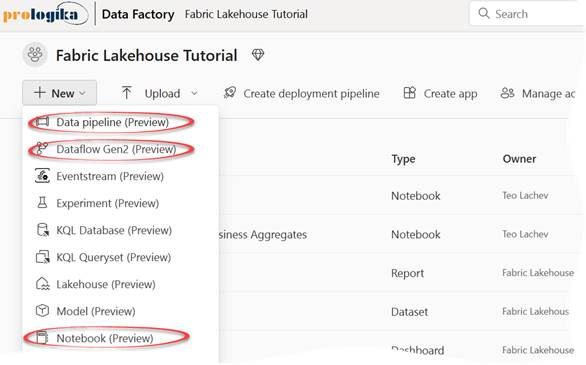
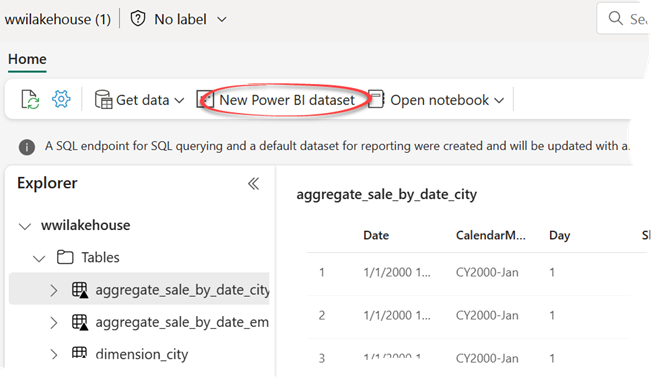
Among the Direct Lake limitations, the most significant for me is that not only you need Fabric to get Direct Lake, but also you must create the dataset online using the “New Power BI dataset” feature in Lakehouse/Warehouse, which has its own limitations.
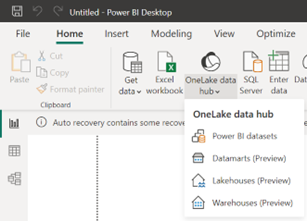
Therefore, for now you can’t use Power BI Desktop to create your semantic model that uses Direct Lake connectivity. This will require Write support to be added to the Analysis Services Power BI XMLA endpoint. However, once you create the Direct Lake dataset, you can use Power BI Desktop to connect to it using the OneLake Data Hub connector.