Notes on Analysis Services Performance and Parallelism

As a part of a semantic model assessment, I got to experiment with different configurations of Azure Analysis Services. In this case, the largest fact table has almost 2 billion rows so it’s a good size model. I was particularly interested the correlation between a higher performance tier and query performance. One thing that I like about PaaS is that it’s easy to change and experiment with different configurations. The thing that I don’t like is that I can’t peek under the hood. This is probably done on purpose to keep people like me out, just like these green nets surrounding construction zones. So, I don’t know what hardware AAS is running on and how it’s configured. And I failed to get clarification from Microsoft. So, I might be out of line here, but I thought my findings are worth sharing albeit not officially vetted.

AAS Basic and Standard tiers are advertised as dedicated tiers running on dedicated virtual machines preconfigured with a certain number of cores that are a 20x multiple of the tier QPUs. For example, S2 tier (200 QPUs) comes with 10 cores while S9 (640 QPUs) comes with 32 cores. If you examine the advanced properties of the AAS instance in SSMS, you’ll see Group Affinity masks that confirms this. For example, the mask for S2 is x3FF (or xFFC) which converted to binary is 1111111111, whereas the mask for S9 is FFFFFFFFFFFF for 32 1’s. I don’t know why masks are used given that the VM has already a predefined number of cores. One, and most probable, explanation is that Microsoft co-hosts multiple Analysis Services instances on the same VM. When you provision a new AAS instance, Azure finds a VM that has enough capacity and spins the new service there. If you upgrade AAS, it could get relocated to a different VM if the old one doesn’t have enough capacity. Or, Microsoft might allocates more cores to the VM and a subset to AAS.

Anyone who’s done parallel programming knows that it’s not easy. Safe access and locks need to be used to synchronize access and protect shared resources. The AS xVelocity engine (aka Vertipaq) is a multi-threaded application that accesses RAM as a shared resource. As each thread competes for a global lock for memory allocation/deallocation, scalability decreases. Because processor cores reserve memory in chunks, called cache lines, additional synchronization is required when threads access memory location that are close to each other. Before SQL Server 2016 SP1, this was a serious issue with Tabular. As we’ve learned, starting with SQL Server 2016 SP1, Microsoft switched to using the Intel Threading Building Clocks (TBB) C++ library. Specifically, Tabular now uses the TBB scalable memory allocator. Mind you that TBB is not a CPU-specific extension so any modern Intel CPU should get these benefits. “Analysis Services SP1 uses an Intel TBB-based scalable allocator that provides separate memory pools for every core. As the number of cores increases, the system can scale almost linearly” and “The Intel TBB-based scalable allocator is also expected to help mitigate performance problems due to heap fragmentation that have been shown to occur with the Windows Heap”. Further, starting with SP1, Tabular is NUMA aware with 4-node NUMA system but I don’t know if the AAS VMs are preconfigured for NUMA.

These changes seem to be very beneficial and I do see the promised linear scalability (or close to it) as the number of cores increase. After all, how would you explain a customer that the query times remain the same when they switch to a higher tier? I used this query as a sample query to measure the memory scan performance (the filter is used to prevent Tabular short-circuiting the count by using internal statistics):

EVALUATE CALCULATETABLE (ROW ( “result”, DISTINCTCOUNT ( ‘Table'[day_id] ) ),    ‘Table'[day_id] > 0)

The day_id column has a 2.5 GB of total column size with 875 distinct values. The query execution time decreased 2.5 times when switching from S2 to S9, while the storage engine scan time decreased 3 times. Of course, more complicated queries would carry additional overhead in the formula engine which as we know is single threaded.

AAS TierStorage Engine
Parallelism
Storage Engine Time (ms)Total Execution Time
(ms)
S2 (200 QPUs)9x1,5631,922
S9 (640 QPUs)29x516812

Tabular does an excellent job parallelizing the storage engine queries and maxing out all available cores in short bursts of time. Staring with SQL Server 2016 SP1, you should see substantial performance gains as the number of cores increase if the query is storage engine bound (which it will probably be with larger models).

I plan to update this blog when results from official load testing we plan to do with this semantic model are available.

Power BI Models Scaling Up

Chris Webb wrote a great post today “Power BI Roadmap Announcements In the Dynamics 365 Spring ’18 Release Notes” citing the many exciting new features coming to Power BI in the next few months and highlighting the huge momentum behind Power BI. I want to bring your attention to a couple of them:

  1. Incremental data refresh: Organizations can use incremental data refresh to scale datasets to even larger sizes. With incremental data refresh, users can load only new or changed data. When creating a dataset in the Power BI Desktop, a user configures a refresh table for each table in the model that is to load incrementally, and then publishes it to a Power BI Premium workspace. Thereafter, each scheduled refresh loads only new or changed data.
  2. Query acceleration for large datasets (Public Preview): Users can create DirectQuery models over any size data in sources, such as Spark and Azure SQL Data Warehouse, and then accelerate common queries by building in-memory aggregations over some of the data. Common queries use the aggregated cache to return results in a fraction of a second instead of directly querying the source. Users can create datasets of massive size and still provide interactive querying.

Why is this important? Because important professional features have crossed the Analysis Services-Power BI line and now business users can build large-scale models using Power BI Desktop. In fact, it looks like “in-memory aggregations” would come first to Power BI as we don’t have them in Analysis Services (yet). Now, I’m not a big proponent of business users building “massive” models (such datasets should be centralized and sanctioned by professionals) but apparently there is a good case for it. In fact, in my “Why Business Like Yours Choose Power BI Over Sisense” blog, I mentioned that SiSense uses this as a competitive advantage. At that time, the maximum Power BI dataset size was 1 GB. If you wanted to build larger models, you had to use Analysis Services, which has a separate price tag, and requires Visual Studio for development. Not to mention that you have to migrate your models from Power BI Desktop  to Analysis Services (supported in AAS but not officially supported with on-premises SSAS) and learn new skills.

A lot has changed since. Notably, Power BI Premium raised the maximum dataset size to 10 GB and it’s likely that this limit would be raised further. While I’m not ready to embrace Power BI Desktop for organizational semantic models yet, soon Power BI Premium users will have the option to use a business-user friendly tool (Power BI Desktop) for implementing larger semantic models. And, of course, another important motivation to take this path is reducing licensing cost.

Atlanta MS BI and Power BI Group Meeting on March 26th

MS BI fans, join us for the next Atlanta MS BI and Power BI Group meeting on Monday, March 26th at 6:30 PM. Leo Furlong will introduce you to implementing organizational semantic models with Azure Analysis Services. BlueGranite will sponsor the meeting. And your humble correspondent will demo several latest Power BI features: persistent filters, tooltip pages, and share to anyone. For more details, visit our group page and don’t forget to RSVP (use the RSVP survey on the group page) if you’re planning to attend.

Presentation:Introduction to Azure Analysis Services
Date:March 26, 2018
Time6:30 – 8:30 PM ET
Place:South Terraces Building (Auditorium Room)

115 Perimeter Center Place

Atlanta, GA 30346

Overview:Azure Analysis Services (AAS) is an exciting tool within the Azure Data Services tool set. In this session, we’ll learn about the basics of AAS including how to create the service in the Azure portal, options for developing solutions and deploying them, processing data, scaling up and out, security, pricing, and where AAS fits in an overall modern data architecture. At the end of this session, you’ll have a basic understanding of how to get started with the tool and know how it could fit in your organization.
Speaker:Leo Furlong is an experienced Data and Analytics Principal at BlueGranite with extensive experience implementing Digital Transformation Strategy using on-premise and Azure cloud technologies.
Sponsor:At BlueGranite we help our clients utilize data as a strategic asset, delivering data architecture and data integration solutions to drive insights and analytics across your organization. Our solutions monitor trends, measure performance, and provide real-time analytics for rapid, informed decision making. We leverage industry leading technology from Microsoft to build modern data platforms that reduce operating costs, increase market share, improve workforce efficiency, and so much more.


092417_1708_AtlantaMSBI1.png

Too Many Measures?

I’m doing an assessment of a data mart and semantic layer for an organizational BI solution. I was given the source of the Analysis Services Tabular model. Upon opening it locally, it took Visual Studio several minutes to open the project. Even worse, after the project was finally loaded, my laptop CPU utilization went into 80-90% and all the 16 GB of memory got exhausted rather quickly. With an empty workspace database! What’s going on?

As it turned out, a business requirement asked for all measures to be in the same table. So, developers introduced a Metrics DAX calculated table and assign it as a home table for all measures organized in display folders. Nothing wrong with that. However, the number of DAX measures were 2,774! It’s common practice to “flatten” DAX measures, such as to have separate measure for time calculations: SalesAmount, SalesAmountQTD, SalesAmountYTD, and so on. This can easily result in a measure explosion, but I haven’t experienced such a performance hit before with other clients.

As it turned out, each measure requires a data structure even with no data. When you select a table in Visual Studio, Visual Studio sends a DAX query asking for the value of each measure in the table: EVALUATE CALCULATETABLE(ROW, “Measure1”, [Measure1], “Measure2”, [Measure2]… It does so because the Measure Grid shows not only the measure formulas but also their values. Currently, there is no way to suppress this query, not even if you hide the Measure Grid. When the server that hosts the workspace database receives the query, it allocates a data structure for each measure. When the query asks for thousands of measures, the server would allocate a lot of CPU and memory resources just to evaluate the query. In this case, the server would exhaust all the memory on my laptop and return an “Out of memory” exception to the client. Visual Studio doesn’t give up and switches then to evaluating each measure separately by sending separate EVALUATE CALCULATETABLE query measure by measure! Once the project is finally loaded, design performance is bad, especially in the Diagram view. Every task, even selecting a table or moving the Visual Studio window from one monitor to another, results in a CPU utilization spike and takes a few seconds until UI becomes responsive.

I asked Microsoft to introduce a switch to suppress the EVALUATE CALCULATETABLE query, such as when the Measure Grid is disabled. I personally don’t care at all about measures values in the grid and I don’t care about the measure grid at all for that matter. These values are meaningless in most cases anyway, such as when they show blank values for time calculations since there is no date context at design time.

While Microsoft is investigating and working on improving the SSDT performance, you can mitigate the performance issue with many measures by doing the following:

  1. If possible, assign measures to multiple home tables.
  2. Switch your project to Manual Calculation Mode (Model menu, Calculation Options, Manual Calculation). Note that manual calculation won’t process calculated columns and relationship automatically. You’d have to switch to automatic calculation or explicitly process the model with Process Default when you make design changes.
  3. Create perspectives to reduce the number of tables in Diagram view.
  4. Give the Tabular Editor community tool a try.

031818_1803_TooManyMeas1.png

Prologika Newsletter Spring 2018

Extending Power BI with PowerApps and Flow

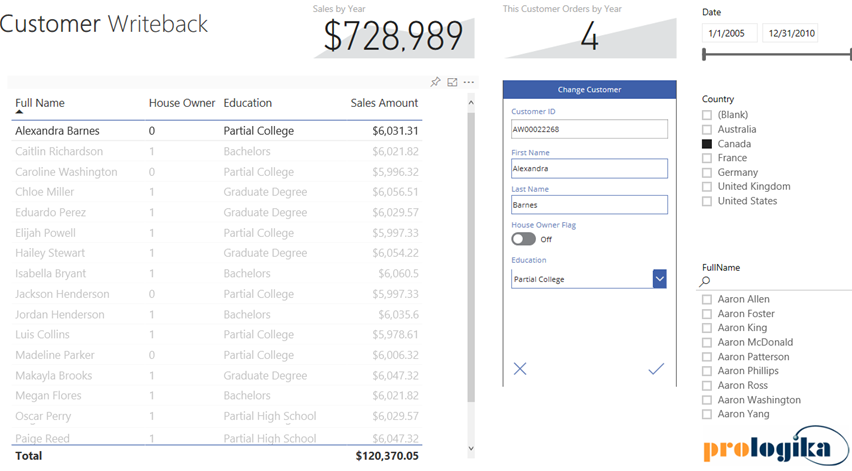
With hundreds of vendors out there, choosing a BI tool isn’t easy. If you’ve been following me for a while, you know that I love Power BI. One of the Power BI most prominent strengths is that it’s a part of the much broader Microsoft Data Platform that spans various on-premises and cloud offerings for data storage, processing, and analysis. Thanks to this integration, you can implement real-time dashboards, extend your Power BI reports with predictive capabilities, integrate with Big Data, and much more. In this newsletter, I’ll talk about an exciting integration option: extending Power BI with business applications, thanks to its integration with PowerApps and Flow. And if you happen to be in the Microsoft office in Alpharetta, feel free to ask for a demo of the Power BI Writeback that Prologika prepared and deployed to the Microsoft environment. You’ll be directed to one of the big screens when you can test the report that I mention in this newsletter.

What’s PowerApps?

Every organization requires some sort of custom data-driven apps. And every organization is under pressure to do more with less. Have you used Microsoft Access? If so, you probably remember that Access makes it easy to create data-driven forms. But they were available only in Access and could access only Access database. You might also remember InfoPath – an app for designing, distributing, filling and submitting electronic forms containing structured data which Microsoft discontinued in 2014. Think of PowerApps as the evaluation and replacement of InfoPath. PowerApps is an Azure-hosted service that lets you build data-driven business apps that run in a browser or on mobile devices. Unlike Access and InfoPath, PowerApps supports many cloud or on-premises data sources. Connectivity to on-premises data sources requires installed a data gateway, which is the same software that Power BI uses to tunnel into your corporate network.

Targeting power users and developers, PowerApps requires minimum code and it has its own expression language. In the process of building an app, you specify where you want your data to come from. Then, you choose pre-defined layouts for your forms and link them together. You can develop the app online or by downloading a Windows-based desktop app. Developing the app is free. Sharing the app requires a plan, but if use Office 365, chances are that your O365 business plan already includes PowerApps.

What’s Flow?

As I explained in my “Going with the Flow” blog, Microsoft Flow is another cloud service for creating automation flows without writing code, similar to Zapier’s “zaps” and IFTTT’s “recipes”. Like PowerApps, Flow targets business users and developers willing to create basic multistep flows for automating tasks. For example, you might want to start a workflow when an email is received from specific recipients or containing specific words. Microsoft Flow makes it possible to automate this scenario and many, many more. Business users can connect their accounts, take advantage of pre-built templates, and create their own flows in an easy visual designer. And your PowerApps app can start a flow thanks to the fact that PowerApps and Flow work together.

How Can PowerApps and Flow Enrich BI?

After the integration with Visio, Power BI just took another leap forward with the introduction of the PowerApps custom visual. You can use this visual in your Power BI reports to bridge the Data Analytics and Developer worlds. Now your Power BI apps can integrate with Line of Business (LOB) applications in versatile ways and the app can trigger workflows. All this with minimum code! Suppose you have a Power BI report that shows sales by customers. As the user browses the data, he realizes that some changes need to be made. Granted, the user can open the appropriate business app and make the changes there, and then go back to the report to see the changes. But read-only reports and are so 20th century. Instead, why can’t we allow the user to make the changes on the report by integrating it with PowerApps? This scenario is commonly referred to as writeback.

This is exactly the approach my Customer Writeback app demonstrates. The user selects a customer in the table and the customer details show up in the Change Customer visual to the right. This is the PowerApps visual that references my Customer Writeback PowerApps app. The user can make changes in the PowerApps form and save the changes back to the underlying database. Then the user can refresh the report to see these changes. Bringing this one step further, the app can start a workflow, such as when a formal approval is required to approve the changes.

022518_1855_PrologikaNe2.png

If you have experience with PowerApps, implementing this scenario takes minutes. You can find the implementation steps and source code in my “Power BI Writeback” blog.

The Power BI integration with PowerApps and Flow opens exiting new possibilities and redefines the meaning of a report. These three technologies let you integrate your reports with “smart” applications that you can implement with almost no code! Featuring more than 100 data sources, you can use PowerApps and Flow as an integration hub to mash data from almost any place, create workflows, and then embed PowerApps forms in Power BI reports.

Teo Lachev
Prologika, LLC | Making Sense of Data
Microsoft Partner | Gold Data Analytics

logo

Using Profiler to Trace Azure Analysis Services

Scenario: You use Azure Analysis Services and you want to trace events in the SQL Server Profiler. However, you run the Profiler, connect to AAS, and you get greeted with “Unable to locate trace definition file Microsoft Analysis Services TraceDefinition 15.0.0.xml“. The prompt gives you an option to download the trace definition from the server, but nothing happens. You’ll encounter the same issue if you attempt to access a higher version of AAS or Database Engine from a lower version of Profiler, such as when you install SSMS 2012 on your laptop, but you connect to SQL Server 2016 or higher.

Workaround: While we’re waiting for Microsoft to provide the Azure AS trace definition, you can use this workaround:

  1. Navigate to the Profiler trace definition folder. In my case this folder is C:\Program Files (x86)\Microsoft SQL Server\140\Tools\Profiler\TraceDefinitions. Copy the latest trace definition file (in my case it was “Microsoft Analysis Services TraceDefinition 14.0.800.xml”) and paste it as Microsoft Analysis Services TraceDefinition 15.0.0.xml. You need admin privileges to do this.
  2. Start Notepad or Notepad++ with admin rights and open Microsoft Analysis Services TraceDefinition 15.0.0.xml from that folder.
  3. Change the Major version to 15, minor version to 0, and build number to 0 at the top of the file and save the file.
  4. If you want the default trace templates so you don’t have to configure the trace from scratch, navigate to the Profiler’s Templates folder (C:\Program Files (x86)\Microsoft SQL Server\140\Tools\Profiler\Templates\Microsoft Analysis Services). Copy the 140 folder and paste it as 150 folder. This folder has the Replay and Standard template definitions.

As Analysis Services evolves, the version  number would increase. You can connect SSMS to AAS and check its version in the server properties. In this case, version 15.0.1.245 corresponds to 150. This why the folder name is 150.

Azure SQL Database Managed Instance – the Good, the Bad, the Ugly

Azure SQL Database Managed Instance is available for public preview (for pricing see this page). It will play a very important role in the SQL Server cloud PaaS derivatives, which are now four:

  • Azure SQL Database – A database-scoped service available in Basic, Standard, and Premium performance tiers.
  • Azure SQL Data Warehouse – A scalable farm of Azure SQL databases that has roots in Microsoft Analytics Platform System (APS).
  • Elastic Pools — A pool of Azure SQL databases that share the same resources and it’s particularly useful for multi-tenant scenarios.
  • (NEW) SQL Database Managed Instance – Similar to an on-premises SQL Server, SQL Database Managed Instance allows you to host multiple database under the same instance.

A customer used SQL Database Managed Instance while it was in private preview and I followed its evolution closely. Here are few notes:

The Good

The good is in the name. It’s common to split your data in multiple databases. In the BI world, we typically have a staging database and a DW database, but you can also have MDS, SSISDB database, and others. And it’s much easier and faster to reference directly objects in another database instead of exporting and staging the data. Now, instead of isolated cloud databases, SQL Database Managed Instance can host multiple databases, just like your on-premises SQL Server. This allows you to “lift” your on-premises databases and shift them to the cloud if this makes sense. Further, there is almost a full feature parity between SQL Server and SQL Database Managed Instance as far as the Database Engine is concerned. Even better, SQL Agent is here so you can schedule jobs! Although not all job types as you’ll find in a moment, sigh…

The Bad

SQL Database Managed Instance is all about the Database Engine. It doesn’t support the BI offerings – SSAS, SSRS, SSIS, MDS. SSAS cloud migration requires deploying to Azure Analysis Services. SSRS needs to go a virtual machine but the Report Server database can be hosted in the managed instance. SSIS to Azure Data Factory (ADF) or a VM (the SSISDB catalog can be hosted in the managed instance). MDS need to go to a VM (Enterprise Edition alert!). All these paths require additional deployments and additional pricing. So, if you’re on SQL Server Standard Edition on premises, don’t expect your bill to remain the same. In general, speaking of pricing, don’t expect any cloud migration to cost less. It might, or it might not. Do your homework. My experience shows that cloud deployments are for convenience and make sense when data is in the cloud, and not that much for cost cutting. No vendor will let cloud offerings cannibalize its on-premises counterparts.

The Ugly

The SSIS story and the whole Microsoft cloud ETL story for that matter deserves the ugly award. I don’t know why Microsoft added ADF given that thousands of ETL developers use SSIS. To “lift and shift” your SSIS-based ETL you need to configure ADF to host the SSIS runtime. This scenario is still in preview and it doesn’t have UI (you need to use PowerShell for the configuration part). I failed to get an answer from Microsoft what engineering predicament precludes spinning the ISServerExec process to host the SSIS runtime directly in the managed instance so that we can lift and shift SSIS jobs and leave them still running under SQL Agent. I wonder how many customers would continue deploying SSIS to a VM, bypassing ADF and its idiosyncrasies altogether.

Conclusion

Azure SQL Database Managed Instance is a great addition the SQL Server cloud family. Azure SQL Database Managed Instance will remove developer’s pain in the cloud by allowing you to host multiple databases under the same instance. However, “lift and shift” scenarios need to be carefully evaluated, especially for existing on-premises BI solutions.

DAX Rank Over Two Columns

Scenario: An interesting scenario came today from a client. Consider the following schema. You have a fact table InternetSales and two dimension tables (Customer and SalesTerritory).

030618_2126_DAXRankOver1.png

You want to produce a report ranking each customer based on their sales for each territory. In addition, you want the rank to change as you filter the report, such as filter specific customers or specific territories, so you need a measure.

030618_2126_DAXRankOver2.png

Solution: The DAX RANKX function takes a table as the first argument. However, in this case, the rank needs to be produced over fields from two tables. So, the CROSSJOIN function is used to produce the needed combination.

‘InternetSales'[CustomerRank] :=
IF (
ISBLANK([SalesAmount]) || NOT HASONEVALUE(Customer[FullName]), BLANK(),
RANKX(CROSSJOIN(ALLSELECTED(‘Customer'[FullName]), ALLSELECTED(‘SalesTerritory'[SalesTerritoryCountry])), [SalesAmount],,,DENSE)
)

The ALLSELECTED function is needed to ignore the context from the FullName and SalesTerritoryCountry from the respective columns on the report. The condition in the IF statement ignores calculating the rank for customers with no sales and for the report total.

If you need to ignore a specific table so it doesn’t affect ranking then you can use the CALCULATE function (the IF logic excluded for brevity):

‘InternetSales'[CustomerRank] :=  RANKX(CROSSJOIN(ALLSELECTED(‘Customer'[FullName]), ALLSELECTED(‘SalesTerritory'[SalesTerritoryCountry])), CALCULATE([SalesAmount], ALL(TableToIgnore)),,,DENSE)

Another way to solve this scenario is to produce the rank over the fact table but you need to add FullName and SalesTerritoryCountry to the fact table first and use the fact columns on the report (not the ones from the dimensions). Then, you can do:

‘InternetSales'[CustomerRank] :=  RANKX(ALLSELECTED(‘InternetSales’),CALCULATE([SalesAmount], ALLEXCEPT(‘InternetSales’, ‘InternetSales'[Player], ‘InternetSales'[SalesTerritoryCountry])),,,DENSE)

Prologika AppSource Consulting Offers

Microsoft selected and published two Prologika Power BI-related consulting offers on Microsoft AppSource. And their price is right; they are both free!

  • Power BI for Your Organization: 2 HR Assessment – Prologika will evaluate your data analytics objectives to determine how Power BI can empower your organization to understand better and improve its business.
  • Power BI for Business Performance: 2-Hr Briefing – Prologika will provide you with a free, 2-hour briefing on how our client derived tremendous value from our solution for Business Performance Management. Learn how Prologika transformed the way a large organization does financial planning by creating and comparing budgets and forecasts with our customized solution based on the Microsoft Data Platform and Power BI.

2018 Gartner Magic Quadrant for Analytics and BI Platforms

The 2018 Gartner Magic Quadrant for Analytics and Business Intelligence Platforms is out. I read the report and followed the dots. I personally hoped to see the Microsoft dot higher than the overrated Tableau, given everything I said here, here, and here. I’m glad that Gartner finally realized what I have been saying all along that Tableau lacks “complex data model support” among many other things.

Anyway, this is a great endorsement of how far Power BI has come. And about what Microsoft can do when product groups work together. Mind you, the main focus of the Gartner’s evaluation was Power BI. The organizational BI pieces (SQL Server, SSRS, SSAS, SSIS, Azure) were not considered.

Here are my thoughts about the Microsoft-related cautions cited by Gartner:

  • Mode 2 analytics, Azure cloud only“Power BI has mainly focused on the requirements for Mode 2 (agile, self-service) analytics, while its on-premises SQL Server Reporting Services serves the needs of Mode 1 (for scheduled, distributed reports). For Microsoft customers, this has resulted in a two-product deployment with different capabilities and different deployment approaches. Microsoft’s reference customers cited absent or weak functionality (14%) as a limitation to wider deployment, with 27% (the highest percentage of respondents for this Magic Quadrant) citing a range of other problems.” Gartner has a point here. “Cloud first” shouldn’t mean “on premises never”. Supporting Power BI reports in Power BI Report Server (an add-on to SSRS) was a great move but customers expect to get at least the most important Power BI features, such as dashboards, Q&A, online report editing, Quick Insights, embedded APIs. But they are not in Power BI Report Server and there is no roadmap when they will arrive on premises if ever. If there is a fear that Power BI Report Server would cannibalize the cloud, then maybe we shouldn’t have Power BI Report Server at all. The interesting part is that some on-premises features, such as Excel workbooks with live connections, are not supported in the cloud. So, the feature mismatch goes both ways. I hope Microsoft addresses this as it’s a biggy for my clients.
  • Breadth of use – “As previously, Microsoft’s scores from its reference clients place it in the bottom quartile for breadth of use. Breadth of use looks at the percentage of users using the product for a range of BI styles: from viewing reports, creating personalized dashboards and doing simple ad hoc analysis, to performing complex queries, data preparation and using predictive models“. Not sure I agree with this one. My observations do show that business users don’t bother to learn the more advanced features, such as Power Query. But whose problem is this? Further “This pattern of use suggests that the more advanced data preparation is performed outside Power BI“, there are absolutely cases that go beyond a typical power user and such tasks are better done by IT, such as data integration in a central data repository. Do Tableau and Qlik handle advanced data preparation? Wait, Tableau doesn’t even have data integration while Qlik requires scripting.
  • Multiple products – “The core of Microsoft Power BI is a self-contained product. However, a number of elements in Microsoft’s roadmap that are part of the product vision span multiple products and require integration. For example, insight to action requires Microsoft Flow.” I don’t see a problem with having multiple products if they can integrate. Especially given that some are free, such as PowerApps and Flow with O365. The reason why they are separate products is that they don’t apply to BI only. And which BI vendor has flow, business apps, predictive models, in the same product? Not to mention that Tableau and Qlik don’t have anything more than just a reporting tool.
  • Sales experience – “The majority of Microsoft’s reference customers evaluated their sales experience as good to excellent. However, in relative terms, Microsoft is slightly below average for this Magic Quadrant.” I haven’t gotten feedback from clients about their sales experience, so I can’t comment but I thought Gartner should have elaborated more on this and beyond “relative terms”. Further, “While Microsoft Power BI is a low-priced option, clients expressed frustration about changes in the pricing and packaging and the lack of clarity about what Power BI functionality is included with Microsoft Dynamics 365.” So, Power BI pricing has remained the same and it’s clearly stated. I think what Gartner meant is that the Power BI Embedded pricing story has changed. I wonder how many customers complained about the Dynamics 365 integration.

2017 vs. 2018
022818_0104_2018Gartner1.png