Testing RLS with Power BI Shared Datasets

In a typical engagement, I create an organizational semantic model(s) and “report packs”, such as Sales Report Pack, Inventory Report Pack, etc. These report packs are typically implemented as Power BI reports connected to the semantic model as a shared dataset using the Power BI Datasets connector. Reports sanctioned by IT are published to a dedicated workspace, such as Corporate BI. Departmental reports are deployed to their respective workspace, such as Sales, to enforce content-level security. Usually, the semantic model has row-level security (RLS) roles defined to enforce restricted access to data depending on the identity of the interactive user.

Although not immediately obvious, here is how you can test RLS to ensure that connected reports produce expected results under someone else’s identity directly in Power BI Service:

  1. In powerbi.com, go to the workspace where the shared dataset is published.
  2. In the dataset page, click the Datasets tab, and then click the ellipsis button (…) next to the shared dataset. In the dataset Settings, click Security.
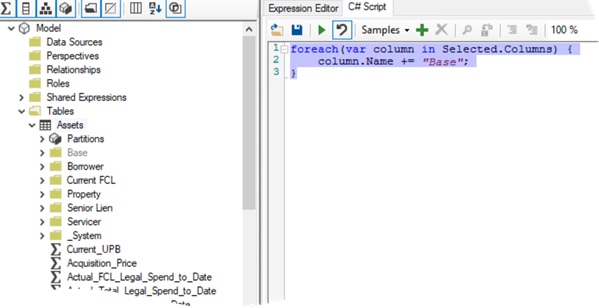
  3. Expand the … button next to the Restricted Access role, and then click “Test as role”. This will open whatever report is included in the shared dataset pbix file (I typically have some reports there for testing).
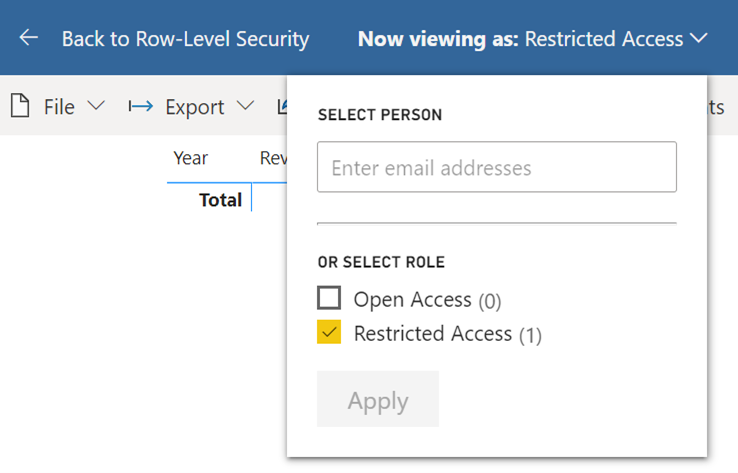
  4. You can expand the Restricted Access dropdown and enter the user email of the user whose RLS permissions you want to test or the role you want to apply. In the screenshot below, I’m testing under my identity applying the rules in the Restricted Access role. If I wanted to test what a specific user would see, I’d type in that user’s email.
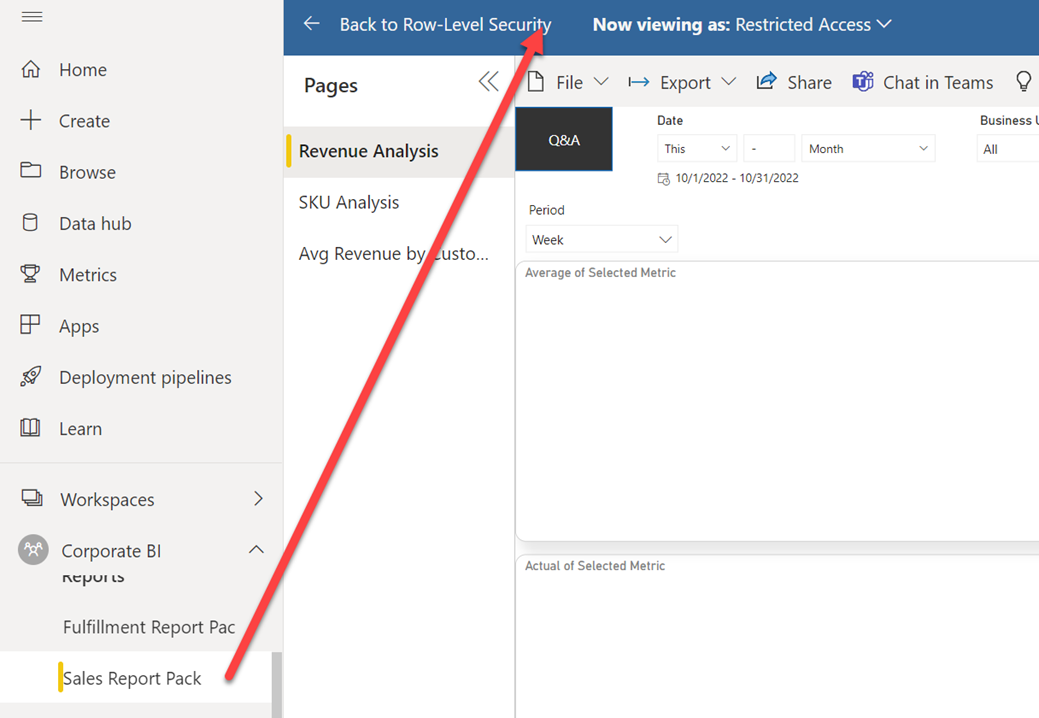
  5. To test other reports for this user, expand the powerbi.com left-navigation pane and then click the desired report. Power BI will navigate you to that report, but it will honor RLS.

Correlating Analysis Services Errors with Measures

This blog builds upon my previous “Resolving Tabular Conversion Errors” and applies to Analysis Services in all flavors (Power BI, MD, and Tabular). In the scenario I described in the previous blog, the server at least told us the name of the offending measure in the error description. But sometimes you might not be that lucky. For example, recently I got this error when running a DAX query requesting many measures: “Microsoft OLE DB Provider for Analysis Services.” Hresult: 0x80004005 Description: “MdxScript(Model) (2000, 133) Failed to resolve name ‘SYNTAXERROR’. It is not a valid table, variable, or function name.” All we know is that there is a syntax error in some measure but good luck finding it if you have hundreds of measures in the query and your model. However, the (2000,133) section references the line number and column number in the MDX script (Yeap, MDX even if you use Tabular), so if we can get the script, we might be able to correlate the error.

Getting that script is elusive as the only way I know off for Tabular models is to trace the “Execute MDX Script Begin” or “Execute MDX Script End” events. But these events are generated only the first time a user with a given set of role permissions connects to a cube after processing, clearing the cache, or restarting the server. So, after you connect the SQL Server Profiler to the cube and check either of these two events (you must click Show All Events because the events are not shown by default), you can execute Clear Cache or process a table. Then, connect to the cube and execute any MDX or DAX query. In the Profiler, locate the “Execute MDX Script Begin” event. The payload should start with CALCULATE followed by all measure definitions.

CALCULATE;
CREATE MEMBER CURRENTCUBE.Measures.[__Default measure] AS 1; ALTER CUBE CURRENTCUBE UPDATE DIMENSION Measures, Default_Member = [__Default measure];
CREATE
MEASURE'Date'[Days Current Quarter to Date]=COUNTROWS( DATESQTD( 'Date'[Date]))
MEASURE'Date'[Days in Current Quarter]=COUNTROWS( DATESBETWEEN( 'Date'[Date], STARTOFQUARTER( LASTDATE('Date'[Date])), ENDOFQUARTER('Date'[Date])))
MEASURE'Internet Sales'[Internet Distinct Count Sales Order]=DISTINCTCOUNT([Sales Order Number])
….

Copy that payload and paste it in an editor that has line numbers, such as Notepad++. Then go to the line number (you can press Ctrl+G in Notepad) mentioned in the error description.

Using this technique, I was able to narrow down the measure and discovered that I’ve missed a comma in the DIVIDE DAX function. I’ve made the change in the Tabular Editor, but it didn’t catch the syntax error.

Resolving Tabular Conversion Errors

A scheduled SSIS job that executes a massive DAX query to an on-prem Tabular server (Power BI can also generate this error) one day decided to throw an error “Source: “Microsoft OLE DB Provider for Analysis Services.” Hresult: 0x80004005 Description: “MdxScript(Model) (2020, 98) Calculation error in measure ‘Account Snapshot'[Average utilisation % of all CR active current accounts last 3 months]: The result of a conversion or arithmetic operation is either too large or too small.” At least we know the offending measure, but which row is causing the error? The query requests some 300+ measures for 120 million customers, so I thought someone might find the troubleshooting technique useful. Let’s ignore what the measure does for now except mentioning that it performs a division of two other measures.

We can use the DAX ISERROR function to check if a measure throws an error. So, the first step is to wrap the measure with ISERROR and execute the query for all customers.

EVALUATE
FILTER (
 CALCULATETABLE (
 ADDCOLUMNS (
VALUES ( 'Customer'[Customer Registry ID] ),
"x", ISERROR ( [Average utilisation % of all CR active current accounts last 3 months] )
 ),
 FILTER ( VALUES ( 'Date'[Date] ), 'Date'[Date] = DATEVALUE ( "2022-10-14" ) )
 ),
 [x]
)

The query uses the ADDCOLUMNS function to add the measure so that it’s evaluated for each customer as of the date when the job ran. Make sure to add dependent measures that references the measure in the error description. ISERROR will return TRUE if the measure throws an error. The final step is to wrap CALCULATEDTABLE with FILTER that returns only the offending customer(s) where the measure is TRUE.

Using this technique, I’ve managed to narrow the error to data quality issues concerning large negative credit limits for some customers. BTW, the Tabular engine raises this error when converting a double precision floating point number to an integer, but the former is out of range of valid integer numbers.

Embedding Power BI Reports in Internal Portals

This question pops up over and over. What’s the easiest way to embed a Power BI or paginated report hosted in Power BI Service in an internal portal, such as a custom site developed by your team or on-prem SharePoint Server, so internal users can see all reports in one place? Use the “Embed report” feature that will give you a link or iframe code that you can readily add to the portal without any coding (notice that there is a SharePoint Online option because SharePoint Online has a special webpart for this purpose).

Will you get a single sign-on (SSO) so that the interactive user credentials automatically flow to Power BI? Nope. To the best of my knowledge, Power BI doesn’t support single sign-on even if your organization has extended its active directory to Azure, but let me know if you have found a workaround. The first time the user opens a Power BI report in the browser session, the user will get prompted to enter credentials. Then the user won’t be asked to authenticate when viewing subsequent reports in the browser session because the authentication token will be cashed in the browser session. The browser can also mitigate the issue by saving the user credentials until the password changes.

What if you want to avoid the prompt under any circumstance? Write code and use Power BI Embedded. Down the custom code rabbit hole we go… The upside is that you’ll get more control over the embedded reports thanks to the Power BI JavaScript library, such as if you want to replace the Filter Pane with your filtering mechanism.

Atlanta MS BI and Power BI Group Meeting on October 3rd (Auto-provision embedded report delivery for your customers)

Please join us online for the next Atlanta MS BI and Power BI Group meeting on Monday, October 3rd, at 6:30 PM ET.  Tom Huguelet (Lucient) will present a real-world case study and the challenges involved in bringing a Power BI application from initial Excel-based POC to an ISV platform that auto-provisions for new clients, using Power BI Embedded Azure Premium Capacity.  For more details and sign up, visit our group page.

Presentation:Auto-provision embedded report delivery for your customers
Date:October 3rd
Time:6:30 – 8:30 PM ET
Place:Click here to join the meeting
Overview:In this session we’ll look at a real-world case study and the challenges involved in bringing a Power BI application from initial Excel-based POC to an ISV platform that auto-provisions for new clients, using Power BI Embedded Azure Premium Capacity.

We will cover:

•            Initial Business Case and Project Team

•            Testing Embedded in a Sandbox Environment (Authentication)

•            Enabling User-Customized Experiences in Embedded

•            Using REST APIs for automatic Provisioning

•            Lessons learned and challenges encountered

Speaker:Tom Huguelet has been engaged in using Business Intelligence, and Dashboards & Analytics to enable Corporate Performance Management since 1999. While coming from a technological background, Tom has always focused on the people and process aspects of how Business Intelligence can create positive changes within an organization. In his role as a Practice Director, he leads and mentors technical teams as well as advises business stakeholders on how to build the cross-disciplinary teams necessary to be successful with Business Intelligence. Tom holds several Microsoft certifications including Microsoft Certified Trainer, is a frequent speaker at industry events, has co-authored 3 books on SQL Server and Data Warehousing, and helped start a BI Roundtable group in Chicago.
Prototypes without PizzaPower BI Latest

PowerBILogo

Power BI Visual Help Tooltips

Want to display a visual-left hint to perplexed users that explains what your visual is supposed to reveal? Like me, you’ve probably missed the handy Power BI help tooltips feature that allows you to pop up some helpful text for each visual. On the Format tab of the visualization pane, expand the Help Tooltip section, and enter the text. Then, a question mark glyph shows up in the visual header when the user hovers. Besides showing static text, you could alternatively redirect the user to a report page that could provide more context.

Unfortunately, the tooltip tip can’t be expression-based due to a long-standing and overdue Power BI limitation that only a small set of properties that can be bound to measures.

Batch Renaming Columns in Power BI Tables

Scenario: You need to rename many columns in a Power BI table. Usually, I rename measure-related columns with “Base” suffix and hide them, and then I create explicit measures. Since renaming one column at the time is no fun, you’re looking for an automated solution. Having heard about the Tabular Editor scripting feature, you’re tempted to whip out a script like this:

You select all columns that must be renamed, run the script, and it appears to work (make sure to enable the Power BI experimental feature in the Tabular Editor Preferences before you run the script since otherwise nothing will happen)! You save the changes, the columns show up with the new names in Power BI Desktop, and you’re about to call it a successful day. But then when you refresh the table, you get greeted with an error that the column already exists and can’t be added, and the refresh operation fails.

Solution:  In Power BI Desktop, tables always have a Power Query behind them. The rename operation requires a step in that query for every column that’s renamed.

Therefore, instead of using a Tabular Editor script to rename table columns, add a Renamed Column step to the table query, such as the code below. Unlike columns, you can use a Tabular Editor script to batch-rename measures because they are not physical columns and don’t require a RenameColumns step in Power Query.

= Table.RenameColumns(dbo_vFactAssets,{ {"Acquisition_Price","Acquisition_Price_Base"}
,{"Actual_FCL_Legal_Spend_to_Date","Actual_FCL_Legal_Spend_to_Date_Base"}
,…)

Tip: You can use replace and vertical selection features in Microsoft Word to “automate” the code in that step.

Refreshing Power BI Datasets from SSIS

Scenario: You use SSIS to load data for on-prem BI solution. As a last step of the ETL pipeline, you want to refresh a Power BI dataset. There’s quite a bit of misinformation on the Internet about how to do this, hence this blog.

Solution: If the dataset is hosted in Power BI Pro workspace, the only way is to use the Power BI REST APIs and there are some good examples out there using PowerShell or Microsoft Automate flows. However, if the dataset is hosted in a Premium-per-user (PPU) or Premium workspace, you can use the SSIS built-in Analysis Services Processing Task. And, no, you don’t need third-party components.

An unattended process can authenticate against Power BI using either a Power BI-licensed account or service principal. I couldn’t get service principals to work with Power BI datasets. More than likely, this is because the service principal needs to be added as an Analysis Services administrator, but we can’t do with Power BI (we can with Azure Analysis Services though). And so, the only option is to use a Power BI regular account (email and password). However, your organization probably uses multi-factor authentication (MFA) to secure access to cloud services. Because the SSIS process will run unattended, no one will be on a lookout to plug in the authentication code. Therefore, you must harass your helpful system administrator to provide you with a user account that is not enabled for MFA.

And so, the steps are:

  1. Provision a dedicated account in Azure Active Directory. Ideally, the account should have a password that doesn’t expire.
  2. Assign the account (or the AAD Security group it belongs to as a best practice) the Contributor (or higher Power BI role) to the workspace where the dataset resides.
  3. Enable the Power BI XMLA feature as ReadWrite.
  4. On your dev machine, install both the 32-bit and 64-bit versions of the latest Analysis Services MSOLAP providers. You need the 32-bit provider to test in Visual Studio because VS refuses to go 64-bit. However, if you run the package under SQL Agent, you’d need the 64-bit provider.
  5. In Visual Studio, add a connector to the SSIS project that uses SSIS MSOLAP100 Analysis Services provider, which is just a wrapper on top of the SSAS native MSOLAP provider. Configure the connector to connect to the XMLA dataset endpoint (you can copy it from the dataset settings in Power BI Service).
  6. Configure the SSIS connector to use the “Use a specific user name and password” and plug in the credentials of the dedicated account you configured in step 1.

Gotchas: For some obscure reason, the “Test Connection” button might generate an error, but the processing task should work. Unlike what you might believe, the “Allow saving password” option doesn’t persist the password for security reasons. So, you either need to use an SSIS configuration or retype the password if you close and reopen Visual Studio. Once you deploy the SSIS project to the Integration Services catalog and schedule it with the SQL Agent, make sure to update the connector’s connection string to store the password inside the SQL Agent task.

Atlanta MS BI and Power BI Group Meeting on September 12th (Incremental Refresh and Hybrid Tables in Power BI)

Please join us online for the next Atlanta MS BI and Power BI Group meeting on Monday, September 12th, at 6:30 PM ET.  Shabnam Watson (Microsoft MVP) will discuss how to reduce the dataset refresh time with incremental refresh policies and how to implement tables with hybrid storage. For more details and sign up, visit our group page.

Presentation:Incremental Refresh and Hybrid Tables in Power BI
Date:September 12th
Time:6:30 – 8:30 PM ET
Place:Click here to join the meeting
Overview:Incremental Refresh makes it possible for Power BI to handle large datasets by partitioning the data into segments and making refreshes faster, more reliable, and less resource intensive.


Hybrid tables, a new addition, can be easily configured for a table with Incremental Refresh to enable different storage modes for its different partitions. This allows historical data to load into Power BI’s memory (import) for super-fast query performance and to leave the most recent data in the backend (DirectQuery) for near real time results.

Speaker:Shabnam Watson is a Microsoft Data Platform MVP and Business Intelligence consultant with 20 years of experience developing Data Warehouse and Business Intelligence solutions. She has worked across several industries including Supply Chain, Finance, Retail, Insurance, and Health Care. Her areas of interest include Power BI, Analysis Services, Performance Tuning, PowerShell, DevOps, Azure, Natural Language Processing, and AI. Her work focus within the Microsoft BI Stack has been on Analysis Services and Power BI. She is a regular speaker and volunteer at national and local user groups and conferences. She holds a bachelor’s degree in Computer Engineering, a master’s degree in Computer Science, and a Certified Business Intelligence Professional (CBIP) certification by The Data Warehouse Institute (TDWI).
Prototypes without PizzaPower BI Latest

PowerBILogo

Not Your Kimball’s DW

BI practitioners, myself included, have been following the Kimbal tenets for dimensional schema design for years. In fact, it’s a second nature to dimensionalize every BI project the “proper” way. You identify fact tables, grain, dimensions, etc. Dimensions of course would have surrogate keys – your insurance against weird things happening down the road, such as tracking Type 2 changes, unreliable business keys, acquisitions, and what not. Of course, there are downsides. A lot of time is spent on the dimension design – regular dimensions, junk dimensions, mini dimensions… Your ETL process must load these dimensions. And there are dependencies. You can’t just truncate and reload a dimension because the surrogate keys in the fact tables will be invalidated.

But here comes a project that throws everything off. Don’t you love projects like these? I’m designing a data warehouse solution for small financial company, where I model financial loans. The wrinkle is that each loan has hundreds of attributes (the original source table actually has 4,500 fields!), including many dimension-like two-pair attributes, such as Loan Type and Loan Type Description. The number of loans is not big and can fit into an Excel spreadsheet. Where do you draw the line for dimensions here? You could identify “important” dimensions, such as these that require historical change tracking, such as Loan Status, Loan Type, etc. and leave the rest of the descriptors in the fact table. Or you could take the approach that I’m considering of leaving all attributes in the fact table, so that the Loan subject area consists of a LoanSnapshot accumulating snapshot table and Date dimension. Ta da – no dimensions besides Date!

What about conformed dimensions should other fact tables, such as LoanBudget, pop up later, like mushrooms on a rainy day? Well, then we can decouple the affected attributes and manufacture a dimension on the fly by simply adding a SQL view with SQL DISTINCT. And, yes, we will be relying on the business keys (no surrogate keys) for the joins. Unless there is a good reason to use surrogate keys, in which case we’d have to spin off more ETL.

Don’t get me wrong. Most projects will benefit from “properly” dimensionalizing the schema and often the dimension candidates, such as Product, Customer, Organization, Geography, are easy to spot. But sometimes, such as in the case of smaller and simpler businesses, this might be overkill and an ad-hoc and agile perspective might be preferable. It will save you tremendous effort and it’s not the end of the road should things get more complicated. Just don’t be a methodology stickler!