Prologika Newsletter Fall 2019
 We all need to share. But until a couple of months ago, a Power BI training or assessment wouldn’t be complete unless I got hammered on the Power BI sharing limitations. Fortunately, Microsoft has addressed most of these and I have now a much better story to tell. And this is the subject of this newsletter.
Quo vadis, Power BI Sharing?
Power BI sharing road has been a long and winding one. I covered the gist in my blogs “Power BI Sharing is Getting Better“, “Power BI Sharing is Getting Better 2“, and “The Power BI Viewer Role“. The following table summarizes prior and standing sharing limitations. The Solution column lists the “fix” by Microsoft.
| Limitation | Solution |
| Workspace dependency on Office 365 groups | V2 workspaces don’t depend on O365 groups |
| No IT oversight on creating workspaces | You can now control who can create workspaces in the Power BI Admin center |
| Group membership limitations | V2 workspaces support all O365 group types |
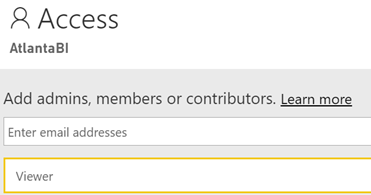
| Coarse content access level | Contributor and Viewer roles |
| No cross workspace sharing | A dataset can be shared across workspaces |
| No data governance | A dataset can be promoted and certified |
| Power BI Premium sharing with viewers require report sharing or apps | The Viewer role supports sharing with viewers |
| Only one app supported per workspace | The Viewer role deemphasizes apps |
| No nesting support (subfolders) |
Sharing Best Practices
Given the current state of Power BI, I’d like to share some best practices for organizing and sharing content:
- Don’t use report and dashboard sharing as it can quickly turn into a maintenance nightmare.
- Create workspaces to reflect your organizational functional areas, e.g. Sales, HR, Finance. Unfortunately, workspaces still don’t support subfolders (Microsoft hinted that they are working on such a feature), so for now you must resort to a flattened list.
- Instead of individual user assignments, add users to security groups and then add these groups as members to the workspace. This way, when the user leaves and company or moves to another department, you only need to change the user’s group membership without making changes to the workspace security policy.
- Come up with data governance policy. The Power BI data governance story is work in progress, but you can set up some ground rules. For example, once a contributor believes that a dataset is ready for a broader consumption, he can promote the dataset. Then, IT can verify the dataset and certify it. Currently, Power BI supports certifying only datasets (reports and dashboards aren’t certifiable yet).
- This one is hard. Teach data analysts best data modeling practices. Instead of creating a dataset per report, they should create a data model that correctly represents their subject area. A data analyst should create the model once so it can support multiple reports. Once the dataset is published and certified, users can create their own reports.
- Although Microsoft is pushing apps very hard and adding some nice features, such as navigation, a standing limitation is that you can create only one app per workspace. So, you can’t publish multiple apps from a workspace, such as to share some reports with one group of users and another set with a different group. Instead, grant access directly to workspaces by using the Contributor and Viewer roles. The Viewer role lifts a significant limitation that forced you to use report/dashboard sharing or apps to share content out of a premium workspace with viewers. If you want to share the entire content of the workspace, you don’t have to use apps. Instead, you can simply add users or groups as viewers to the workspace.
Despite some long standing limitations, Power BI sharing is coming out of age. Follow the above practices and you’ll have now a much better way to organize and share content.

Teo Lachev
Prologika, LLC | Making Sense of Data
Microsoft Partner | Gold Data Analytics
![]()