A customer reported that a Power BI date filter/slicer set to a specific date in Date dimension, let’s say April 24, 2020, doesn’t return some rows from the fact table that match that date. Upon some digging, the data was imported from Dynamics CRM and the source date column had UTC time. Power Query showed Date/Time/Timezone as a data type. However, the developer has converted the corresponding field in the model to the Power BI Date data type to remove the time portion. And indeed, the Data View would show that date as April 24, 2020 (without the time portion). So, why no match?
The xVelocity storage engine (the storage engine behind Power BI and Analysis Services Tabular) has only one data type for dates: DateTime. If you convert the field in the data model to Date, it still keeps the time portion (UTC or not) and it doesn’t change the column storage. It just changes to the column formatting to show the date only.
To get rid off the time portion, cast to Date in the data source (e.g. in a wrapper SQL view) or change the data type of the column in Power Query to Date. This will “remove” the time portion. In reality, xVelicity will convert the time to midnight.
https://prologika.com/wp-content/uploads/2016/01/logo.png00Prologika - Teo Lachevhttps://prologika.com/wp-content/uploads/2016/01/logo.pngPrologika - Teo Lachev2020-05-10 21:05:012020-05-10 21:05:01Power BI Time Adventures
MS BI fans, please join us online for the next Atlanta MS BI and Power BI Group meeting on Monday, May 4th, at 6:30 PM. Bill Anton will show you how to effectively apply time intelligence to your Power BI data models. For more details, visit our group page and don’t forget to RSVP (fill in the RSVP survey if you’re planning to attend).
Conference bridge number 1 605 475 4300, Access Code: 208547
Overview:
Time-Intelligence refers to analyzing calculations and metrics across time and is the most common type of business intelligence reporting. Power BI has a lot of built in capabilities to help you get started but these alone are not always enough for most real-world solutions.
The key to mastering time-intelligence in Power BI is a good date table and understanding how to manipulate the filter context. This session will teach you how to do both!
In this (demo-heavy) session, we’ll quickly review Power BI’s built-in time intelligence capabilities and why you should avoid them! We’ll also cover the importance of a good date table, what attributes it should include, and how it can be leveraged to simplify complex time-intelligence calculations. Finally, we’ll breakdown a handful of the 40+ DAX time-intelligence functions, showing you how they work under the covers (hint: filter context) and how they can used in combination to accommodate complex business logic.
Speaker:
Bill Anton is an independent consultant whose primary focus is designing and developing Data Warehouses and Business Intelligence solutions using the Microsoft BI stack. When he’s not working with clients to solve their data-related challenges, he can usually be found answering questions on the MSDN forums, attending PASS meetings, or writing blog posts over at byoBI.com.
Prototypes “without” pizza:
Power BI latest features
https://prologika.com/wp-content/uploads/2016/01/logo.png00Prologika - Teo Lachevhttps://prologika.com/wp-content/uploads/2016/01/logo.pngPrologika - Teo Lachev2020-04-27 09:13:102021-02-17 01:01:41Atlanta MS BI and Power BI Group Meeting on May 4th
Register for my next online Power BI Dashboard in a Day (DIAD) workshop and hone your data analytics skills! Drive value for your organization and on the road to recovery after COVID-19. Attend from anywhere for only $199. I’ll teach you practical Power BI knowledge and data analytics skills that you can immediately apply to your job. See how Power BI can improve your usability and productivity even further.
https://prologika.com/wp-content/uploads/2016/01/logo.png00Prologika - Teo Lachevhttps://prologika.com/wp-content/uploads/2016/01/logo.pngPrologika - Teo Lachev2020-04-18 17:36:432020-04-18 17:38:59Virtual Power BI Dashboard in a Day (DIAD) on April 30
Question: How to put Power BI files under source control?
Workaround: Power BI Desktop does not currently support source control and it doesn’t have an Excel-like extensibility mechanism to let developers take from where Microsoft left off.
However, thanks to the enhanced dataset metadata (currently in preview), you can implement a rudimentary source control policy while waiting for third parties to fill in the void by using these steps:
In Power BI Desktop, go to File, Options and settings, Options. In the “Preview features” tab, check “Store datasets using enhanced metadata format” if this feature is still in preview. Restart Power BI Desktop when asked.
In Power BI Desktop, go to File, Save As and save the file as a Power BI Template (*.pbit) file. This removes the imported data which you don’t need for source control and keeps the file small.
If you want to put all artifacts (reports, queries, data model) under source control, upload the entire file to your source control provider. However, if you want to compare and restore the model schema, you have more work left.
In Windows Explorer, right-click the pbit file and extract its content using your favorite extractor, such as 7-Zip. If this doesn’t work, rename the file extension to *.zip (Power BI files are saved as archive zip files) and extract.
The DataModelSchema file stores the model schema. I recommend you version control it separately so you can easily compare what changes have been made to the model (DataModelSchema is described in the same JSON schema as Analysis Services Tabular).
If you want to restore to a previous version of the schema or make changes, simply change the DataModelSchema file, zip the content back to a *.pbit file.
Other options to get to the model schema:
Use Tabular Editor which can open *.pbit files.
Use SSMS to connect to the running instance of Power BI Desktop (you can use the DAX Studio to obtain the port the AS instance is listening on) and then script the database as CREATE.
https://prologika.com/wp-content/uploads/2016/01/logo.png00Prologika - Teo Lachevhttps://prologika.com/wp-content/uploads/2016/01/logo.pngPrologika - Teo Lachev2020-04-12 19:40:582020-04-12 19:40:58Power BI Source Control
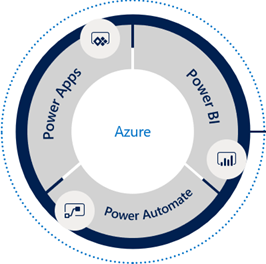
Take advantage of this exclusive opportunity to increase your data IQ from the comfort of your home wherever you are! Register today for my instructor-led digital training events and learn the Microsoft Power Platform consisting of Power BI, Power Apps, and Power Automate.
The workshops will be conducted online. Login instructions will be sent to registered attendees before the event.
https://prologika.com/wp-content/uploads/2016/01/logo.png00Prologika - Teo Lachevhttps://prologika.com/wp-content/uploads/2016/01/logo.pngPrologika - Teo Lachev2020-04-05 18:02:372020-04-05 18:02:37Two Virtual Workshops to Learn the Power BI Platform
MS BI fans, the time has come for a virtual meeting. Please join us online for the next Atlanta MS BI and Power BI Group meeting on Monday, April 6th, at 6:30 PM. I’ll show you how business analysts can apply AutoML in Power BI Premium to create predictive models. For more details, visit our group page and don’t forget to RSVP (fill in the RSVP survey if you’re planning to attend).
Presentation:
Bringing Predictive Analytics to the Business User with Power BI AutoML (Virtual Meeting)
Conference bridge number 1 605 475 4300, Access Code: 208547
Overview:
With the growing demand for predictive analytics, Automated Machine Learning (AutoML) aims to simplify this process and democratize Machine Learning so business users can create their own basic predictive models. Join this presentation to learn how to apply AutoML in Power BI Premium to predict the customer probability to purchase a product. I’ll show you the end-to-end AutoML process, including:
· Create a dataflow
· Choose a field to predict
· Choose a model type
· Select input variables (features)
· Train the model
· Apply the model to new data
· Bonus: Integrate Power BI with AzureML
Speaker:
Through his Atlanta-based company Prologika (https://prologika.com), a Microsoft Gold Partner in Data Analytics, Teo Lachev helps organizations make sense of their most valuable asset: their data. His strategy formulation, trusted advisory and mentoring, design and implementation services empower clients to apply effectively data analytics in order to understand, improve, and transform their business processes. Teo has authored and co-authored several books on organizational and self-service data analytics, and he has been leading the Atlanta Microsoft BI and Power BI group since he founded it in 2010. Teo has been a Microsoft Most Valued Professional (MVP) Data Platform since 2004.
Prototypes without pizza:
Power BI latest features
https://prologika.com/wp-content/uploads/2016/01/logo.png00Prologika - Teo Lachevhttps://prologika.com/wp-content/uploads/2016/01/logo.pngPrologika - Teo Lachev2020-04-02 21:19:322021-02-17 01:01:40Atlanta MS BI and Power BI Group Meeting on April 6th
Power BI Service (powerbi.com) packs a graphical lineage view with the caveat that it only works within a workspace. As a Power BI admin, you may need a utility to inventory all Power BI artifacts published to all workspaces (including My Workspaces) in your Power BI tenant. Fortunately, the Admin – Groups GetGroupsAsAdmin can do the job in one call without any coding! Don’t be misled by “groups” in the API name as groups are equivalent to workspaces (the original V1 workspaces were joined by the hip with O365 groups so Microsoft got carried away here, which I’m sure they regret by now given than V2 workspaces decoupled from groups :-).
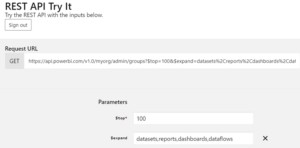
Go to the API page and click the “Try it” button (isn’t great that you can test any Power BI API without writing a single line of code?). Sign in with your Power BI credentials when prompted.
Enter a value for the $top parameter to limit the number of workspaces returned. It must be withing the 1-5000 range.
Add a $expand parameter and specify what artifacts you’re interested in. Make sure to click the plus next to the parameter to add it to the API call. In the example below, I request all Power BI artifacts: datasets, reports, dashboards, and dataflows
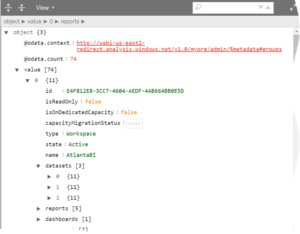
Next run the API and get the results as JSON. You can use one of the online JSON viewers, such as the Code Beautify JSON Viewer, to get a user-friendly view of the data. The Tree Viewer is particularly useful to drill down a workspace to items.
https://prologika.com/wp-content/uploads/2016/01/logo.png00Prologika - Teo Lachevhttps://prologika.com/wp-content/uploads/2016/01/logo.pngPrologika - Teo Lachev2020-03-22 15:28:182020-03-22 15:28:18Getting Lineage Across Power BI Tenant
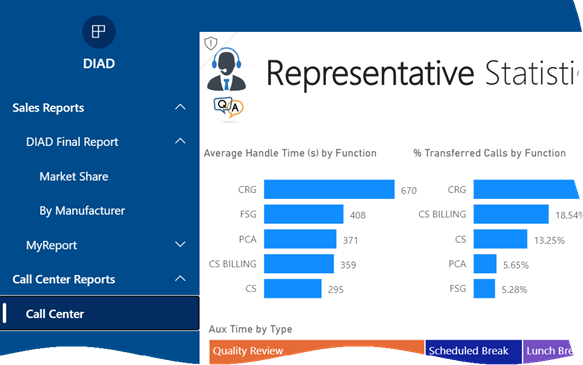
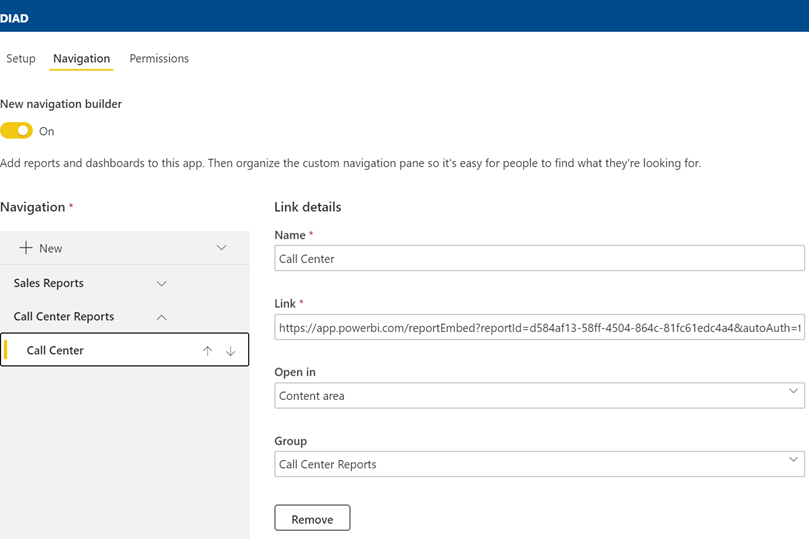
Scenario: Management has requested an easy way to view a subset of strategic reports located in different Power BI workspaces. You can ask the users to mark reports and dashboards as favorites so they can access pertinent content in the Favorites menu, but you’re looking for an easier configuration, such as to create a book of reports with a built-in navigation that organizes reports in groups (like a table of contents), such as the screenshot below demonstrates.
Workaround: Creating a Power BI app might be your best option. However, a long-standing limitation of apps is that there is 1:1 relationship between an app and a workspace. Therefore, by default all included content must come from the same workspace and you can’t create multiple apps in a workspace, such as to distribute content to different audiences.
But thanks to the upgraded navigation experience, an app can include links to reports in other workspaces if consumers have at least Viewer permission to these workspaces.
Start by deploying the core set of reports that you want to distribute to a workspace, such as an Executive Reports workspace. This workspace will serve as a base for the app.
Create an app. In the Navigation tab, the app will already include sections for each distributed report. Add links to reports in other workspaces and organize them in group.
To prevent external reports “losing” the navigation experience, specify the report embed URL which you can obtain by opening the report in Power BI Service, and clicking the Embed , “Website or portal” menu. Then, copy the URL (not the iframe element) and use it as the link.
Grant permission to the appropriate users or groups.
(Optional) Upload an image for the app logo so end users can tell the app apart from other apps.
Here is a configuration for a report residing in a different workspace. Notice that to preserve the navigation experience, the report is configured to open in the page content.
There are two main caveats of this approach:
Users must have permissions to the workspaces (except the app workspace) where the distributed reports reside. The app permissions you set up don’t propagate to content outside the app workspace.
App consumers are not isolated from changes to the external reports. By default, an app propagates content changes to included content only when the app is updated. End users will see changes to external content even if the app is not updated.
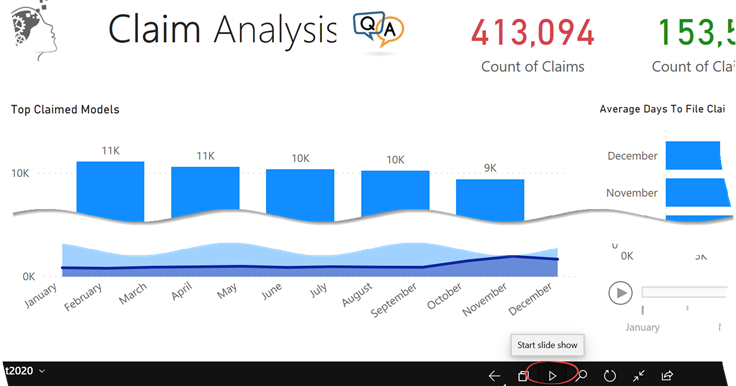
Scenario: You plan to display a Power BI report on a monitor. You want the report to automatically cycle through report pages, showing each after a configurable time delay, like a photo slide show.
Solution: There are at least two solutions to accomplish this:
The Microsoft-supported way is to install the Power BI Mobile for Windows and use its presentation mode feature, which is shown in the screenshot below.
Besides the built-in cross-filtering and cross-highlighting among visuals, Power BI supports two explicit filtering options: slicers and filters. Which one to use? Traditionally, you would use a slicer when you want the user to easily see what’s filtered on the report page. But with the introduction of the new filter pane and slicer enhancements, the choice becomes more difficult. Let’s compare the two options:
Criteria
Slicer
Filter
Placement
Report page (requires space on the page as other visuals)
Report pane
Filter target
Visual, page, report
Visual, page, report
Configuration
Drop-down, list, slider (numbers and dates), “buttons”
Passing a filter via JavaScript APIs to set default values cross-filters the slicer but doesn’t pre-select the slicer default value
Sets the filter as expected
A glaring gap for both filters and slicers is that you can’t currently set the default value programmatically, such as to default a date filter to the last date with data. As a workaround, you can add a field to the Date table, such as IsToday, that is set to Yes for the last date and prefilter on this field, but users must be educated to know how to remove the filter if they want to select another date. This is especially cumbersome with slicers, which don’t even support a single date selection, unless configured as a drop-down or Before/After.
Based on experience, people tend to rely mostly on slicers. But because it’s not uncommon to create reports that must be visually appealing on desktops and mobile devices, here are some recommendations to accommodate both large and small displays.
Use slicers judiciously because they take space on the report page. This could be an issue with mobile devices. Besides taking space, mobile users find it difficult to select values in slicers. I typically use slicers only for common filters, such as Date. Another scenario where slicers could be useful is when you need to visualize the items in a special way, such as a slider or to show a hierarchy of items.
Use filters for the rest of the filtering needs, especially if you plan to optimize reports for mobile viewing in portrait mode and/or use Power BI Embedded to embed reports.
https://prologika.com/wp-content/uploads/2016/01/logo.png00Prologika - Teo Lachevhttps://prologika.com/wp-content/uploads/2016/01/logo.pngPrologika - Teo Lachev2020-02-09 16:31:362020-02-15 14:27:18Power BI Slicers and Filters