If “XMLA” doesn’t ring a bell especially in the context of Power BI, it stands for Extensible Markup Language for Analysis. Still puzzled? It’s the protocol of Analysis Services (Multidimensional and Tabular). So, when an Excel or Power BI sends a query to a cube, it’s encoded according the XMLA specification (an XML-based format). And, the XMLA endpoint is the web service endpoint that Analysis Services listens for upcoming requests.
Now that I cleared the terminology, Microsoft announced the public preview of the XMLA endpoint in Power BI Premium. Since Power BI uses Analysis Services Tabular to scale and hosts the Power BI Desktop models you deploy, this means you can now access that Analysis Services backend instance which wasn’t accessible before. Or, at least read-only for now, meaning that you can only query it and not deploy organizational Tabular models to it.
What it’s in there for you? Here are some scenarios that this management feature enables:
Besides Excel, you can connect any client that support Analysis Services, such as Tableau, to your published Power BI datasets if you’re looking for ways to diversify reporting. Chris Finlan mentions this as one scenario worth considering for the near-and-dear to my heart Report Builder (aka Power BI Paginated Report Builder).
You can profile your Power BI published datasets by connecting the SQL Server Profiler.
You can stress test your Power BI datasets, such as to ensure that they support the expected workload.
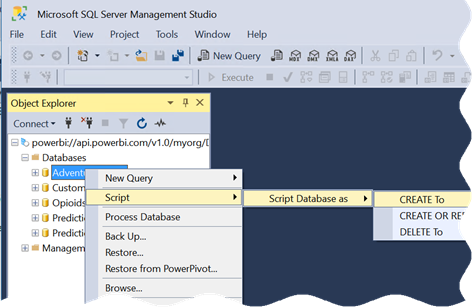
And my favorite, I can script any Power BI model to see how all these hidden features, such as grouping and binning, are coded.
Microsoft is probably finding it increasingly difficult to maintain multiple deployments for Analysis Services: SSAS, AAS, and Power BI. Once the Power XMLA endpoint is writable and Power BI dataset sizes increase, I expect them to nudge customers to deploy organizational Tabular models to Power BI Premium, to be on the latest and greatest on a single platform. I hope that it won’t require Power BI Premium too when it goes GA.
MS BI fans, join us for the next Atlanta MS BI and Power BI Group meeting on April 1, Monday, at 6:30 PM at the Microsoft office in Alpharetta. Considering all the the momentum behind machine learning, the main presentation will be “Microsoft Citizen Data Science with Power BI” by Stacey Jones, a Principal Data Solution Architect at Microsoft. I’ll do a brief overview of the brand new Modeling tab in Power BI Desktop. Vacation Express will sponsor the event. For more details, visit our group page and don’t forget to RSVP (use the RSVP survey on http://atlantabi.pass.org if you’re planning to attend).
Presentation:
Microsoft Citizen Data Science with Power BI
Date:
April 1 2019, Monday
Time
6:30 – 8:30 PM ET
Place:
Microsoft Office (Alpharetta)
8000 Avalon Boulevard Suite 900
Alpharetta, GA 30009
Overview:
Are you curious about Data Science? Are you a Data Scientist? If you answered yes and no to these questions respectively, this session is for you. In this session I will discuss the emerging Citizen Data Scientist role and demonstrate the emerging tools targeting this role, especially the new features in Power BI, such as AutoML
Speaker:
Stacey Jones specializes in mentoring and guiding firms in their efforts to build a modern Data, AI & BI governance programs that empower their business with Self-Service BI and Data Science capabilities. He currently serves as the Principal Data Solutions Architect at the Atlanta Microsoft Technology Center (MTC).
Sponsor:
Based in Atlanta, Vacation Express is one of the largest tour operators in the southeast United States and has been in business for 30 years. Vacation Express is a member of family-owned and operated, Toronto-based Sunwing Travel Group Inc., Canada’s leading vertically integrated leisure travel company, and has sold well over 2 million vacation packages to its exotic destinations!
Prototypes
with pizza
“The Power BI Desktop Model tab” by Teo Lachev
https://prologika.com/wp-content/uploads/2016/01/logo.png00Prologika - Teo Lachevhttps://prologika.com/wp-content/uploads/2016/01/logo.pngPrologika - Teo Lachev2019-03-26 18:07:142021-02-17 01:02:01Atlanta MS BI and Power BI Group Meeting on April 1st
In my previous “First Look at the New Power BI Integration with Azure ML” blog, I showed you how Power BI will make it very easy to integrate it with Azure Machine Learning and Cognitive Services. Data scientists today have plenty of options to create predictive models but all of them have one thing in common: expertise in data science and statistics.
The promise of AutoML is to bring predictive analytics to data analysts just like self-service BI brought analytics to business users.
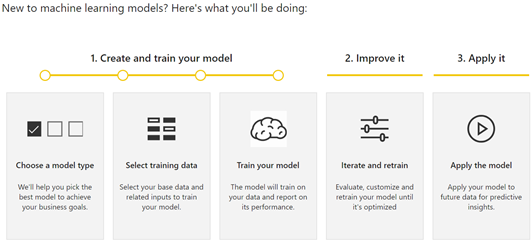
Let’s see how AutoML works based on what’s in the private preview (the usual disclaimer is that things will probably change). To start with, AutoML requires a dataflow (a note to Microsoft here is that AutoML will become more pervasive if it’s available in Power BI Desktop and it doesn’t require a premium capacity). In the private preview, AutoML requires the following steps. Presumably. the first (and most difficult step), preparing the dataset and cleansing the data is already done and available as a dataflow entity:
Choosing model type
In private preview, choosing a model type requires the data analysts to select one of four model types:
Binary Prediction – a type of a classification task where the model predicts only two (Boolean) states, such as if a customer is a potential buyer or not. It requires a Boolean outcome field.
General Classification – a type of a classification task where the model predicts more states, such as if the customer’s risk falls in Low, Medium, or High risk.
Regression – Similar to classification, regression predicts a numeric outcome, such as the customer risk on the scale from 0 to 10.
Forecasting – Time series forecasting, such as to predict the revenue for future months.
I’d argue here that if want to make this super easy, we shouldn’t be asking a business user about the type of model. Power BI can simply examine the field that needs to be predicted, which happens in the next step, and suggest the model type so the current choices can be collapsed between Classification and Forecasting.
Selecting training data
Next, you need to select the field that needs to be predicted (outcome field) and input columns. This step is the most important and arguably the most difficult even for data scientists because you need to have a business domain knowledge to guess which input fields are the most significant. Modelers tend to lean on the safer side by selecting all fields which dilutes the model accuracy. Here, it will be nice if AutoML suggests which fields are the most significant. AutoML has a validation report that shows you the key influencers after the model is ready, but it would be better if it has similar feature to aid you in the field selection.
The wizard’s next step depends on the mode type. For binary classification, it asks you to specify the field names for two states, such as Buyer and NonBuyer.
Training the model
The model is ready but requires an entity refresh to train it. At this point, AutoML generates two additional entities for providing inputs for testing and training data, such as 80% of the input dataset is used to train the model (generate the predictive patterns) and 20% is used to test the model accuracy against the historical data. The assumption here is probably let the user to fine tune the training and testing data if they want to have more control. I think though that this is too technical, and it should be handled internally by AutoML to reduce the number of entities and overall complexity.
The actual model exists on the Power BI capacity. All the training happens there, and the resulting patterns are stored there. Data does not leave the capacity and the model is not published as an experiment in Azure ML.
Iterating and retraining
One thing is to prepare the model, which is easy with AutoML, but another thing is to make sure that the model is useful and results in a true gain. This is where things get technical but AutoML seeks to simplify this with a validation report. The report has three tabs:
Model Performance – The most important information here is the key influencer charts that show you which input fields are the top predictors. You should review this chart and possibly remove input fields that are insignificant. This page also has the only input change you can make to influence the model prediction, which is to specify the probability threshold. For example, for Binary Prediction you can change the probability threshold to 50% to indicate that the customer is considered a buyer if the predicted score is equal or above 50%.
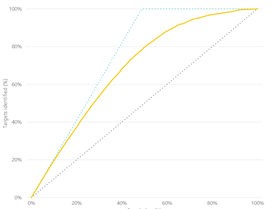
Accuracy Report – The most important information on this page is the so called lift chart. You want to verify here that the solid line is above the diagonal line which represents a random guess, i.e. if we don’t use predicative analytics but just randomly guess which customers will become buyers.
Technical Details – This page has additional technical information which will be over the head of data analysts but could be useful to pass them on to the data scientist, such as what parameters were used for the model algorithm.
Applying the model
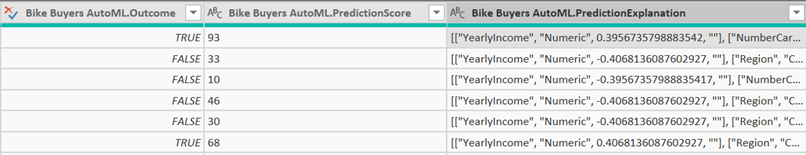
Now that you have the model trained, you can operationalize it by applying it to your original entity, that was used to train the model, or to another entity, such as a list of new customers, as long as it has the same fields that are used as input to the model. Applying the model to an entity adds yet another (computed) entity which has the original fields, plus the predicted. For example, the Binary Prediction model type adds two new fields:
Outcome – TRUE if the model predicted that the customer will be a buyer and FALSE otherwise.
PredictionScore – The likelihood of the prediction from 0 to 100.
PredictionExplanation – Additional details that include the weights of each input field to explain the predicted outcome.
So, once all is done, you’ll have 7 entities:
Original entity
AutoML entity – trains the model
Training data – entity used for training the model
Testing data – entity used for testing the model
AutoMLScore – a function used for scoring the input dataset
AutoMLPollingQuery – a helper entity which I believe returns the identifier of the model
I’d personally prefer less entities. For example, I’d rather see the predicted fields added to the entity to which the model is applied to, as opposed to having another “enriched” entity.
Power BI AutoML brings predictive analytics to data analysts. Powered by ML.NET, AutoML automates the creating of predictive models to handle common predictive tasks, such as classification and forecasting. I hope Microsoft simplifies the process by reducing the number of entities and refreshes required, and by bringing AutoML to Power BI Desktop.
https://prologika.com/wp-content/uploads/2016/01/logo.png00Prologika - Teo Lachevhttps://prologika.com/wp-content/uploads/2016/01/logo.pngPrologika - Teo Lachev2019-03-03 11:28:212019-03-03 11:31:43First Look at Power BI AutoML
MS BI fans, join us for the next Atlanta MS BI and Power BI Group meeting on March 4th, Monday, at 6:30 PM at the Microsoft office in Alpharetta. The main presentation will be “Power BI Architecture” by Paco Gonzalez from SolidQ. Eric Flamm will do us Prototypes with Pizza on configuring a Power BI visual for mobile layout. SolidQ will sponsor the event. For more details, visit our group page and don’t forget to RSVP (use the RSVP survey on the group page) if you’re planning to attend.
Presentation:
Power BI Architecture
Date:
March 4, 2019, Monday
Time
6:30 – 8:30 PM ET
Place:
Microsoft Office (Alpharetta)
8000 Avalon Boulevard Suite 900
Alpharetta, GA 30009
Overview:
Having the right architecture is key to the adoption of Power BI, and to make the most of your business intelligence solution. This session guides you through different Power BI architectures, such as Direct Query, Import, Connect Live, Composite Models, and Embedded. We will analyze different techniques in data refresh, incremental extraction, integration and collaboration to provide a quick overview of the different approaches available.
Speaker:
SolidQ North America CEO and Microsoft Data Platform MVP. Paco Gonzalez has more than 15 years leading teams for high visibility solutions on Data Platform, Business Intelligence, and Machine Learning. He is also a frequent speaker at large and small conferences. SQL Saturdays, TechEd’s, PASS BA, PASS Summit, DevWeek London, PAW Chicago and London, or Ignite.
Sponsor:
The tools and technologies to manage information will constantly evolve, but the need for accurate and actionable information is timeless. SolidQ delivers services for Microsoft platforms that help you architect, integrate and optimize your use of data. The result? Our clients think bigger and move faster because we help them build the capacity and skills to interact with data in creative, collaborative ways that deliver new insights to the business. At SolidQ we measure our success by your satisfaction – and we guarantee it.
Prototypes with pizza
“Move your PowerBI Viz to your Phone” by Eric Flamm
https://prologika.com/wp-content/uploads/2016/01/logo.png00Prologika - Teo Lachevhttps://prologika.com/wp-content/uploads/2016/01/logo.pngPrologika - Teo Lachev2019-02-26 09:35:282021-02-17 01:02:00Atlanta MS BI and Power BI Group Meeting on March 4th
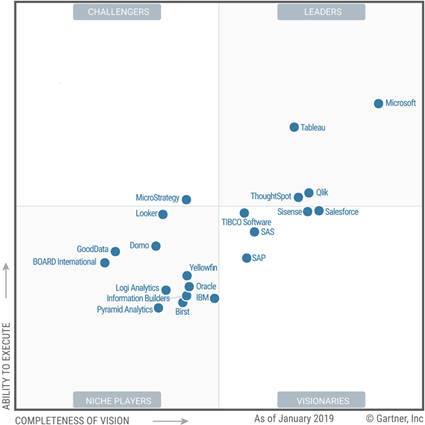
The 2019 Gartner Quadrant for Analytics and BI Platforms is out and Microsoft BI aficionados like your humble correspondent have all the reasons to rejoice. Say whatever you want about Gartner but the quadrant is a great testimonial for Power BI and I think the highest score was overdue. Microsoft still has tons of work on the visualization side of things but I’m glad that Gartner recognized the business value of Power BI which exceeds by far any other BI tool on the market. A few comments on the cautions in the report:
Differences in on-premises and cloud service with Azure cloud only – This is about the discrepancies between Power BI and Power BI Report Server which I discussed last year. Revisiting this, I’d like to know how many customers have complained. In my practice, I don’t see much interest in Power BI Report Server for deploying Power BI reports as everyone wants to be in the cloud.
Integration of Mode 1 and Mode 2 – This is the same “caution” as last year which is already covered by the first caution so I’m not sure why it’s reiterated. “With Power BI, Microsoft has mainly focused on requirements for Mode 2 (agile, self-service) analytics. On-premises SQL Server Reporting Services meets the needs of Mode 1”. I think Gartner will be happy once the SSRS integration is fully baked in Power BI Premium.
Multiple products – Kind of repeated from last year by phrased somewhat differently “Although the core of Power BI is a self-contained product, Microsoft’s roadmap spans multiple products.” So, the same comment. I don’t see a problem with having multiple products if they can integrate. Especially given that some are free, such as PowerApps and Flow with O365. The reason why they are separate products is that they don’t apply to BI only. And which BI vendor has flow, business apps, predictive models, in the same product? Not to mention that other vendors don’t have anything more than just a reporting tool.
Perhaps, the next most difficult thing after getting to the top is remaining on the top. Will Microsoft sustain the Power BI leader position or gradual attrition and shifting priorities will let smaller and more agile vendors dethrone it?
https://prologika.com/wp-content/uploads/2016/01/logo.png00Prologika - Teo Lachevhttps://prologika.com/wp-content/uploads/2016/01/logo.pngPrologika - Teo Lachev2019-02-14 16:32:272019-02-15 15:42:202019 Gartner Magic Quadrant for Analytics and Business Intelligence Platforms
MS BI fans, join us for the next Atlanta MS BI and Power BI Group meeting on February 4th, Monday at 6:30 PM at the Microsoft office in Alpharetta. The main presentation will be “Azure Data Lake for First Time Swimmers” by Samara Soucy from Innovative Architects. Julies Smith will do us Prototypes with Pizza on “Python Fuzzy Wuzzy for Master Data Identity Mapping”. Innovative Architects will sponsor the event. For more details, visit our group page and don’t forget to RSVP (use the RSVP survey on the group page) if you’re planning to attend.
Presentation:
Azure Data Lake for First Time Swimmers
Date:
February 4, 2019, Monday
Time
6:30 – 8:30 PM ET
Place:
Microsoft Office (Alpharetta)
8000 Avalon Boulevard Suite 900
Alpharetta, GA 30009
Overview:
Data Lake may be the hot new way to store data for reporting, but it can be scary if you’ve never dealt with one. If you have no idea what a data lake is, have no fear! You will get an intro to the concept of data lake and what scenarios you should be considering it as your platform. From there you’ll get to see how Azure Data Lake Analytics and U-SQL allow developers and data professionals to create compelling analytics with data that previously was difficult to work with.
Speaker:
Samara is a Microsoft Certified Specialist in C#. Working in both web and data, she has experience in a wide variety of technologies including JS, .Net, SQL, Analysis Services, and Power BI. Working with Innovative Architects as a Software Develoment Consultant, she uses that knowledge to plug into whatever part of their system needs additional expertise.
Sponsor:
Innovative Architects specializes in solving business problems around business intelligence, data management, e-commerce, portals & collaboration, custom application engineering and business process and integration. https://innovativearchitects.com/
Prototypes with pizza
“Python Fuzzy Wuzzy for Master Data Identity Mapping” by Julie Smith
https://prologika.com/wp-content/uploads/2016/01/logo.png00Prologika - Teo Lachevhttps://prologika.com/wp-content/uploads/2016/01/logo.pngPrologika - Teo Lachev2019-01-30 07:41:262021-02-17 01:01:59Atlanta MS BI and Power BI Group Meeting on February 4th
I taught my Applied Power BI class last week to a group of smart data analysts. All of them were knowledgeable of T-SQL, which they have been using extensively for years to shape and transform the data and produce SSRS, Qlik and now Power BI reports. They haven’t previously used Power Query, but they liked my overview of its features. However, they were rightfully confused when to use T-SQL, Power Query, or DAX. Starting with the data source and moving up the chain, Power BI lets you use expressions in:
Data source (custom SQL Query, SQL view)
Power Query
DAX calculated columns
DAX measures (the uppermost level)
My advice is to invest time and learn all these capabilities. When you have diverse skills, you can use the best tool for the task at hand.
Although is hard to generalize as every data transformation is different, I recommend you shape the data as upstream (closer to the data source) as possible. So, if you are familiar with T-SQL and that’s your primary data source, then use T-SQL. As one of the Microsoft best products, SQL Server has been enjoying 30 years of continuous improvements. Not only can you apply the skills you already have, but you will gain in performance when you use T-SQL and delegate data crunching to SQL Server which is what it’s designed to do. You can also benefit from the rich data manipulation features of T-SQL. These are the same reasons why I favor the ELT (Extract, Load and Transform) pattern in organizational BI solutions instead of SSIS data flow transforms. And if you find T-SQL lacking in features, Power Query can supplement it nicely, such as to fill down missing values, quickly unpivot data, or apply fuzzy lookup.
When you connect to data sources that don’t support SQL, such as flat files or Excel, the next natural place is Power Query to shape and transform the data. The choice between Power Query and DAX calculated columns is a tricky one and typically involves a compromise between performance and skill set. In many cases, you’ll find that a custom column can be implemented both in Power Query and DAX calculated columns. In general, if performance is OK, use Power Query, which is further upstream than DAX calculated columns. As a bonus, your data model will see the custom columns as regular columns and compress them equally well. Consider DAX calculated columns (one level up Power Query) when:
You must use DAX features that Power Query lacks, such as ranking.
When Power Query transforms lead to long data refresh times, such as a lookup between two large tables.
Finally, while custom columns can be often implemented in any of the first three layers, DAX measures are unique, and they typically can be implemented in DAX only. For example, if you need the expression to reflect the end user filter selection, you must use a DAX measure because only DAX measures are evaluated at run time and can access runtime conditions, such as values from filters and slicers.
https://prologika.com/wp-content/uploads/2016/01/logo.png00Prologika - Teo Lachevhttps://prologika.com/wp-content/uploads/2016/01/logo.pngPrologika - Teo Lachev2019-01-20 11:51:072019-01-20 16:32:07T-SQL, Power Query, or DAX?
MS BI fans, join us for the next Atlanta MS BI and Power BI Group meeting on January 7th, Monday at 6:30 PM at the Microsoft office in Alpharetta. The main presentation will be “Predictive Analytics with Power BI”. I’ll walk you through the existing Power BI features for predictive analytics. Mark Tabladillo will show you exiting AI features that are coming up soon. CDATA will sponsor the event and do us a 15-min demo of their Power BI connector. For more details, visit our group page and don’t forget to RSVP (use the RSVP survey on the main page) if you’re planning to attend.
Presentation:
Predictive Analytics with Power BI
Date:
January 7, 2019, Monday
Time
6:30 – 8:30 PM ET
Place:
Microsoft Office (Alpharetta)
8000 Avalon Boulevard Suite 900
Alpharetta, GA 30009
Overview:
Predictive analytics, also known as data mining, machine learning, and artificial intelligence (AI), is an increasingly popular requirement. Fortunately, you don’t have to be a data scientist to benefit from machine learning in Power BI. This session is organized in two parts:
Part 1 – We will revisit the existing machine learning features in Power BI, including Quick Insights, Explain Increase/Decrease, linear forecasting, integration with R and Python.
Part 2 – We will look at exciting new features that are coming up in near future, such as integration with Azure ML and Cognitive Services, and automated machine learning.
Speaker:
Mark Tabladillo Ph.D. is a data scientist at Microsoft. His career has focused on industry application of advanced analytics, using a variety of analytics tools including SAS, SQL Server Analysis Services, Cortana Intelligence (including Microsoft R Server and Microsoft Machine Learning Services), R, and Python. He was a founding member of the Atlanta Microsoft BI User’s Group in 2010.
Through his Atlanta-based company Prologika (https://prologika.com), a Microsoft Gold Partner in Data Analytics, Teo Lachev helps organizations make sense of their most valuable asset: their data. Teo has authored and co-authored several bestselling books on organizational and self-service data analytics, and he has been leading the Atlanta Microsoft BI and Power BI group since he founded it in 2010. Teo has been a Microsoft Most Valued Professional (MVP) Data Platform since 2010.
Sponsor:
CData Software is a leading provider of data access and connectivity solutions. We specialize in the development of Drivers and data access technologies for real-time access to on-line or on-premise applications, databases, and Web APIs. Our drivers are universally accessible, providing access to data through established data standards and application platforms such as ODBC, JDBC, ADO.NET, OData, SSIS, BizTalk, Excel, etc.
https://cdata.com
Prototypes with Pizza
“TBD”
https://prologika.com/wp-content/uploads/2016/01/logo.png00Prologika - Teo Lachevhttps://prologika.com/wp-content/uploads/2016/01/logo.pngPrologika - Teo Lachev2019-01-02 09:08:562021-02-17 01:01:59Atlanta MS BI and Power BI Group Meeting on January 7th
Power BI lets you share content directly with external users for B2B and B2C scenarios. When the benefits of this sharing option outweigh its limitations (read-only reports, requiring Azure AD federated access, per-user licensing, rendering the report inside Power BI), this is the easiest way to share Power BI content with an external party. However, the documentation, which is otherwise excellent, doesn’t explain the steps required to allow the external user to see only a subset of data when you have a dataset configured for data (RLS) security.
Granting access to an external user to a dataset configured for data security is like the proverbial chicken and egg problem. To grant access to the report, you need to share the report with the user, but you can’t add the user to the security role because the user is not provisioned yet. Hence, you’ll first share a non-sensitive report with the user before you share the actual report.
Create an organizational workspace. I recommend you create a v2 workspace for the benefits I outlined in my “Power BI Sharing Is Getting Better” blog.
In Power BI Desktop, import some sample data that is OK for the end user to see. Create a simple report for testing. A dataset is required because for some obscure reason, Power BI will prevent you from sharing an empty report that doesn’t have a dataset. Publish the Power BI Desktop file to powerbi.com.
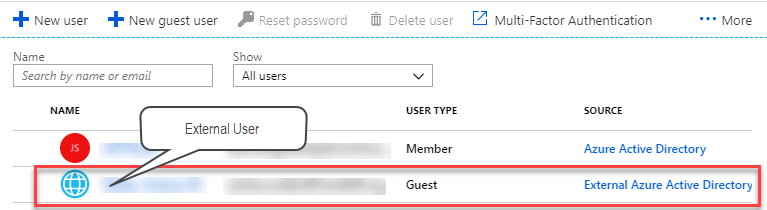
Share the non-sensitive report with the external user. At this point, if you examine the user account in Azure Active Directory in the Azure Portal (portal.azure.com), it will show that the user is invited.
When the user gets the email, clicks the link, and navigates the prompts, the user will be eventually added to your tenant’s Active Directory and will show as Guest in the External Azure Active Directory source.
Now you can assign a Power BI Pro license to this user in the Azure Portal. Remember that unless you are on Power BI Premium, any form of sharing requires a Power BI Pro license. One gotcha here is that the Azure Portal might refuse assigning a Power BI Pro license with the following error “License cannot be assigned to a user without a usage location specified.” To fix this horrible issue, go to Azure Active Directory (Users tab), click the external user, click Edit in the Settings section in the user profile, and then use the “Usage location” drop-down to select the country where the user is located.
At this point, the external user is added to your tenant’s active directory and covered by Power BI Pro license. Next, publish the actual Power BI Desktop file with the sensitive report you want to share. This file should have a role that applies a row filter to one or more tables to enforce data security in a multi-tenant dataset. Once the file is published to powerbi.com, go to the dataset Security setting and add the external user to the role by typing the user’s email.
The last step is to share the report with the external user.
TIP: If you have a lot of external users, consider assigning them to a security group so you can grant access to the group instead of individual emails. Also, instead of sharing individual reports and dashboards, use Apps to grant access to the security groups. Note that as I explained in the “Power BI Sharing Is Getting Better” blog, currently you can’t assign viewers as members of the workspace. You must use either dashboard/report sharing or apps.
https://prologika.com/wp-content/uploads/2016/01/logo.png00Prologika - Teo Lachevhttps://prologika.com/wp-content/uploads/2016/01/logo.pngPrologika - Teo Lachev2018-12-28 15:59:532018-12-28 15:59:53Power BI External Users and Data Security
If you have used SSRS, you know that paginated reports are very customizable, and you can make almost any property expression-based. Power BI is yet to deliver expression-based properties to change settings based on runtime condition, such as to change the font style based on the actual value or user selection. Currently, there are two places where you can use a DAX measure for expression-based formatting of colors:
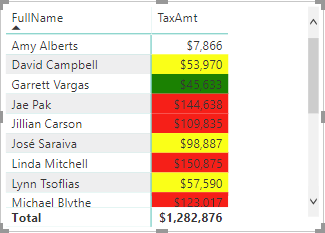
Conditional formatting
You can use a DAX measure to change the fore color or background color when you apply conditional formatting to cells in Table and Matrix reports. To do so, when you configure the conditional formatting settings, choose the Field Value option. In the following report, I used a DAX measure to format the TaxAmount field with the following formula:
Although the measure defines three bands of colors, which you can do by just using rules, it can also check additional runtime conditions, such as what field is used on the report or what value the user has selected in a slicer. You can also specify custom colors by using the hex triplet notation, such as #00AA09.
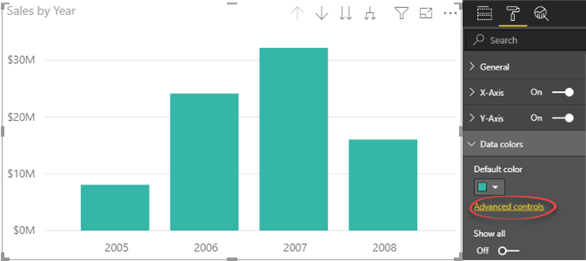
Chart data colors
Some charts with single data series, such as column and bar charts, support “Advanced controls” in the “Data colors” section of the Format tab in the Visualizations pane. This link brings you to the same window that you use to configure conditional formatting and you can use the “Field value” option to choose a DAX measure.
https://prologika.com/wp-content/uploads/2016/01/logo.png00Prologika - Teo Lachevhttps://prologika.com/wp-content/uploads/2016/01/logo.pngPrologika - Teo Lachev2018-12-15 15:34:062018-12-15 15:35:32Expression-based Formatting in Power BI
 If “XMLA” doesn’t ring a bell especially in the context of Power BI, it stands for Extensible Markup Language for Analysis. Still puzzled? It’s the protocol of Analysis Services (Multidimensional and Tabular). So, when an Excel or Power BI sends a query to a cube, it’s encoded according the XMLA specification (an XML-based format). And, the XMLA endpoint is the web service endpoint that Analysis Services listens for upcoming requests.