PROLOGIKA NEWSLETTER SUMMER 2023
 Enterprise Resource Planning (ERP) systems capture a wealth of information from main business processes within an organization, such as Sales, Inventory, Orders, etc. Therefore, a BI journey typically starts with analyzing the ERP data, with revenue analytics usually taking the center stage because of its vital metrics, such Revenue, Margin, Profit. In fact, this scenario has repeated so often for the past few years that Prologika has developed a fast-track implementation for ERP analytics. The client presented in this case study had more complicated integration needs, but other projects for both larger and smaller clients in the same or other industries have benefited from the same methodology.
Business Needs
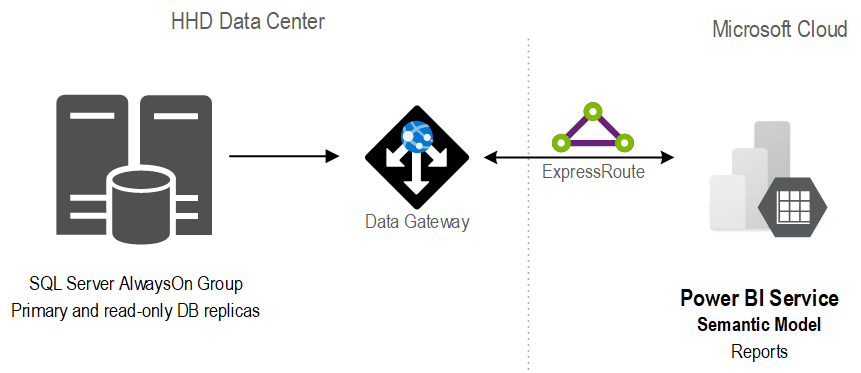
The client manufactures and distributes electrical components. The company has grown rapidly through acquisitions, with every business unit having its own ERP system, including Dynamics and other business-specific ERPs. Some ERPs were installed on premises, such as Dynamics that stores data in a SQL Server database on the company’s data center, and others were cloud systems.
The client realized that it’s difficult to analyze performance across business units and disperse ERP systems. They envisioned a centralized and fully automated reporting solution that will consolidate data from all ERPs into a single repository so they can track sales across business units, sales people, vendors, and customers. In addition, they wanted their developers to enhance and maintain the solution, so simplicity and knowledge transfer were paramount.
Solution
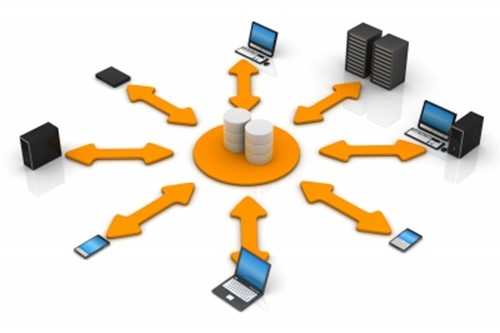
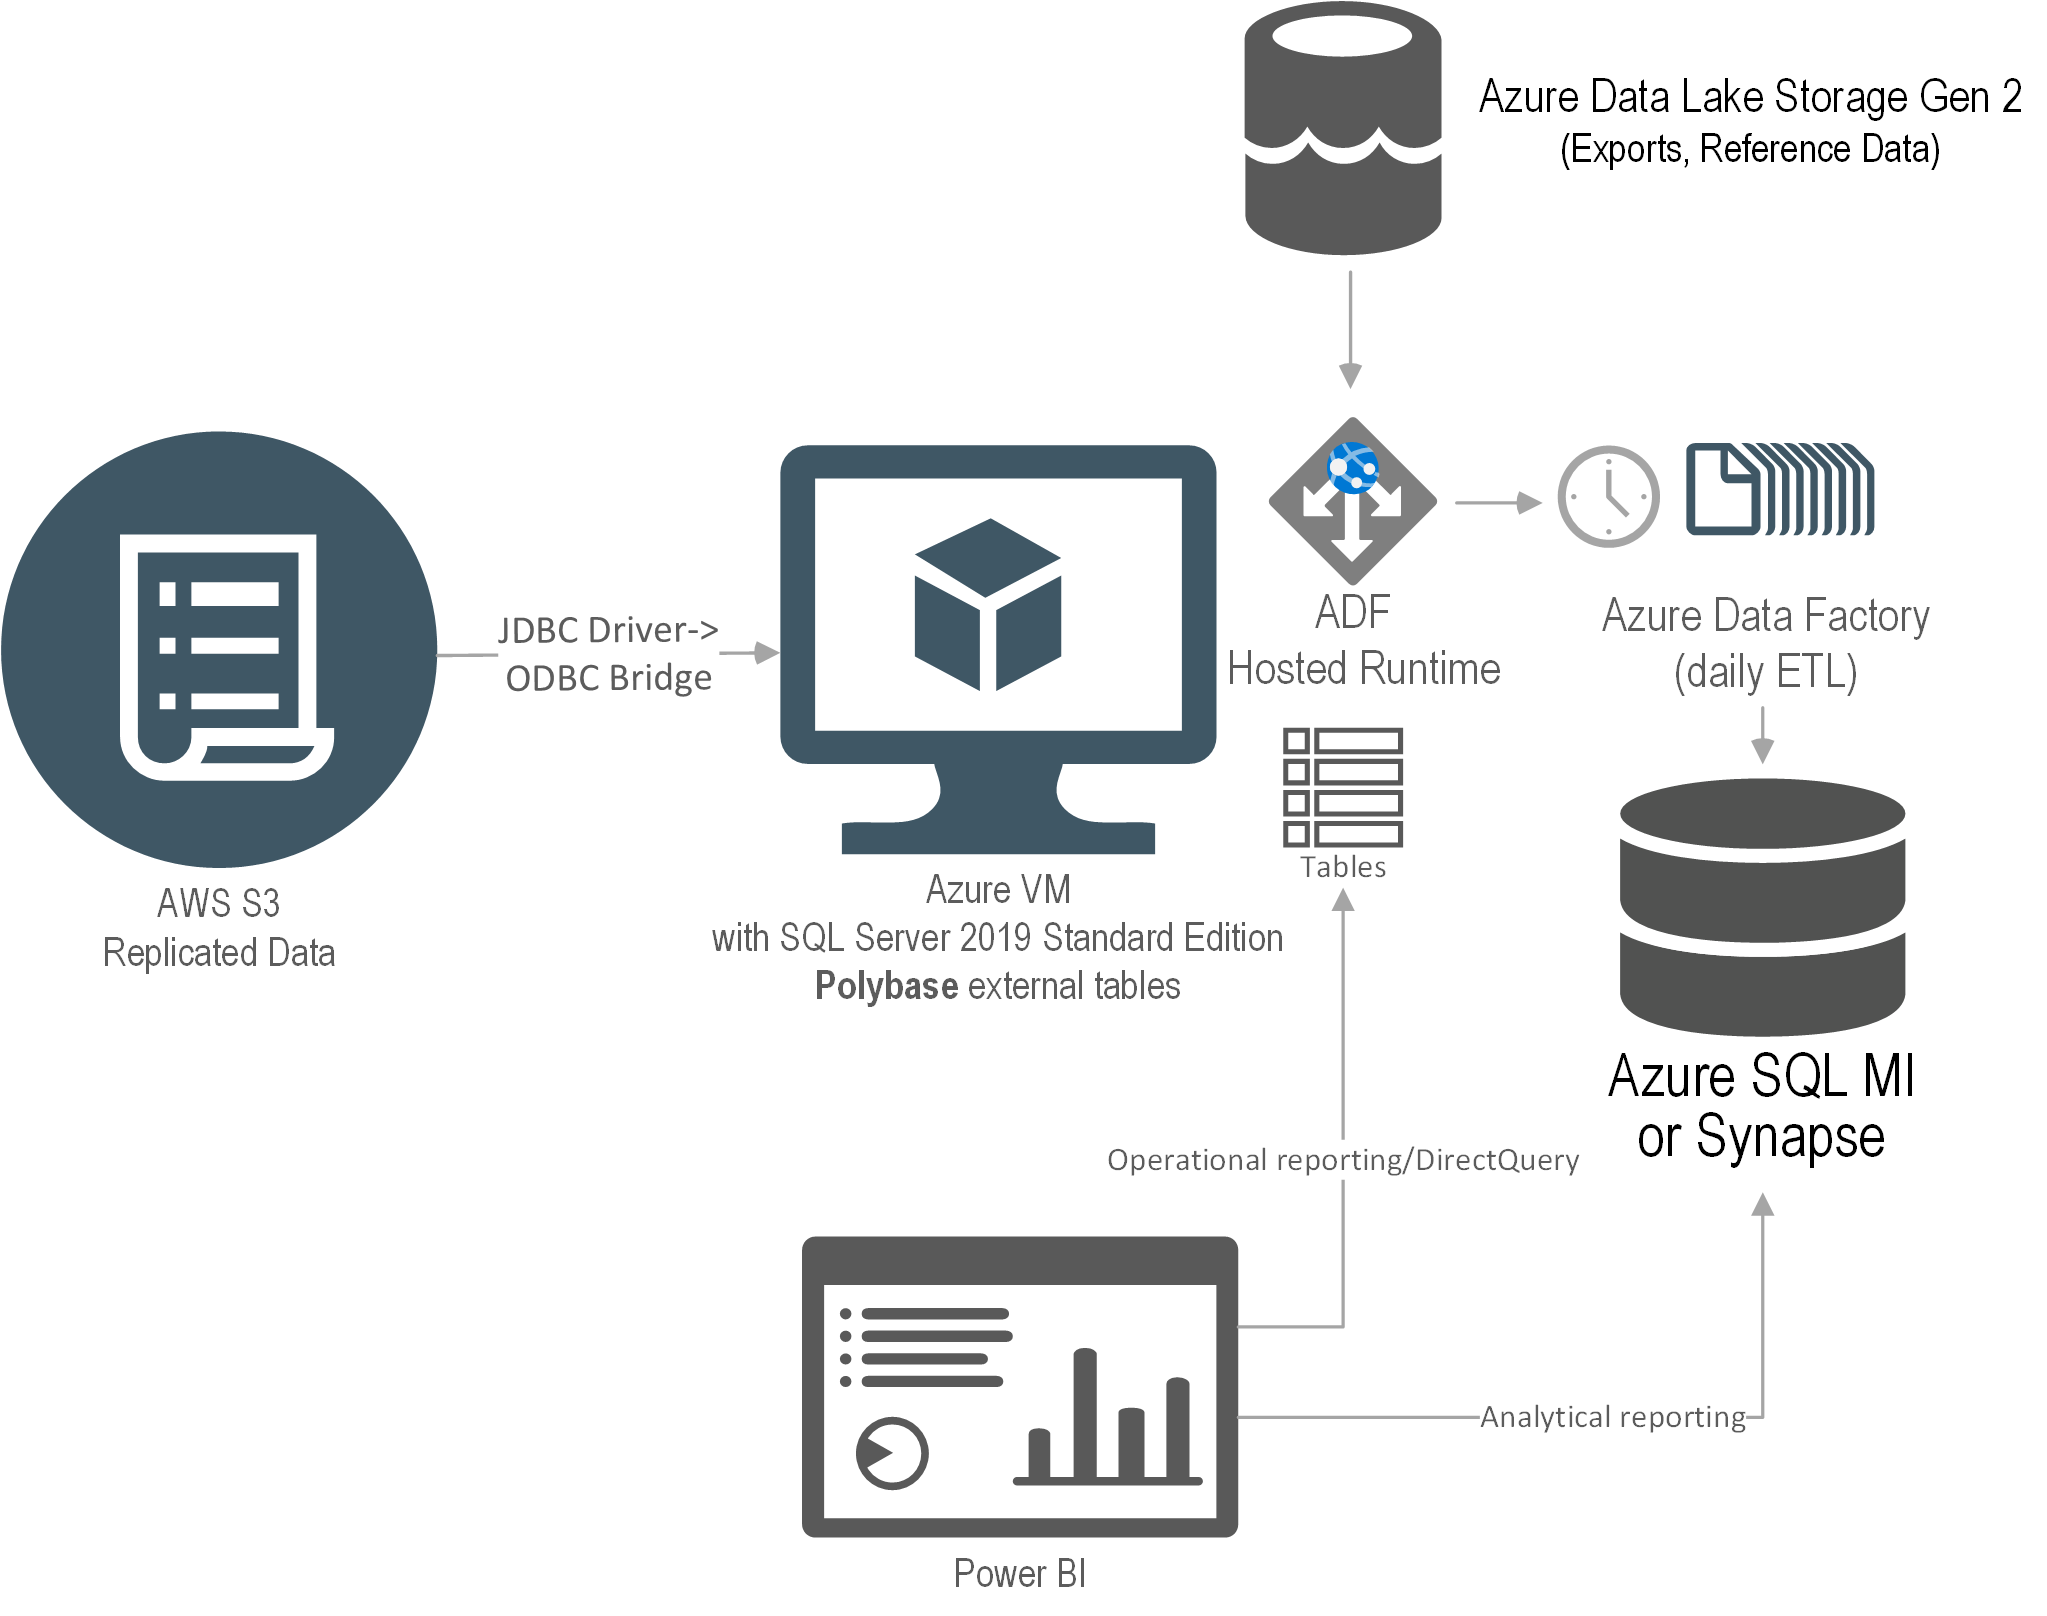
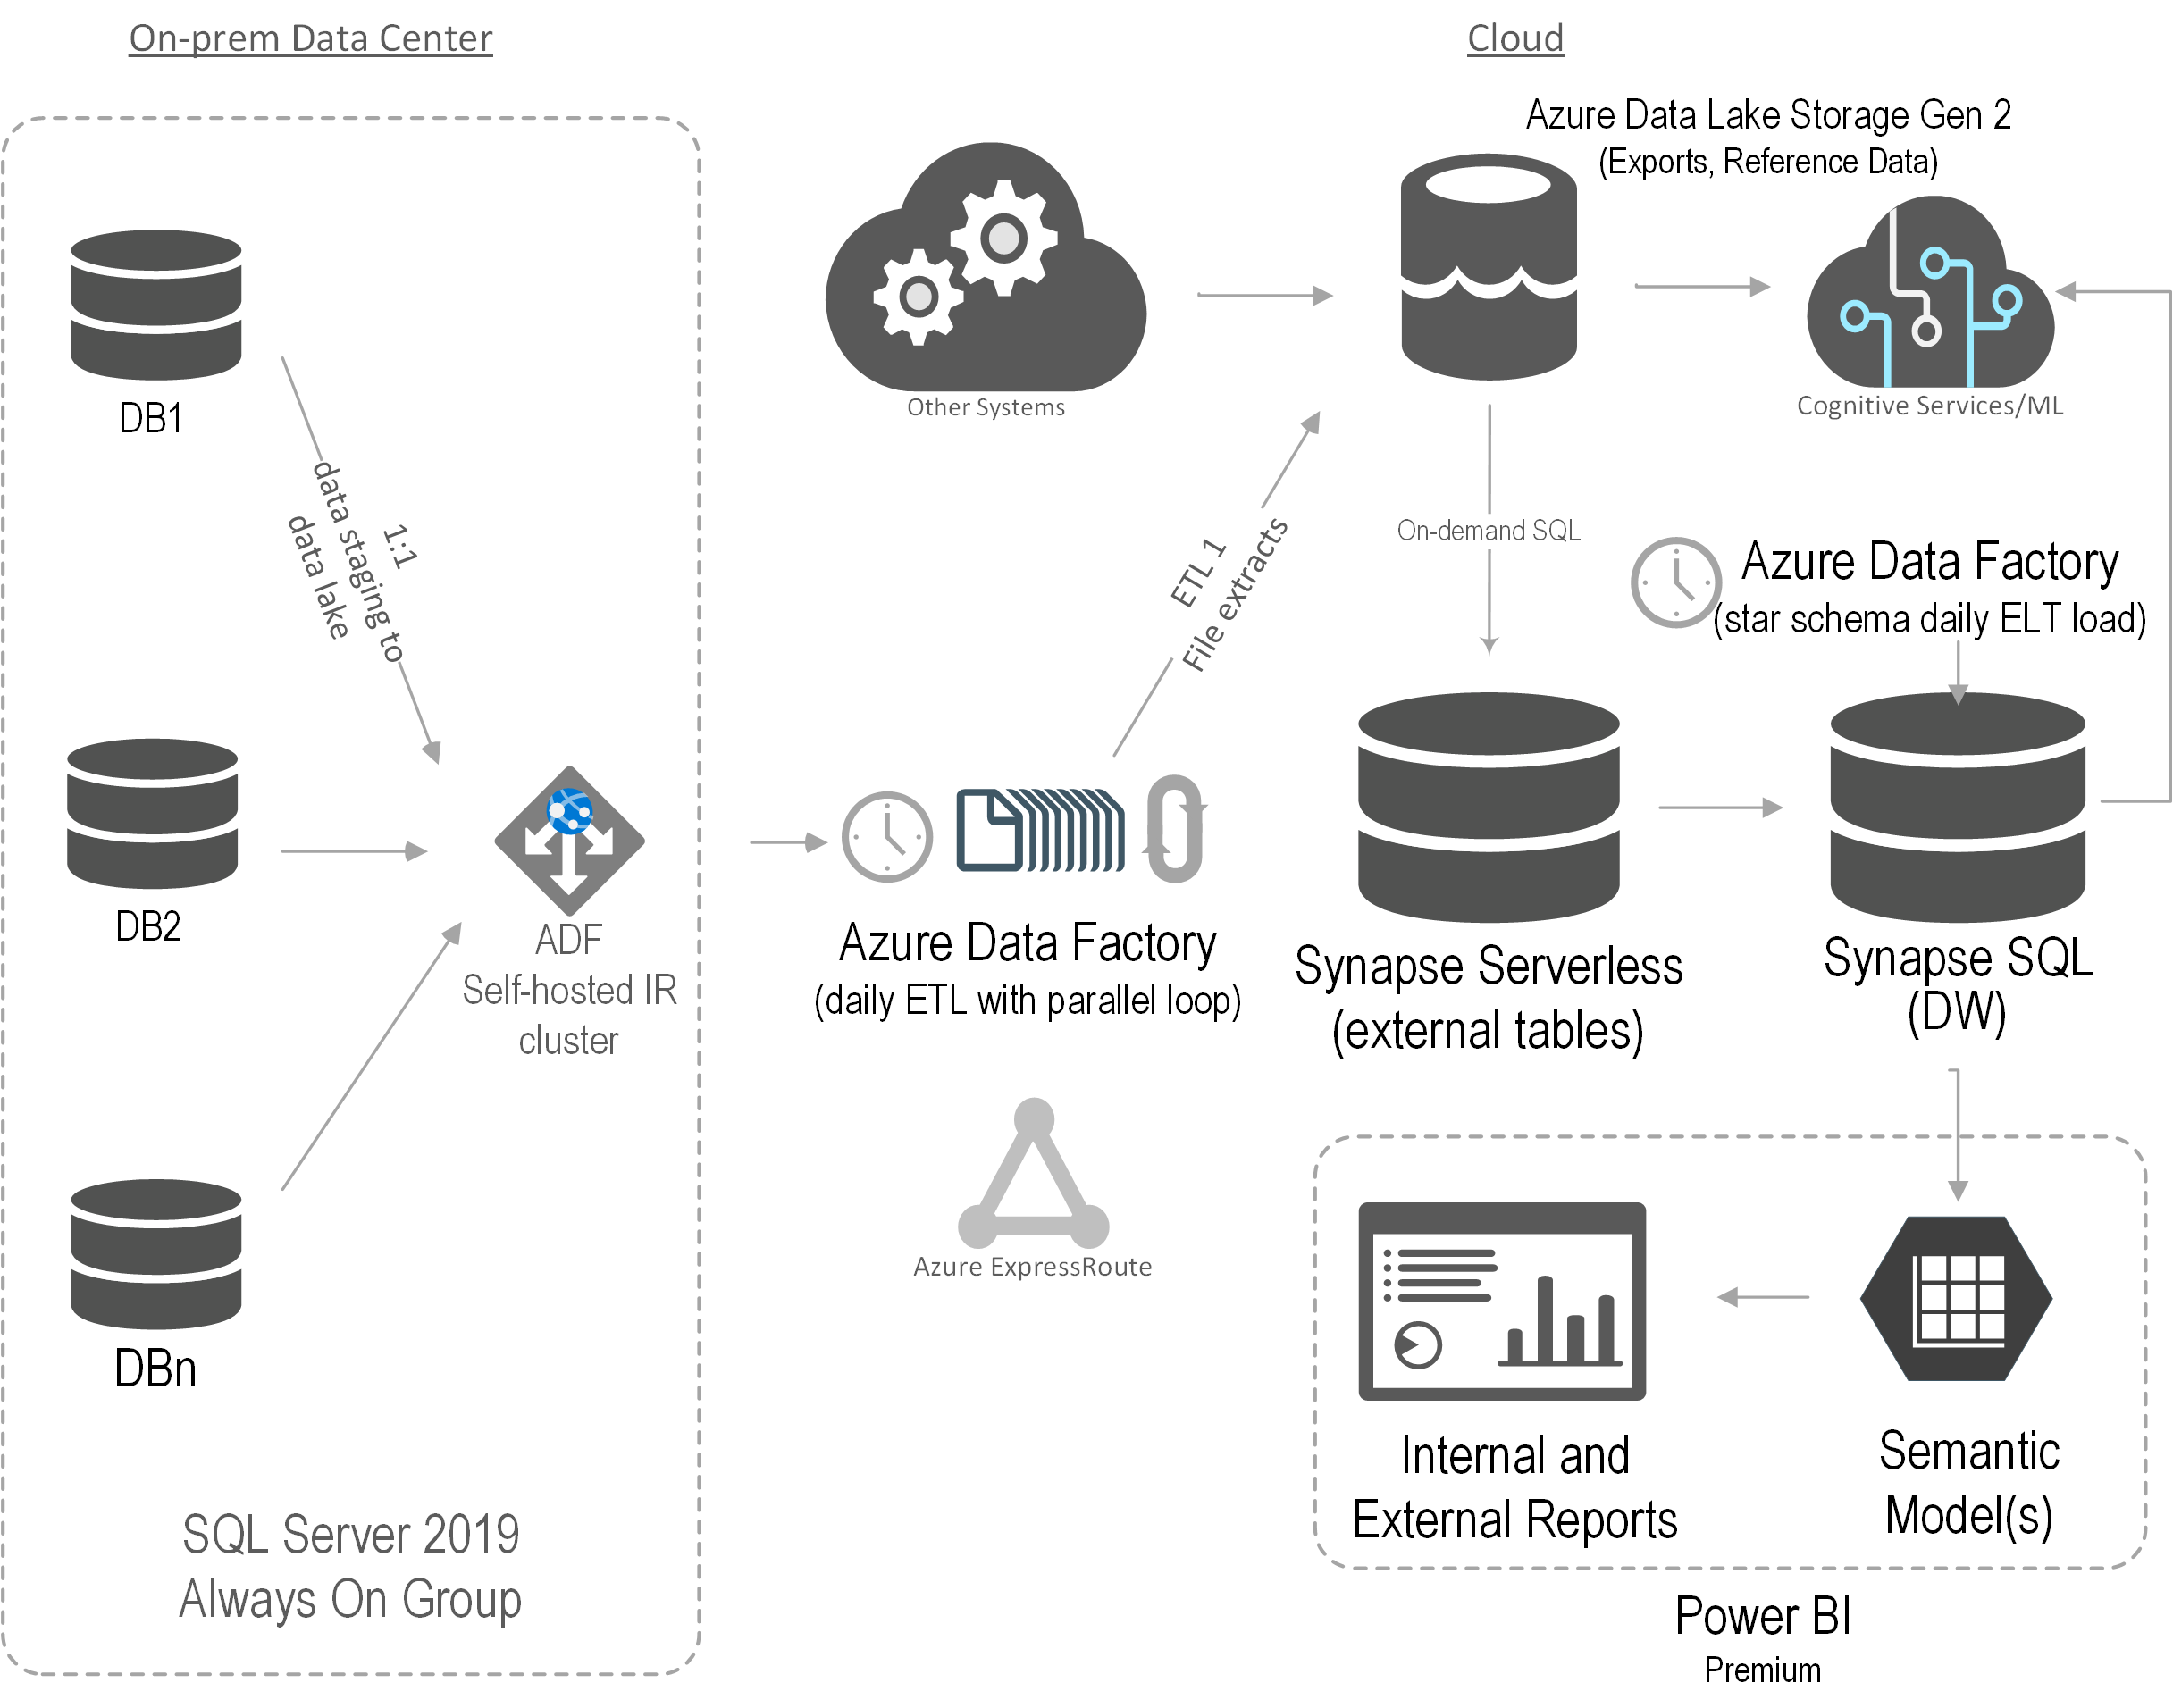
After assessing the current state and objectives, Prologika recommended and implemented the following cloud architecture:
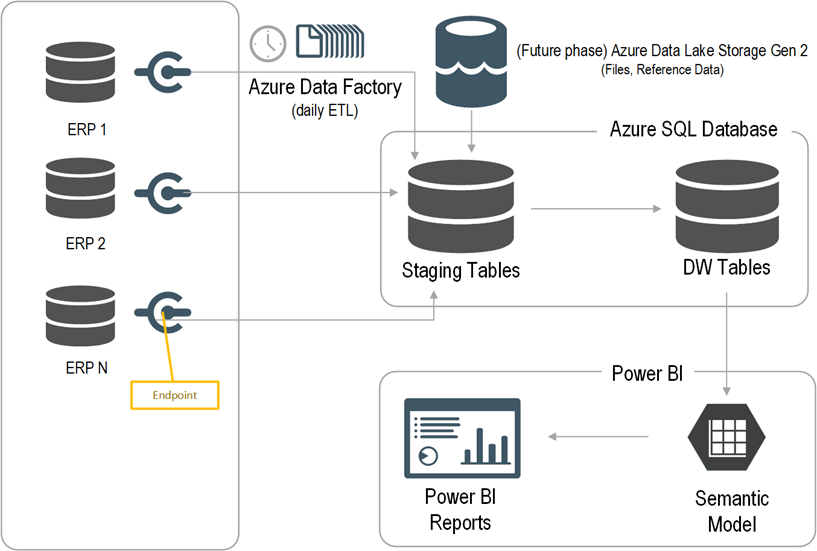
Prologika adopted an iterative approach to integrate the data from all five ERP systems where each ERP had its own iteration. Laying out the foundation, the first iteration was the most important and had the following main deliverables:
- Schema-first design – Prologika analyzed the requirements for Sales analytics and designed a star schema. The schema design was crucial because all other layers, such as ETL and semantic model, depend on it.
- Endpoints – Prologika worked with the ERP subject matter expert to implement endpoints that will provide a data feed for each table in the schema.
- ETL– Prologika used Azure Data Factory (ADF) no-code pipelines. The integration effort was dramatically reduced because all ERP endpoints would adhere to the same specification and hide the underlying details for each specific ERP, such as which tables would need to be joined. For best performance and fast knowledge transfer, Prologika followed the ELT pattern to transform and load the staged data using T-SQL stored procedures.
- Data warehouse – Prologika staged, transformed, and loaded the data into a centralized data warehouse repository whose structure was based on the star schema design in step 1.
- Semantic model – Prologika implemented a Power BI semantic model that delivered instantaneous insights and single-version of truth irrespective of the reporting tool used (Power BI, Excel, or third-party tools). The semantic model included the desired business metrics, such as time intelligence, variances, as well as data security.
- Reports – Power BI report “packs”, such as Sales Analytics, Order Analytics, were developed that connected to the semantic model. Users also could use Excel and other tools to create pivot reports without extracting and duplicating data.
Benefits
The solution delivered the following benefits to the client:
- Fast data integration – Each subsequent ETL iteration could benefit from the common architecture.
- Data consolidation – Data was consolidated into a single repository.
- Low licensing cost – The solution had a licensing cost in the range of $400/month, with the most spent in Power BI licensing.
- Easy maintenance – The client was able to quickly learn, maintain, and enhance the solution.

Teo Lachev
Prologika, LLC | Making Sense of Data
![]()
 There has been a lot of noise surrounding a data lakehouse nowadays, so I felt the urge to chime in. In fact, the famous guy in cube, Patrick LeBlanc, gave a great presentation on this subject to our
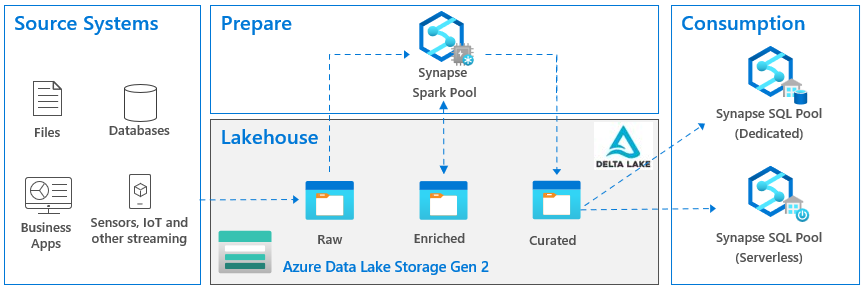
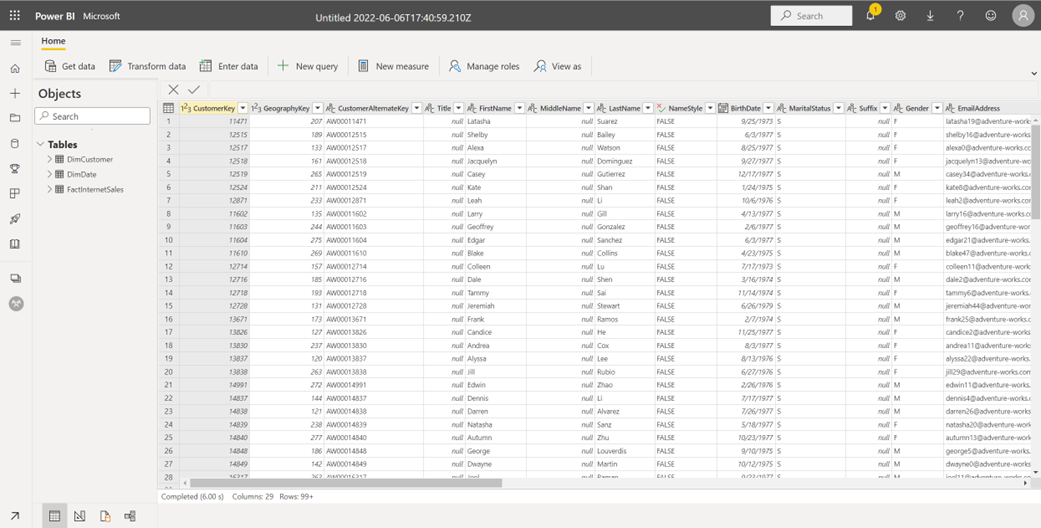
 A few days ago an exalted customer shared that they’ve acquired Synapse and now they’re ready for Power BI modeling. He just wasn’t sure how to give business users access to Synapse so cool self-service BI can finally start. In the process of the conversation, it became clear that he opened Synapse Studio and was left with the impression that Synapse has semantic modeling features. This is what happens when Marketing gets involved and people get confused about what a tool actually does. This newsletter attempts to clear up this confusion.
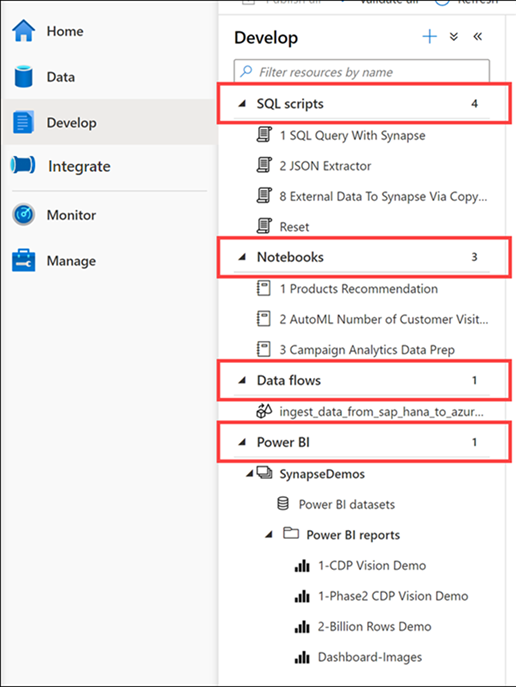


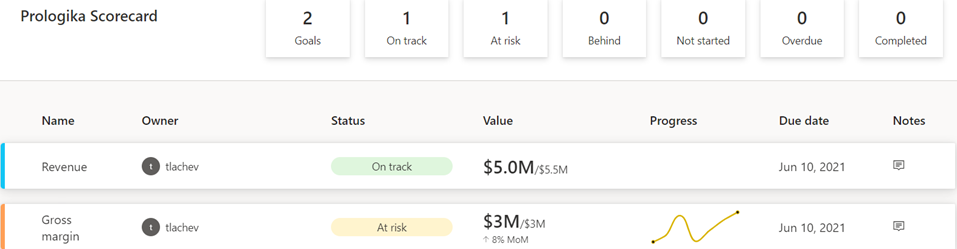
 Business Performance Management (BPM) is a methodology to help the company predict its performance. An integral part of a BPM strategy is creating and monitoring a scorecard with Key Performance Indicators (KPIs). In this newsletter, I’ll discuss how the newly released Power BI Goals can help you augmenet your BPM strategy. But before that, I’d like to share my excitement that Microsoft have recently awarded me