Designing Responsive Power BI Reports (Part 2)
In my previous post about responsive reports, I said that changes to the report design can dramatically reduce the report load time. But you will undoubtedly reach a point where you cannot optimize the report any further. After all, having a page with a single visual might be fast, but I doubt it would deliver much business value. What else can be done to speed up the reports and ideally achieve a page load time of a few seconds? Our next stop for that project is to revisit the solution architecture. The client initially opted for a hybrid architecture where the reports use live connection to on-prem SSAS Tabular models. However, a significant time was spent in Power BI showing “loading data” before rendering the report. What took so long?
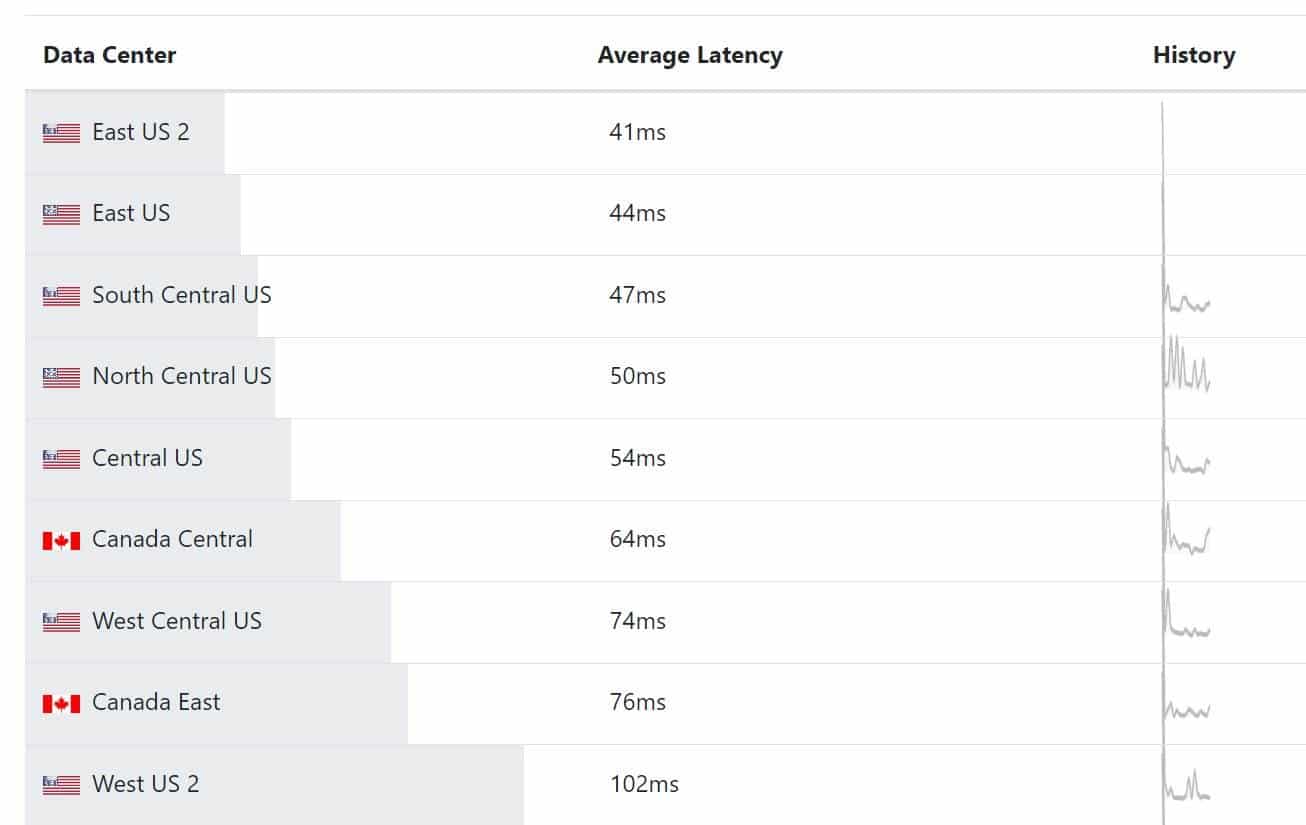
In this case, Power BI was hosted in the Azure West region, the Tabular server in the company data center in Atlanta, and most users were in the East region. This resulted in round trips crossing the country for each visual.
- A user in the East region requests a report which is hosted in the West region.
- Each visual generates a query which is sent to Tabular in the company data center.
- SSAS returns data back to the West region.
- Report payload is sent to the user in the East region.
Ideally, users, reports, and data should be in the same region. However, a long-standing limitation of Power BI is that once the first user signs up for Power BI, Power BI determines the data region based the user location and you can’t move it unless you open a support ticket with Microsoft. Power BI Premium will let you create premium capacities in a different region, but by default these capacities will be created in the original Power BI region and you can’t change the region once the capacity is created either. The chart below shows the round-trip latency doubles if the user is in the East region, but Power BI is in the West.
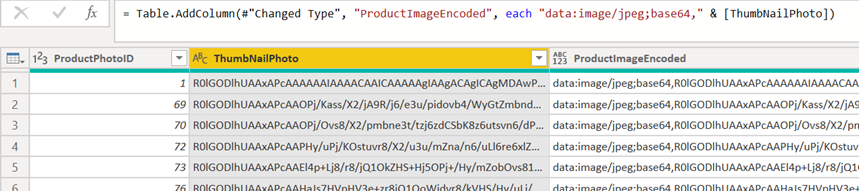
We decided to move the semantic model to Power BI so that Power BI owns the data. Besides potentially improving the report load time, this architecture has also other important advantages (to learn more, read my “Power BI Large Datasets: The Good, the Bad, and the Ugly” post). If you’re not on Power BI Premium, that “movement” might not easy if you have opted to use Visual Studio or Tabular Editor for development. That’s because Power BI Pro doesn’t expose the XMLA endpoint, so your only option is to migrate the model to Power BI Desktop. But migrating an SSAS Tabular project to Power BI Desktop is not officially supported and there is no automatic migration path.
Thanks to the enhanced dataset metadata (a better name would have been “metadata done right this time”), you could opt for cracking the Power BI Desktop file and replacing the model schema (my “Power BI Source Control” blog has the steps to get to the schema). You might get lucky especially if your Tabular project uses structured data source (the only data source type supported by Power BI Desktop). However, if it uses legacy data sources, you must change every table to use a structured data source and making changes to the JSON schema by hand and Power BI Desktop refusing the load the model with every typo is no fun.
On the other hand, Power BI Premium lets you deploy the SSAS model to the workspace XMLA endpoint. The prerequisites are:
- Upgrade the Tabular model in Visual Studio to 1500 compatibility mode. This adds special annotations to the data source. If you don’t upgrade to 1500, you’ll find that you won’t be able to schedule the dataset for refresh as Power BI Service won’t show any connections.
- Enable the XMLA endpoint for read-write in the capacity settings.
- Enable the “Export data” tenant setting in Power BI (to learn more about this setting, read my “A False Sense of Security” blog).
- Like the “Export data” battle wasn’t enough, we found that we have to beg the Security group to enable also the “Analyze in Excel with on-premise datasets” tenant setting. I have no idea what this setting has to do with the XMLA endpoint. Luckily, Fidler showed us the exact error message that this setting must be enabled.
- In Visual Studio, change the model processing option to “Do not process”. The “Troubleshoot XMLA endpoint connectivity” article has the details.
Moving the semantic model paid big dividends. We could only see “loading data” for a moment. We also found that the network speed of the user connection and the browser play a significant role. For best performance, users should use Chrome or new Edge and have a broadband connection. We were able to reduce further the load time of the first page by enabling the published dataset for query caching which is only available in Power BI Premium.


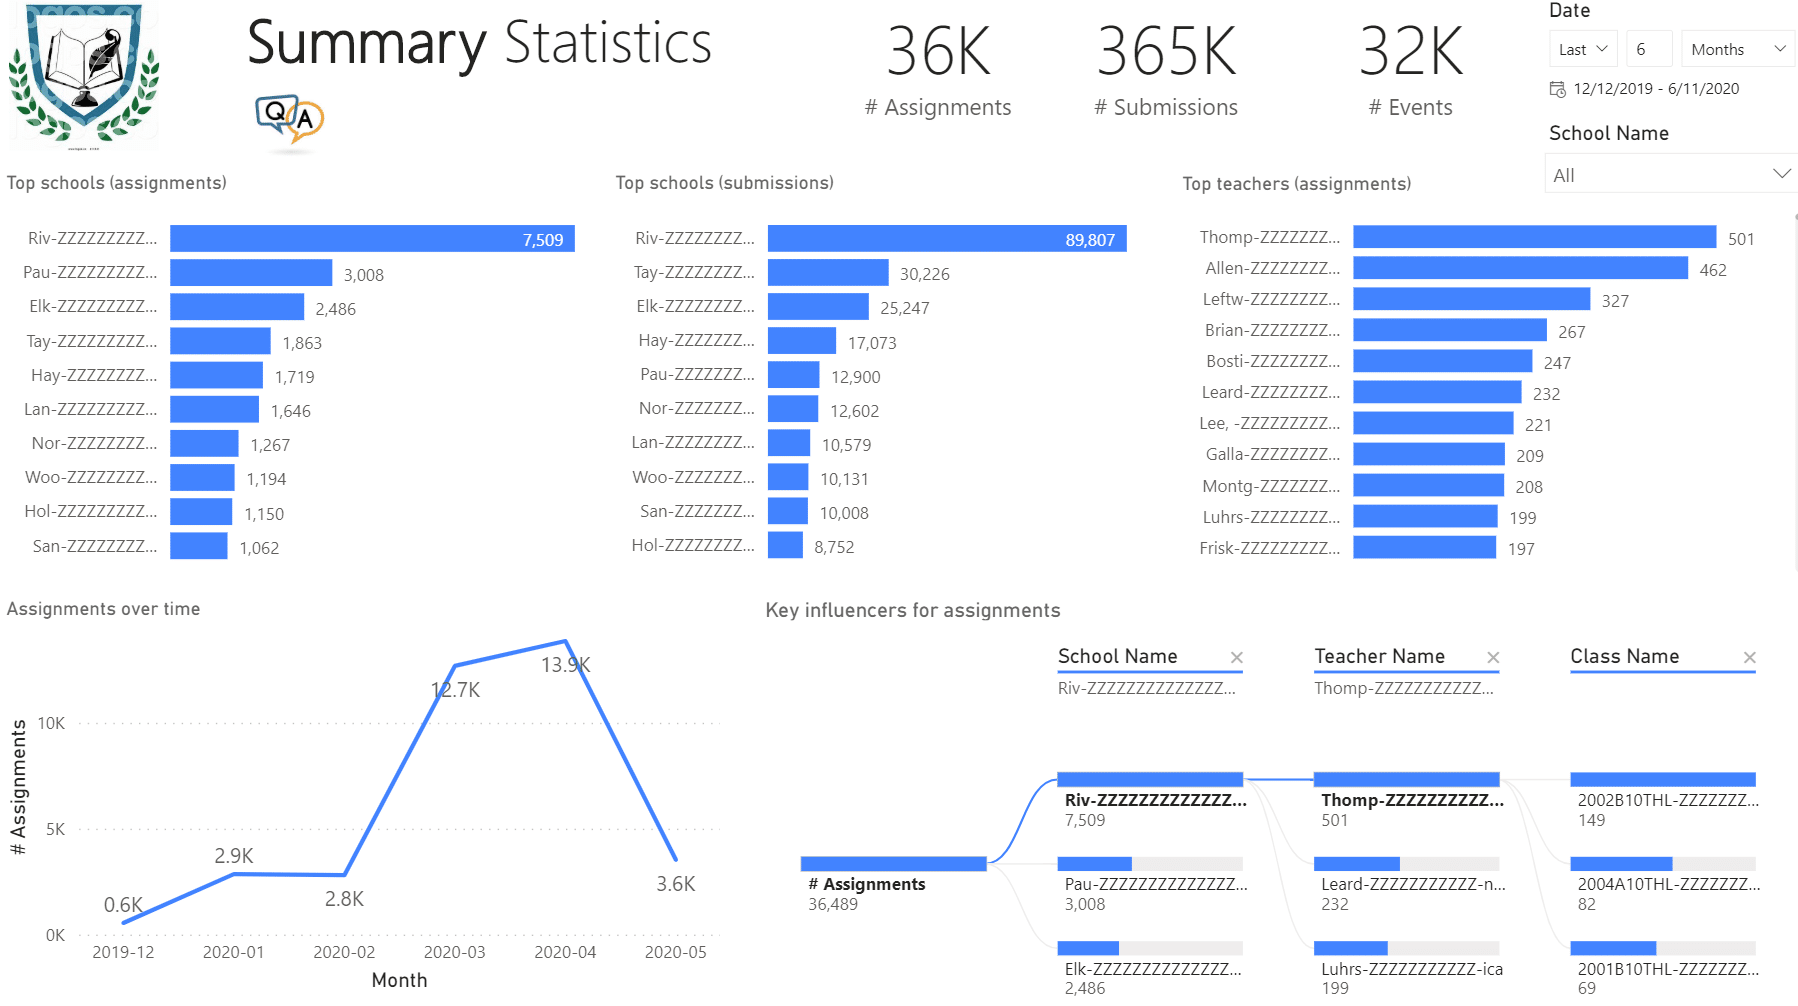
 More and more organizations are switching to Microsoft Teams mostly for online meetings. However, Microsoft Teams can deliver much more than that and it will be unjust to compare it with other popular meetings apps. In this newsletter you’ll learn how Prologika helped a public school district gain important insights from Microsoft Teams. Learn more and try an interactive Power BI report in the