Power BI Projects and Git Integration: The Good, the Bad, and the Ugly
Is it getting better?
Or do you feel the same?
Will it make it easier on you now?
You got someone to blame
U2
Likely influenced by the Gartner’s Fabric vision, Microsoft Fabric is eclipsing all things Power BI nowadays to the extent of replacing the strong Power BI brand and logo with Fabric’s. Now that the red star Synapse has imploded into a black hole, Fabric has taken its place and it’s engulfing everything in its path.
But to digress from Fabric, let’s take a look at two developer-oriented and frequently requested features that fortunately doesn’t require Fabric: Power BI Desktop projects and workspace integration with Git. The video in the link is a good starting point to understand how these features work.
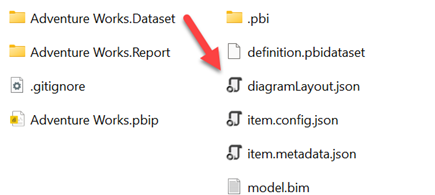
Basically, the first feature lets you save a Power BI Desktop file as a *.pbip file which generates a set of folders with human-readable text files, such as the model.bim file (has the model definition described in JSON). Next, you can put these files under source control using any source control-enabled tool, such as Visual Studio Code or Visual Studio. Currently in preview, Power BI projects is an experimental feature (in fact, the Publish button is disabled so you can’t publish a project to Power BI Service).
The second feature (workspace integration with Git) lets you configure a workspace to keep Power BI reports and datasets published to the workspace under source control. No other items are currently supported (even paginated reports). This feature is independent of the client-side project mode and it doesn’t require saving Power BI Desktop files as projects.
The Good
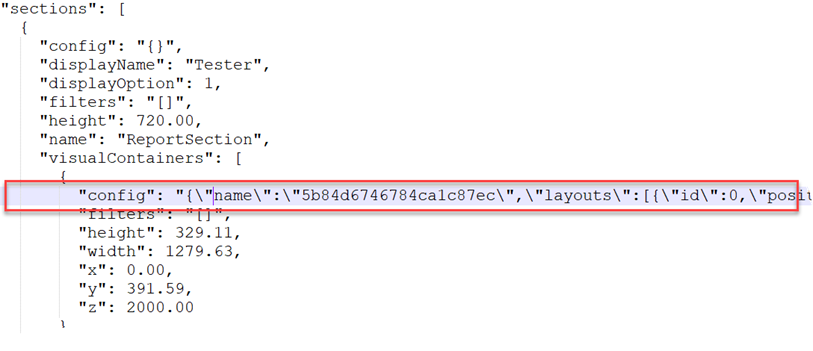
Although the primary target of PBI Desktop projects is to enable source control, a more useful side effect to me is that we can now get to and edit the report schema.
The other day someone asked me how you can apply conditional settings of one field in a visual to another. Or, how can you replace the field that has conditional settings applied without loosing them. Well, with some JSON wizardry, you can open the report.json file and make the changes there. At your risk of course because the report schema is ugly and not documented.
I also commend Microsoft for supporting Power BI workspace Git integration in Premium Per User (PPU) licensing to make it more accessible (unfortunately, it’s not available to the masses operating on Power BI Pro). I like the two-way integration in a Git-enabled workspace. It works like Azure Data Factory, so I don’t have to configure source control on the client.
The Bad
The report JSON schema is not documented and as such source code compare is difficult. Parsing a name-value collection in the visual’s config section is required to get to the useful staff.
I hope at some point Microsoft will simplify and document the report schema to let the community take over where Microsoft left off and create tools to compare the report definition.
Naturally, I’d like to see Git integration supporting all workspace items, such as paginated reports, dashboards, and Fabric artifacts.
The Ugly
If you follow my blog, you know that I’m not a big fan of Power BI Desktop for semantic modeling. Instead, I rely on Tabular Editor. When in pbix mode, changes saved in Tabular Editor appear in Power BI Desktop (the reverse is not true). That’s because Tabular Editor connected to a pbix file actually connects to the running instance of the Analysis Services engine and applies changes there. It edits the same in-memory model that PBI Desktop is connected to, thus allowing PBI Desktop to automatically refresh metadata changes.
By contrast, changes made in Tabular Editor in project mode are not reflected in Power BI Desktop.
That’s because changes made in Tabular Editor in project mode are written to the model.bim file and you need to close and open PBI Desktop for these changes to appear. This can get tedious very quickly. My recommendation would be for Power BI Desktop to listen to file changes and automatically refresh the metadata.
Summary
I’ll wait for the project mode feature to mature on the client. Meanwhile, I’ll continue with *.pbix and enable source control integration at the workspace level for clients on PPU or higher licensing. With Power BI Pro licensing, I’ll continue putting the model.bim file from Tabular Editor under source control (no source control for reports).