Prologika Newsletter Winter 2020

I hope you’re enjoying the holidays. In this newsletter, I’ll discuss a very important enhancement to Power BI that lets business users extend semantic models. But before I get to it, a quick announcement. I’m putting the finishing touches of the sixth edition of my “Applied Microsoft Power BI”! It should be available on Amazon in the first days of 2021. I’ve been updating this book thoroughly every year since 2015 to keep it up to the date with this fast-changing technology.
I’ve written extensively on the important role that EDW and organizational semantic models have for delivering the “Discipline at the core and flexibility at the edge” tenant for effective data analytics. Analysis Services Tabular is available in three SKUs: Power BI, Azure Analysis Services, and SSAS, and it’s the workhorse of Power BI Service. When you publish a Power BI desktop file, it becomes a database hosted in some Analysis Services Tabular server managed by Microsoft.
How live connections work
As the diagram below shows, Power BI uses a special live connectivity option when you connect live to Analysis Services in all its flavors (Multidimensional, Tabular, and Power BI published datasets) and SAP (SAP Hana and SAP Data Warehouse). In this case, the xVelocity engine isn’t used at all and the model is absent. Instead, Power BI connects directly to the data source and sends native queries. For example, Power BI generates DAX queries when connected to Analysis Services .
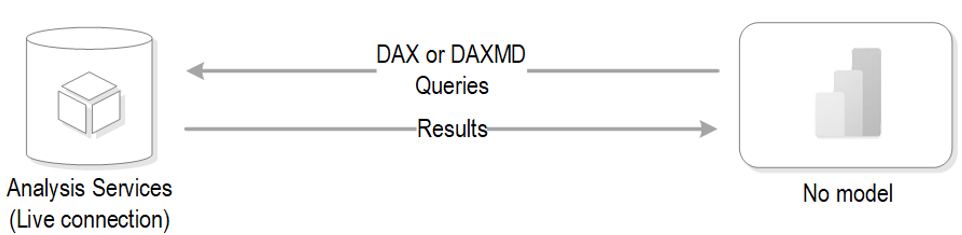
There is no Power Query in between Power BI Desktop and the data source, and data transformations and relationships are not available. In other words, Power BI becomes a presentation layer that is connected directly to the source, and the Fields pane shows the metadata from the model. This is conceptually very similar to connecting Excel to Analysis Services.
Unfortunately, once you connected Power BI Desktop to a multidimensional data source, that remote model was the only data source available for you.
Understanding the change
Power BI Desktop (December 2020 release) removes this long-standing limitation for live connections to Tabular. In the special case of connecting to a dataset published to Power BI Service and Azure Analysis Services (on-prem SSAS is not supported), you can switch from live connectivity to DirectQuery and add external data to build a composite model. This feature is very important because it allows business users to extend semantic models that could be sanctioned by someone else in the organization!
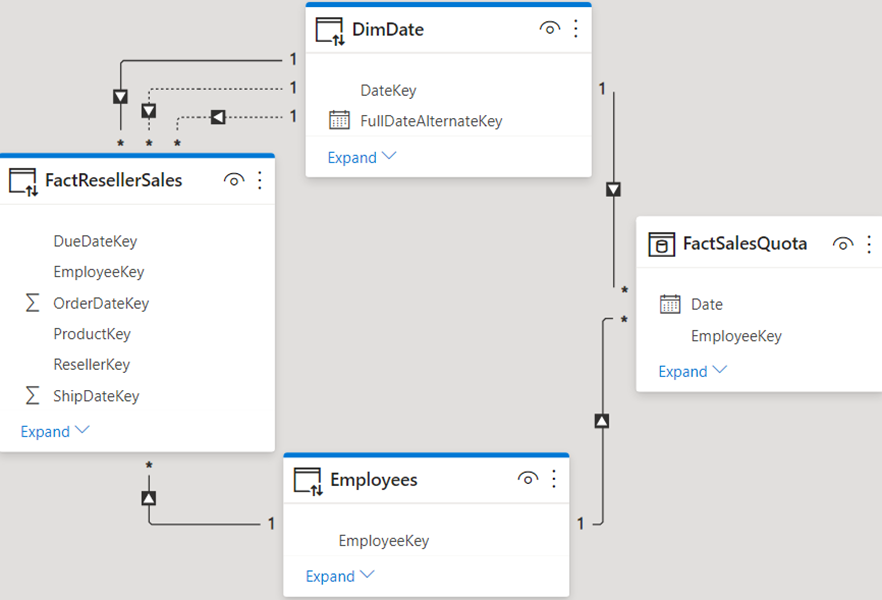
If the first connection you make is to the remote model then the connection will use Live Connect. The Power BI Desktop file will not store any metadata or data, expect for the connection string. The moment you use “Get Data” to connect to another source and accept the prompt, Power BI Desktop replaces permanently the live connection with a local DirectQuery layer and imports the metadata of the remote model. Even if you remove all external tables, you won’t be able to “undo” the change and switch back the file to Live Connect. In the diagram below, FactResellerSales, DimDate, and Employees tables are hosted in the remote model while FactSalesQuota is an external table that is imported (could be in DirectQuery mode).
What happens behind the scenes
In a nutshell, DirectQuery to Analysis Services Tabular is like other DirectQuery sources where DAX queries generated by Power BI are translated to native queries. However, in this case Power BI either sends the DAX queries directly to the remote model when possible or breaks them down into lower-level DAX queries. In the latter case, the DAX queries are executed on the remote model and then the results are combined in Power BI to return the result for the original DAX query. So, depending on the size of the tables involved in the join, this intermediate layer may negatively impact performance of visuals that mix fields from different data sources.
Applying your knowledge about composite models, you might attempt to configure the dimensions in dual storage, but you’ll find that this is not supported. Behind the scenes, Power BI handles the join automatically, so you do not need to set the storage mode to Dual. It’s interpreted as Dual internally. You can make metadata changes on top of the remote model. For example, you can format fields, create custom groups, implement your own measures, and even calculated columns (calculated columns are now evaluated at runtime and not materialized). The changes you make never affect the remote model. They are saved locally in the DirectQuery model.
Currently, row-level security (RLS) doesn’t propagate from the remote model to the other tables. For example, the remote model might allow salespersons to see only their sales data by applying RLS to the Employees table. However, the user will be allowed to see all the data in the FactSalesQuota table because it’s external to the remote model and RLS doesn’t affect it.

Teo Lachev
Prologika, LLC | Making Sense of Data
Microsoft Partner | Gold Data Analytics
![]()
 More and more organizations are switching to Microsoft Teams mostly for online meetings. However, Microsoft Teams can deliver much more than that and it will be unjust to compare it with other popular meetings apps. In this newsletter you’ll learn how Prologika helped a public school district gain important insights from Microsoft Teams. Learn more and try an interactive Power BI report in the
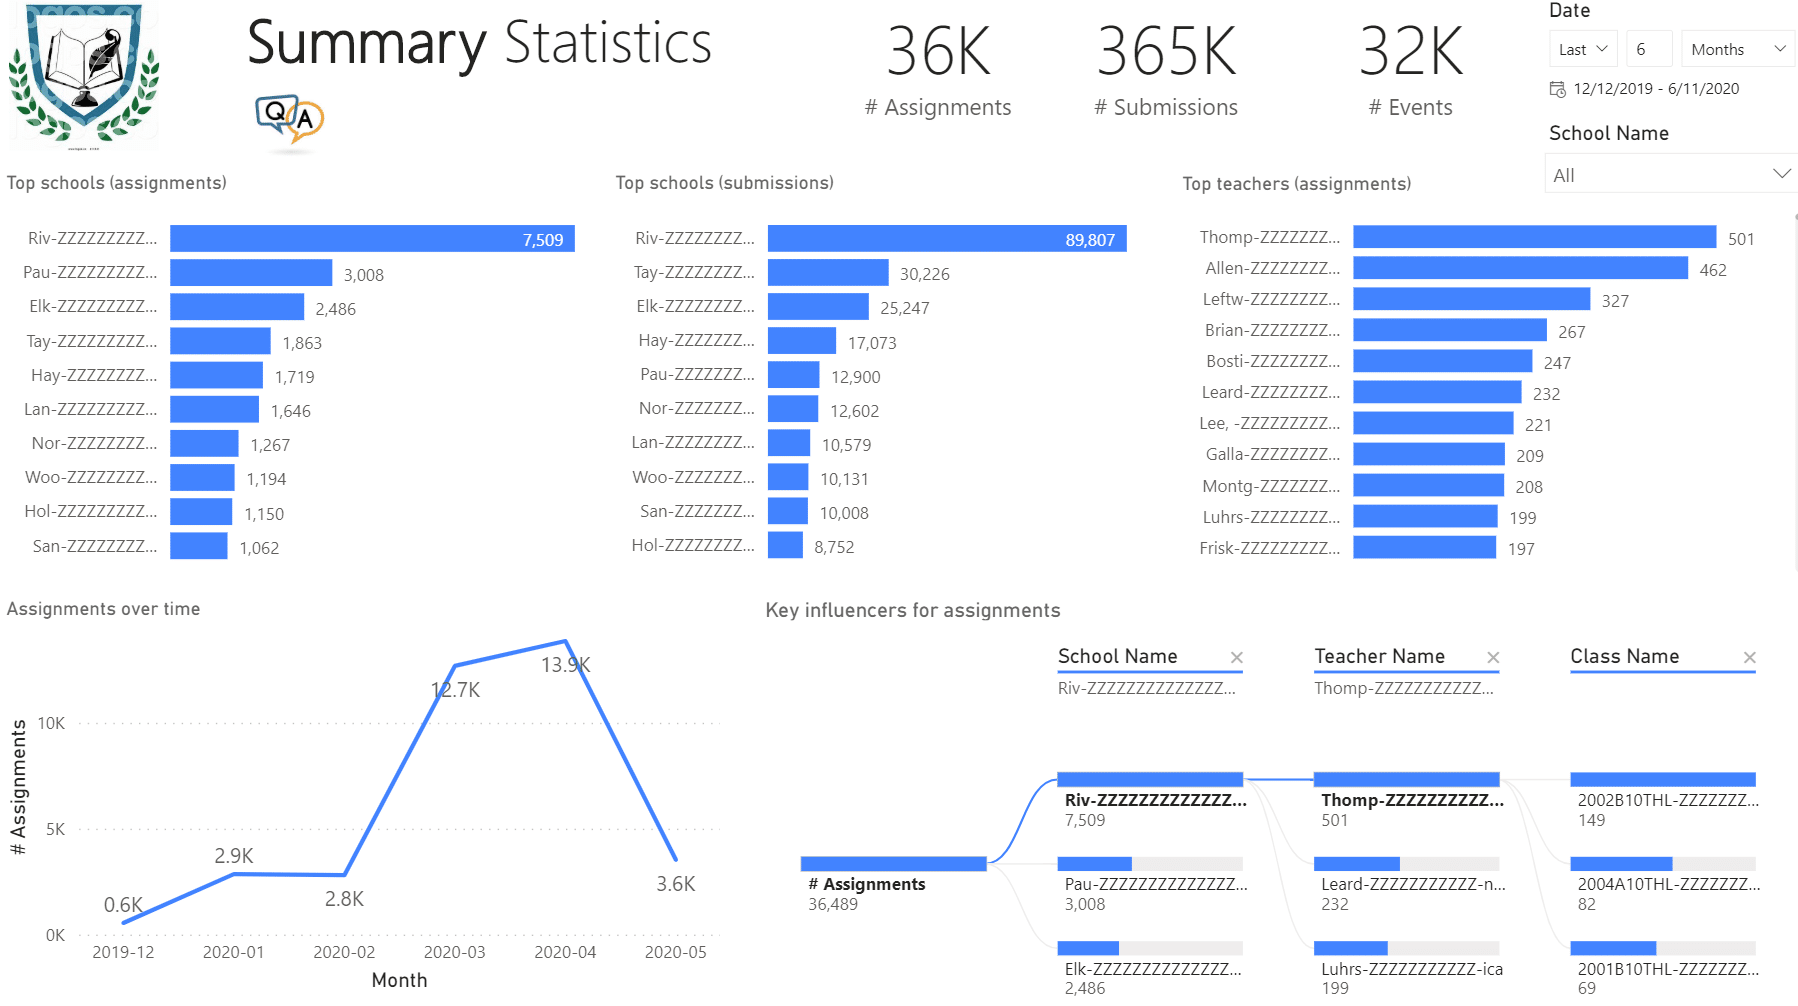
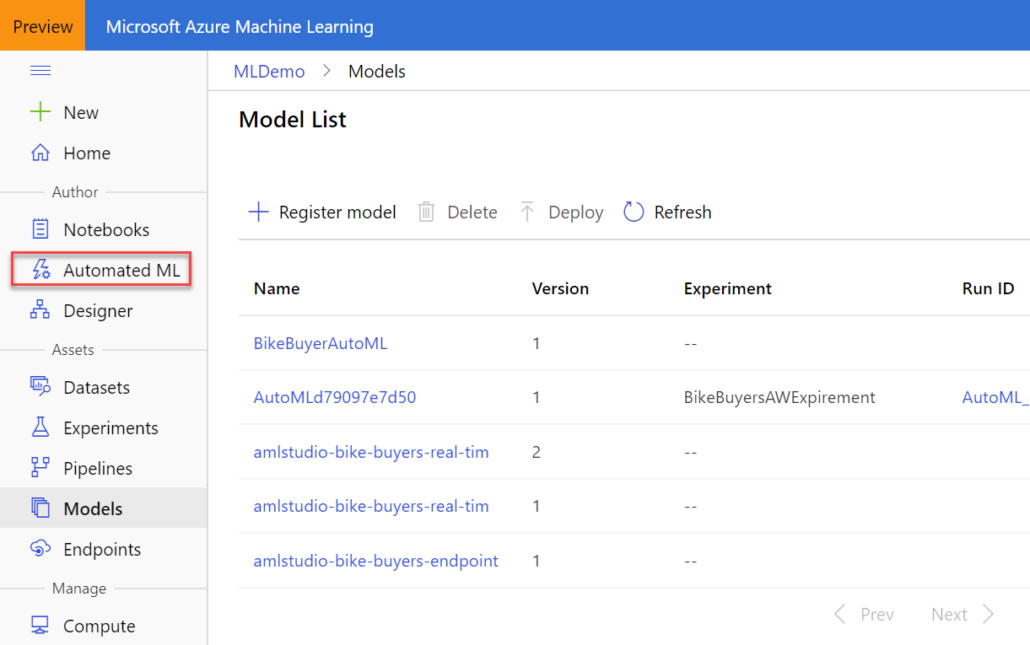
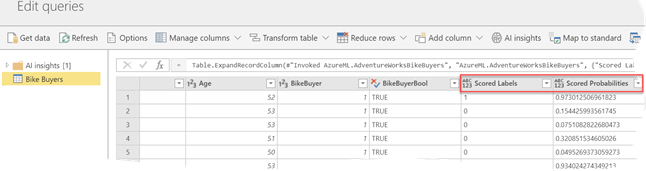
 Do you know that according to Gartner, at least five of the top 10 technology trends for 2020 will involve predictive analytics? And the third on the list is “democratization” to deliver it to non-specialists. With the growing demand for predictive analytics, Automated Machine Learning (AutoML) aims to simplify and democratize predictive analytics so business users can create their own predictive models. The promise of AutoML is to bring predictive analytics to business users, just like Power BI democratizes data analytics, Power Apps democratizes app dev, and Power Query democratizes data shaping and transformation.

 We all need to share. But until a couple of months ago, a Power BI training or assessment wouldn’t be complete unless I got hammered on the Power BI sharing limitations. Fortunately, Microsoft has addressed most of these and I have now a much better story to tell. And this is the subject of this newsletter.
 After learning how to model the data properly (the most important skill), DAX would be the next hurdle in your self-service or organizational BI journey. You won’t get far in Microsoft BI without DAX. This letter shares a tip on how to identify DAX performance bottlenecks by using a recent feature in Power BI called Performance Analyzer.
 Before I get to Performance Analyzer, I’m excited to announce my latest book:
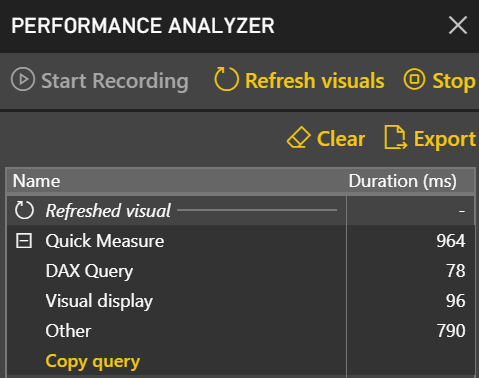
 At least five of the top 10 IT trends in 2019 identified by Gartner involve machine learning in one form or the other. The list includes autonomous things, augmented analytics, AI-driven development, digital twins, and immersive experience. Gartner also predicts that by 2022, at least 40 percent of new application development projects will have machine learning (ML). Therefore, it’s not surprising to see vendors making huge investments in predictive analytics. This newsletter focuses on two important Power BI enhancements for ML that will be available for public review soon: AutoML and integration with Azure Predictive Analytics services (Azure ML and Cognitive Services).
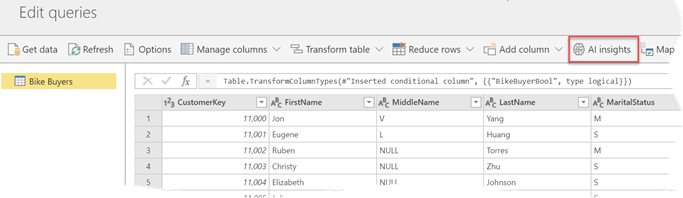
 Happy Holidays! I hope you’re enjoying this special time of the year. According to
 Semantics relates to discovering the meaning of the message behind the words. In the context of data and BI, semantics represents the user’s perspective of data: how the end user views the data to derive knowledge from it. A modeler translates the machine-friendly database structures and terminology into a user-friendly semantic model that describes the business problems to be solved. To address this need, you create a semantic model. In my “

