Posts

Atlanta MS BI and Power BI Group Meeting on March 26th

MS BI fans, join us for the next Atlanta MS BI and Power BI Group meeting on Monday, March 26th at 6:30 PM. Leo Furlong will introduce you to implementing organizational semantic models with Azure Analysis Services. BlueGranite will sponsor the meeting. And your humble correspondent will demo several latest Power BI features: persistent filters, tooltip pages, and share to anyone. For more details, visit our group page and don’t forget to RSVP (use the RSVP survey on the group page) if you’re planning to attend.

Presentation:Introduction to Azure Analysis Services
Date:March 26, 2018
Time6:30 – 8:30 PM ET
Place:South Terraces Building (Auditorium Room)

115 Perimeter Center Place

Atlanta, GA 30346

Overview:Azure Analysis Services (AAS) is an exciting tool within the Azure Data Services tool set. In this session, we’ll learn about the basics of AAS including how to create the service in the Azure portal, options for developing solutions and deploying them, processing data, scaling up and out, security, pricing, and where AAS fits in an overall modern data architecture. At the end of this session, you’ll have a basic understanding of how to get started with the tool and know how it could fit in your organization.
Speaker:Leo Furlong is an experienced Data and Analytics Principal at BlueGranite with extensive experience implementing Digital Transformation Strategy using on-premise and Azure cloud technologies.
Sponsor:At BlueGranite we help our clients utilize data as a strategic asset, delivering data architecture and data integration solutions to drive insights and analytics across your organization. Our solutions monitor trends, measure performance, and provide real-time analytics for rapid, informed decision making. We leverage industry leading technology from Microsoft to build modern data platforms that reduce operating costs, increase market share, improve workforce efficiency, and so much more.


092417_1708_AtlantaMSBI1.png

Prologika Newsletter Spring 2018

Extending Power BI with PowerApps and Flow

With hundreds of vendors out there, choosing a BI tool isn’t easy. If you’ve been following me for a while, you know that I love Power BI. One of the Power BI most prominent strengths is that it’s a part of the much broader Microsoft Data Platform that spans various on-premises and cloud offerings for data storage, processing, and analysis. Thanks to this integration, you can implement real-time dashboards, extend your Power BI reports with predictive capabilities, integrate with Big Data, and much more. In this newsletter, I’ll talk about an exciting integration option: extending Power BI with business applications, thanks to its integration with PowerApps and Flow. And if you happen to be in the Microsoft office in Alpharetta, feel free to ask for a demo of the Power BI Writeback that Prologika prepared and deployed to the Microsoft environment. You’ll be directed to one of the big screens when you can test the report that I mention in this newsletter.
What’s PowerApps?

Every organization requires some sort of custom data-driven apps. And every organization is under pressure to do more with less. Have you used Microsoft Access? If so, you probably remember that Access makes it easy to create data-driven forms. But they were available only in Access and could access only Access database. You might also remember InfoPath – an app for designing, distributing, filling and submitting electronic forms containing structured data which Microsoft discontinued in 2014. Think of PowerApps as the evaluation and replacement of InfoPath. PowerApps is an Azure-hosted service that lets you build data-driven business apps that run in a browser or on mobile devices. Unlike Access and InfoPath, PowerApps supports many cloud or on-premises data sources. Connectivity to on-premises data sources requires installed a data gateway, which is the same software that Power BI uses to tunnel into your corporate network.

Targeting power users and developers, PowerApps requires minimum code and it has its own expression language. In the process of building an app, you specify where you want your data to come from. Then, you choose pre-defined layouts for your forms and link them together. You can develop the app online or by downloading a Windows-based desktop app. Developing the app is free. Sharing the app requires a plan, but if use Office 365, chances are that your O365 business plan already includes PowerApps.

What’s Flow?

As I explained in my “Going with the Flow” blog, Microsoft Flow is another cloud service for creating automation flows without writing code, similar to Zapier’s “zaps” and IFTTT’s “recipes”. Like PowerApps, Flow targets business users and developers willing to create basic multistep flows for automating tasks. For example, you might want to start a workflow when an email is received from specific recipients or containing specific words. Microsoft Flow makes it possible to automate this scenario and many, many more. Business users can connect their accounts, take advantage of pre-built templates, and create their own flows in an easy visual designer. And your PowerApps app can start a flow thanks to the fact that PowerApps and Flow work together.

How Can PowerApps and Flow Enrich BI?

After the integration with Visio, Power BI just took another leap forward with the introduction of the PowerApps custom visual. You can use this visual in your Power BI reports to bridge the Data Analytics and Developer worlds. Now your Power BI apps can integrate with Line of Business (LOB) applications in versatile ways and the app can trigger workflows. All this with minimum code! Suppose you have a Power BI report that shows sales by customers. As the user browses the data, he realizes that some changes need to be made. Granted, the user can open the appropriate business app and make the changes there, and then go back to the report to see the changes. But read-only reports and are so 20th century. Instead, why can’t we allow the user to make the changes on the report by integrating it with PowerApps? This scenario is commonly referred to as writeback.

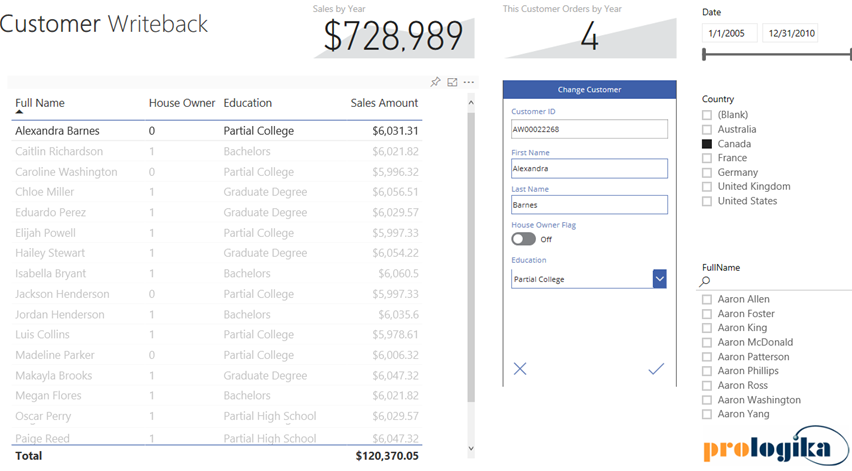
This is exactly the approach my Customer Writeback app demonstrates. The user selects a customer in the table and the customer details show up in the Change Customer visual to the right. This is the PowerApps visual that references my Customer Writeback PowerApps app. The user can make changes in the PowerApps form and save the changes back to the underlying database. Then the user can refresh the report to see these changes. Bringing this one step further, the app can start a workflow, such as when a formal approval is required to approve the changes.

022518_1855_PrologikaNe2.png

If you have experience with PowerApps, implementing this scenario takes minutes. You can find the implementation steps and source code in my “Power BI Writeback” blog.

The Power BI integration with PowerApps and Flow opens exiting new possibilities and redefines the meaning of a report. These three technologies let you integrate your reports with “smart” applications that you can implement with almost no code! Featuring more than 100 data sources, you can use PowerApps and Flow as an integration hub to mash data from almost any place, create workflows, and then embed PowerApps forms in Power BI reports.

Teo Lachev
Prologika, LLC | Making Sense of Data
Microsoft Partner | Gold Data Analytics

logo

Prologika AppSource Consulting Offers

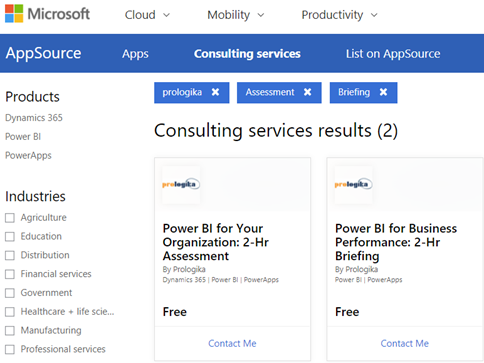
Microsoft selected and published two Prologika Power BI-related consulting offers on Microsoft AppSource. And their price is right; they are both free!

  • Power BI for Your Organization: 2 HR Assessment – Prologika will evaluate your data analytics objectives to determine how Power BI can empower your organization to understand better and improve its business.
  • Power BI for Business Performance: 2-Hr Briefing – Prologika will provide you with a free, 2-hour briefing on how our client derived tremendous value from our solution for Business Performance Management. Learn how Prologika transformed the way a large organization does financial planning by creating and comparing budgets and forecasts with our customized solution based on the Microsoft Data Platform and Power BI.

Atlanta MS BI and Power BI Group Meeting on February 26th

MS BI fans, join us for the next Atlanta MS BI and Power BI Group meeting on February 26th at 6:30 PM. Stacey Jones will explain how Power BI can integrate with other systems, such as Dynamics and Salesforce. SentryOne will sponsor the meeting. And your humble correspondent will show you two latest Power BI features: report sharing and date tables. For more details, visit our group page and don’t forget to RSVP (use the RSVP survey on the group page) if you’re planning to attend.

Presentation:

Integrating Power BI with Dynamics and Other Solutions

Level: Intermediate

Date:

February 26, 2018

Time

6:30 – 8:30 PM ET

Place:

South Terraces Building (Auditorium Room)

115 Perimeter Center Place

Atlanta, GA 30346

Overview:

Microsoft has differentiated itself for many years as the company that not only sells software, but software that works well together. For example, many companies sold suites of office productivity software, but none sold software that worked as well together as Microsoft Office. We continue that legacy today with Power BI, the leading BI software in the industry, and the integration story is improving, working well with Dynamics as well as leading 3rd party software packages, such as Salesforce!

Speaker:

Stacey Jones is a Data Solutions Architect and Business Intelligence Evangelist at Microsoft’s Technology Center (MTC) in Atlanta, GA. He has 25+ years of industry experience spanning Database Administration in both Oracle and SQL Server, Database Development, Data Modeling, and most recently as a Data Architect focused in Business Intelligence. He is an industry recognized expert in database tuning, query tuning, and Business Intelligence. He has taught many classes on these subjects and has plenty of real life experience putting out database performance fires. His experience spans the health care and transportation industry. Stacey is active on LinkedIn, you can see his profile at https://www.linkedin.com/in/stacey-jones-05989124 for more information on his industry honors and awards.

Sponsor:

SentryOne, formerly SQL Sentry, enables data professionals to monitor, diagnose, and optimize server performance across physical, virtual, and cloud environments. Our software provides unparalleled insight, awareness, and control over the true source of performance issues. Headquartered in Huntersville, North Carolina, SentryOne products are sold and supported directly and through authorized resellers and partners.

Prototypes with Pizza“Report sharing and Date tables” by Teo Lachev

092417_1708_AtlantaMSBI1.png

Overwriting Power BI Filters

Scenario: You’ve created a dashboard-looking Power BI report that has a filter. Most visuals on a report page need to show only data for the selected filter but some must ignore the filter.

Solution: There are several solutions to achieve this goal depending on requirements. Let’s start with the no-brainer and move down in complexity.

  1. Move the unfiltered visuals to another report page — Slicers and page-level filters filter visuals on the same page (note that the Power BI Desktop February update allows you to configure a report-level slicer). By moving the visuals that should remain unaffected by the slicer to another page, you’re effectively ignoring the page-level filtering.
  2. Use a slicer and “Edit Interactions” – If you use a slicer, you can use the Edit Interactions feature (Format ribbon) to specify which visuals ignore the slicer selection. Edit Interactions is described in more detail here.
  3. Consider using time calculations – For example, if most charts on the report must show data for the last 12 months, but some need to show data for the current month, you can apply the most common filter, which in this case is 12 months. For those charts that shows the last month, create a DAX Month-To-Date (MTD) measure and bind it to those charts.
  4. Overwrite page-level and report-level filters – Sometimes you can’t use slicers, such as in the case where you need more advanced filtering options or when you need to filter the report by URL (you can pass filters on the report URL only if you have page-level and report-level slicers). This is the most complex case because it requires some changes to the model as I describe below.

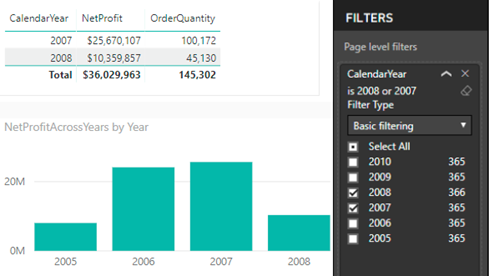
Currently, Power BI doesn’t allow you ignore page-level or report-level filters. As you’d quickly find out, Edit Interactions doesn’t work for them. When you apply such a filter, Power BI generates a query with SUMMARIZE that applies the filter as an argument to SUMMARIZE. Think of that filter as a WHERE clause that is applied after all measure-level filters. So, you might have a measure that ignores the filter, but the report would still return the rows matching the filter condition. However, you can use the following workaround to achieve the desired effect. Consider this report.

021418_2013_Overwriting1.png

In this case, a page-level filter filters CalendarYear from the Date table to values 2007 and 2008. The first Table visual returns data only for these years (no issues here). But the Chart visual shows data for all years. Follow these steps to get the Chart visual to work as shown:

You need a new measure to ignore the dimension filter. However, the key to get this to work is to use the field form the fact table on the report.

  1. Add the filter column (CalendarYear in this case) to the fact table. You can do this by different means, such as creating a DAX calculated column, creating a PowerQuery calculated column, or by PowerQuery merged queries (to look up the value from another table). The important thing is that you need to have the filtered field on the fact table.
  2. Use that field to the chart (not the one from the dimension table that the page-level filter uses).
  3. Create a measure that overwrites the filter and use that measure on the chart:

    NetProfitAcrossYears = CALCULATE(SUM(ResellerSales[NetProfit]), ALL(‘Date'[CalendarYear]))

    The measure ignores the filter on the CalendarYear field. This expands the filter context on the table to all years. Because the Year field used on the report is from the fact table, the net effect is that the data for all years is shown. This approach won’t work if the chart shows measures from two fact tables because you probably won’t have a relationship between them.

    In this post, I outlined several options to overwrite Power BI filters. It wouldn’t be nice if Microsoft enhances Edit Interactions to page and report-level filters to avoid changes to the data model.

Visual-level Formatting in Power BI

Scenario: You want to overwrite the formatting of some field in a Power BI Visual, such as in the case of showing the field in one visual with decimals and  then in another without decimals. Or, you might want to overwrite the default format when connected live to a semantic model. You search left and right, bing the Internet, and still no clue as to why Power BI doesn’t have this feature.

Answer (that you probably won’t like): Most visuals already support display units and decimals. Table and matrix would probably get this feature very soon. We don’t have ETA for full custom format string override (per visual). Your vote counts so vote on ideas.powerbi.com.

As a best practice, I recommend applying format settings in the model so that it’s applied consistently to all reports.

In the narrower case of formatting measures, you can create a new measure and change its formatting. This also works when Power BI Desktop connects to a Tabular semantic model because you can create local DAX measures on top of the semantic model. Just create a measure that piggy-backs on an existing measure, whose format you want to change. Then, use the Formatting section to change its format.

020718_1703_Visuallevel1.png

Mark as Date Table in Power BI

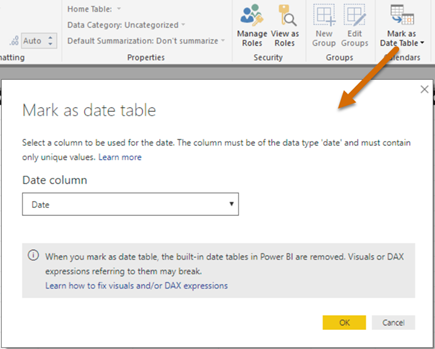
In my “Understanding Dates in Power BI Quick Measures” blog, I mentioned that having a Date table is a best practice but Quick Measures didn’t support it. Fortunately, the February update of Power BI Desktop fixes this. Now you can mark a Data table as such, as you’ve been able to do in Excel Power Pivot since the beginning.

020718_0319_PowerBIMark1.png

Marking a date table accomplishes three things:

  1. Disables the Power BI-generated date hierarchies (aka as inline hierarchies). Good riddance! Check the same blog for details of why inline hierarchies should be avoided.
  2. Allows you to use your Date table for time calculations in Quick Measures.
  3. Makes DAX time calculations work even if the relationship between a fact table and the Date table is created on a field that is not a date field, such as a smart integer key (YYYYMMDD). Previously, you had to create the relationship on a field of Date data type.

Power BI Sharing Got a Bit Better 2

A week ago, I wrote that Power BI sharing improved by giving you the ability to include specific reports and dashboards in an app. Recall that that there are three ways to share Power BI content: workspaces, apps, and dashboard sharing. Only the last two lets you share content out of a workspace, such as by sharing with free users if the workspace is in a Power BI Premium capacity.

The fast-changing cloud world brought in another nice enhancement this week: the ability to share reports, just like you could share dashboards.

Suppose you have published some content to a workspace and want to share some reports with a certain group of users and other reports with another group of users. An app can’t do it because there is a 1:1 relationship between an app and a workspace and in the process of creating an app you specify a fixed list of recipients. However, you can now share these reports individually without having to create a dashboard.

Once you open the report in powerbi.com, just click Share in the top-right corner, and you’ll be presented with the same options as when you share a dashboard. Again like dashboard sharing, you can share reports with external users thanks to the the Power BI B2B integration, as I explain in my last newsletter.

012818_2133_PowerBIShar1.png

Atlanta MS BI and Power BI Group Meeting on January 29th

MS BI fans, join us for the next Atlanta MS BI and Power BI Group meeting on January 29th at 6:30 PM. Julie Smith will hack sweet reports in Power BI. Innovative Architects will sponsor the meeting. And your humble correspondent will show you two new cool Power BI features: integration with PowerApps and Q&A in Power BI Desktop. For more details, visit our group page.

Presentation:H*ckin Sweet Reports with Power BI
Level: Intermediate
Date:January 29, 2018
Time6:30 – 8:30 PM ET
Place:South Terraces Building (Auditorium Room)
115 Perimeter Center Place
Atlanta, GA 30346
Overview:Power BI is constantly evolving; this session is an overview of the current elements of Power BI and ways to implement them, based on experience in the field using it. Topics include the Power BI Service, Power BI Desktop, Power BI Embedded, Pricing models and some details of Power BI Premium. Sample data set used in this presentation is from @Dog_Rates on Twitter.
Speaker:Julie Smith has spent close to 20 years moving data using varied tools such as MS Access, MySQL, and SQL Server versions 2000 and on. She is a Business Intelligence Consultant at Innovative Architects, where she has been implementing Power BI v2 and Azure solutions for the last couple of years.
Sponsor:Since 2005, Innovative Architects has been serving industries to help solve business and technology challenges. We provide business consulting, development and implementation services for Microsoft platforms which include BizTalk, SharePoint, .NET, Business Intelligence, Mobile Apps and much more.
Prototypes with Pizza“Power BI Writeback and Desktop Q&A” by Teo Lachev

092417_1708_AtlantaMSBI1.png

Q&A in Power BI Desktop

Natural queries (aka Q&A) has been a prominent feature since Power BI Service existed. Wouldn’t be nice to do the same in the Power BI Desktop? You can, but make sure to enable first Q&A from File, Options and Settings, Options (“Preview features”) tab because it’s currently a preview feature. Once you do this and restart Power BI Desktop, you should see “Ask A Question” button in the Home ribbon.

Sometimes the fastest way to get an answer from your data is to ask a question using natural language. For example, “what were total sales last year.” Use Power BI Q&A on the cloud or desktop to explore your data using intuitive, natural language capabilities and receive answers in the form of charts and graphs.

As of this time, Q&A requires data to be imported. It doesn’t work with DirectQuery connections. There are two ways to activate Q&A in Power BI Desktop:

  1. Double-click an empty space anywhere on a page.
  2. Click the “Ask A Question” button in the Home ribbon’s tab.

This adds an empty “Stacked Column Chart” visual and a Q&A area above it that prompts you to ask a question about your data. On the desktop, Q&A works the same way as in Power BI Service. As you type in your question, it guides you through the metadata fields and visualizes the data.

011318_1925_QAinPowerBI1.png

Once you’re done with the question, you can use the visual just like any other visuals. Unlike Power BI Service, once you deactivate the visual, such by clicking somewhere else on the page, the Q&A box disappears, and you can’t bring it back to see what question was asked.

Events

Nothing Found

Sorry, no posts matched your criteria