-
Atlanta Microsoft BI Group Meeting on August 3rd (Getting Hands-On with Microsoft Fabric IQ)
July 29, 2026 / No Comments »

Atlanta BI fans, please join us online for our next meeting on Monday, August 3rd at 18:30 ET. Dean Jurecic will introduce you to Fabric IQ that helps organizations unleash AI on top of your enterprise data. For more details and sign up, visit our group page. Delivery: In-person Level: Beginner/Intermediate Food: Pizza and drinks will be provided Agenda: 18:30-19:00 Organizer time (events, news, sponsor marketing) 19:00-20:15 Main presentation 20:15-20:30 Q&A Overview: This practical session guides attendees through the Microsoft Fabric IQ interface: exploring workspaces, semantic models, and how ontologies are surfaced within the platform. We'll connect a sample dataset to a semantic layer, define key business entities and relationships, and demonstrate how Fabric IQ uses that ontological context to generate richer, more accurate insights. No prior Fabric experience required. You'll leave with a foundational understanding of how to begin structuring your own organization's knowledge model. Speaker: Dean Jurecic is...
-
Atlanta Microsoft BI Group Meeting on July 6th (Using Generative AI on Structured Data)
June 30, 2026 / No Comments »
Atlanta BI fans, please join us online for our next meeting on Monday, July 6th at 18:30 ET. James Serra (Data & AI Solution Architect at Microsoft) will show you how AI can transform our interaction with structured data, providing practical applications for enhanced automation, decision-making, and efficiency in data analysis. For more details and sign up, visit our group page. Delivery: Online via MS Teams Level: Beginner/Intermediate Food: Pizza and drinks will NOT be provided Agenda: 18:30-19:00 Organizer time (events, news, sponsor marketing) 19:00-20:15 Main presentation 20:15-20:30 Q&A Overview: Generative AI, traditionally used for processing unstructured text, is rapidly advancing to handle structured data like relational databases, spreadsheets, and CSV files. New tools now enable AI to extract meaningful insights, identify patterns, and generate predictions from structured datasets. This presentation will explore how AI transforms our interaction with structured data, providing practical applications for enhanced automation, decision-making, and efficiency in...
-
Power BI Date Picker
June 29, 2026 / No Comments »
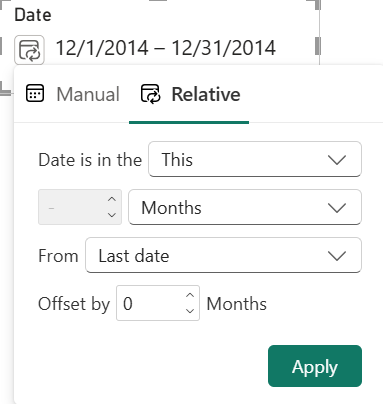
The June release of Power BI Desktop includes a preview of a new Power BI slicer configuration - Date Picker. It’s meant to solve two issues with report design. The first one is letting the user select a single date by configuring the Date Picker using the Manual selection. Yes, it took a decade, so we must appreciate the engineering effort to get this implemented, so we don’t have to rely on workarounds as Patrick explains here. More importantly, it helps with filtering the “current” period, so the end users don’t have to change filters when the calendar rolls forward. Previously, we had to resort to overwriting the current period caption, such as renaming the current month to “Current”, so the slicer automatically rolls forward when the current month changes. Or configure the slicer to use relative date, such as This Month. The problem with both approaches has been that...
-
Open Semantic Interchange (OSI)
June 9, 2026 / No Comments »
An excited enterprise client came back from a conference where Snowflake delighted them with AI demos and semantic views built on Open Semantic Interchange (OSI) standard. Snowflake even went further to show how their Cortex Analyst tool returns deterministic AI answers. Naturally, given their existing investments in Snowflake data lake and ODS, the client questioned why we don’t build everything in Snowflake instead of bringing Microsoft Fabric and two vendors into the mix. What’s OSI? Reading about the relatively freshly baked OSI, we learn that “the Open Semantic Interchange is an industry-wide specification effort to standardize how we exchange semantic metadata across analytics, AI and BI platforms, providing a vendor neutral, single source of truth for semantic data.” Great, I am all about standardization. If you ask me, the world should adopt the metric system and English as a universal language, and life will be much simpler. But this is...
-
Give Me Your Data!
June 4, 2026 / No Comments »
If Microsoft Fabric was the Statue of Liberty, the inscription would be “Give me your data”. Fabric is obsessed with owning the data when it makes sense and when it doesn’t. As I wrote before, this pattern was probably borrowed from Palantir and to align Fabric with the push for “modern” medallion architectures. Or, to establish a permanent dependency on Fabric… Auto-replicating data to Fabric To satisfy the Fabric data appetite and facilitate data ingestion into OneLake, Fabric offers two primary options that don’t require explicit ETL: mirroring and shortcut transformations. Mirroring targets a growing number of relational and non-relational database engines. Although described as “easy-to-use”, mirroring could prove challenging to set up in real life. For example, in one case, the client simply refused to set up mirroring from Google BigQuery because of the requirement to grant excessive permissions. In another case, we are still trying to figure out...
-
Atlanta Microsoft BI Group Meeting on June 1st (Build Your First Agent in Copilot Studio)
May 26, 2026 / No Comments »
Atlanta BI fans, please join us in person for our next meeting on Monday, June 1st at 18:30 ET. Elayne Jones (Senior Solution Engineer at Microsoft) will show you how to build enterprise-ready agents with Copilot Studio. These agents can source data from a variety of data sources including Fabric Data Agents. I will sponsor the meeting. For more details and sign up, visit our group page. Delivery: In-person Level: Intermediate Food: Pizza and drinks will be provided Agenda: 18:15-18:30 Registration and networking 18:30-19:00 Organizer and sponsor time (news, Power BI latest, sponsor marketing) 19:00-20:15 Main presentation 20:15-20:30 Q&A Overview: A practical, hands‑on session for anyone ready to move beyond generic AI chat and start building purpose‑built, enterprise‑ready agents. You’ll learn what agents really are, how they differ from traditional chatbots, and where Copilot Studio fits alongside Microsoft 365 Copilot and Azure AI services. Speaker: Elayne Jones is a Senior Solution Engineer...
-
Replicating BigQuery to Fabric Reloaded
May 20, 2026 / No Comments »

In a previous post, I referred to an engagement where we used the Fabric Copy Job activity to replicate Google BigQuery tables to Fabric, so we can use Direct Lake semantic models. A few months later, the client reported that they pivoted from the Copy Job to notebooks using the Spark BigQuery connector for two main benefits: Much better copy performance – Although the Copy Job would copy tables in parallel, the Spark BigQuery connector reduced significantly the data transfer time. The Copy Job would fully copy all tables in about 40 min. With the Notebook, while the tables run sequentially instead of in parallel, most tables would take between 20-30 sec and one huge 140M fact table takes around 2 minutes to copy fully. Altogether, the required tables take about 20-22 minutes to load, which is almost half the time less than the Copy Job. Upon further research to...
-
Atlanta Microsoft BI Group Meeting on May 4th (Making Sense of Copilot in Power BI)
April 28, 2026 / No Comments »
Atlanta BI fans, please join us in person for our next meeting on Monday, May 4th at 18:30 ET. Jackie Kiadii will show you how you use the Copilot capabilities in Power BI. CloudStaff will sponsor the meeting. For more details and sign up, visit our group page. Delivery: In-person Level: Beginner/Intermediate Food: Pizza and drinks will be provided Agenda: 18:15-18:30 Registration and networking 18:30-19:00 Organizer and sponsor time (news, Power BI latest, sponsor marketing) 19:00-20:15 Main presentation 20:15-20:30 Q&A Overview: Copilot in Power BI is generating excitement — and significant confusion. Between multiple Copilot experiences, Fabric capacity requirements, and differences across Desktop, Service, and Fabric, many Power BI professionals struggle to explain what Copilot actually does and when it makes sense to use it. This session provides a clear, practical overview of: Copilot use cases that exist today Where Copilot works (and where it doesn’t) Licensing and capacity requirements Current limits...
-
Power BI Unmaterialized Columns
April 27, 2026 / No Comments »
Coming back from a long vacation, I’ve almost missed this interesting Power BI enhancement: Power BI unmaterialized calculated columns. Normally, I avoid the traditional DAX calculated columns for a variety of reasons, such as confusion about where business logic is applied, limited support across storage modes (for example, Direct Lake doesn’t support them), longer refresh times, etc. This not to say that calculated columns can't be useful, such as in the case where you need to flatten a parent-child hierarchy. But unmaterialized calculated columns could open interesting scenarios that go beyond content translation to other languages mentioned by Microsoft in the April 2026 update. Understanding unmaterialized columns To start with, the announcement does a good job to confuse the audience by implying that they are applicable only to Direct Lake storage mode. I’ve found the documentation page more useful to understand them (specifically this table). The important takeaway is that...
-
Direct Lake Composite Models
March 4, 2026 / No Comments »
I’ve mentioned previously in the “A Couple of Direct Lake Gotchas” post that unlike Power BI reports, Excel surprised me by not showing user-defined hierarchies in a Direct Lake model. Direct Lake comes with other gotchas, such as not supporting DAX calculated columns and SQL views. I normally don’t use calculated columns, but they can come in handy, such as for flatting a parent-child hierarchies outside ETL. And I like SQL views as an insurance policy for making quick transforms or filters on top of loaded tables to avoid ETL changes. Recently, Microsoft introduced composite Direct Lake models which I demonstrated as a part of a pilot project, mainly to preserve the Excel report experience for financial users. Direct Lake Only vs Composite Direct Lake I view the composite Direct Lake models as the best of both worlds and this table summarizes their characteristics. Direct Lake Only Composite (Direct Lake...
Training
 We offer onsite and online Business Intelligence classes! Contact us about in-person training for groups of five or more students.
For more information or to register click here!
Books
 Learn Power BI at your own pace with our latest book Applied Microsoft Power BI. Targeting information workers, data analysts, pros, and developers, It is designed as an easy-to-follow guide for learning how to implement BI solutions spanning the entire personal-team-organizational BI spectrum.

