-
Tips for Configuring Azure Data Factory Alerts
April 15, 2024 / No Comments »
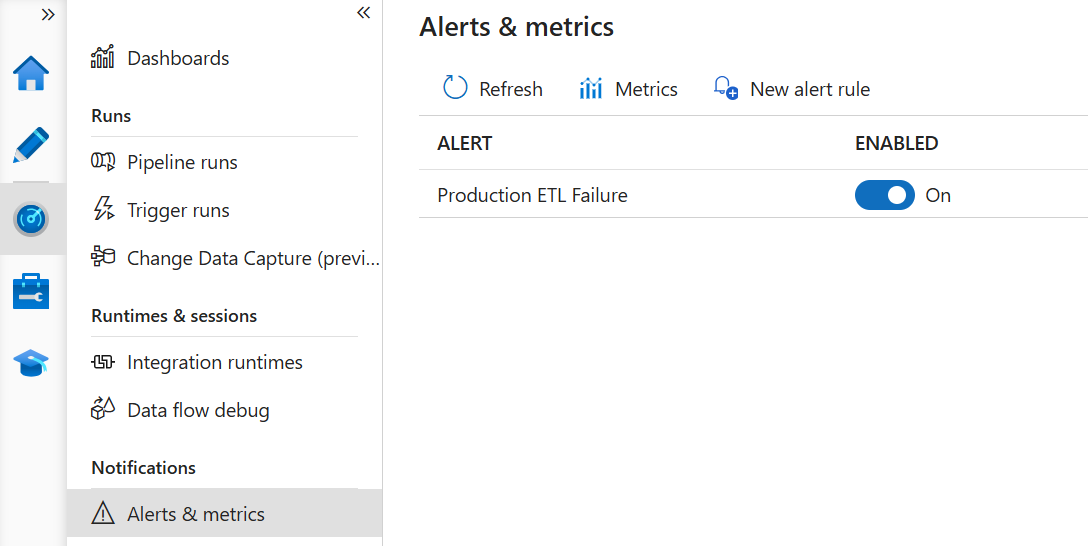
Alerting is an important monitoring task for any ETL process. Azure Data Factory can integrate with a generic Azure event framework (Azure Monitor) which makes it somewhat unintuitive for ETL monitoring. You can set up and change the alerts using the ADF Monitoring hub. You might find the following tips useful for setting up an ADF alert: Dimension – I like to nest pipelines where a master pipeline starts dimension and fact master pipelines, which in turn execute unit pipelines, such as a loading a dimension table. This allows me to restart ETL at any level. In the Dimension dropdown (nothing to do with DW dimensions), I select all such master pipelines because if an error is triggered downstream, it will bubble up to the master. Failure Type – I select all failure types. Condition – I configure the alert to be generated as soon as one failure occurs. Period...
-
Atlanta Microsoft BI Group Meeting on April 1st (Real-Time Analytics with Microsoft Fabric: Unlocking the Power of Streaming Data)
March 26, 2024 / No Comments »

Atlanta BI fans, please join us in person for the next meeting on Monday, April 1st at 6:30 PM ET. Aravinth Krishnasamy (Principal Architect at Ecolab) will provide an end-to-end overview of Microsoft Fabric real-time analytics capabilities. Your humble correspondent will help you catch up on Microsoft BI latest. CloudStaff.ai will sponsor the event. For more details and sign up, visit our group page. Presentation: Real-Time Analytics with Microsoft Fabric: Unlocking the Power of Streaming Data Delivery: In-person Date: April 1, 2024 Time: 18:30 – 20:30 ET Level: Beginner/Intermediate Food: Pizza and drinks Agenda: 18:15-18:30 Registration and networking 18:30-19:00 Organizer and sponsor time (events, Microsoft BI latest, sponsor marketing) 19:00-20:15 Main presentation 20:15-20:30 Q&A Overview: This session will provide an end-to-end overview of Microsoft Fabric Real-Time Analytics capabilities. We will go over the following topics: 1. Introduction to Real-Time Analytics: Overview of the platform and its capabilities 2. Data...
-
What Can Fabric Do For My Lake?
March 13, 2024 / No Comments »
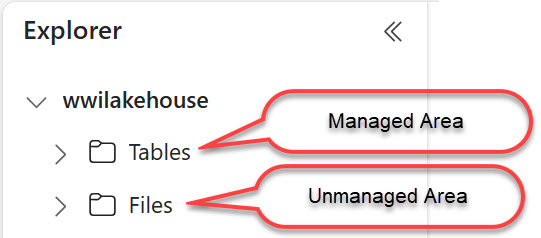
Previously, I discussed the pros and cons of Microsoft Fabric OneLake and Lakehouse. But what if you have a data lake already? Will Fabric add any value, especially if your organization is on Power BI Premium and you get Fabric features for free (that is, assuming you are not overloading your capacity resources)? Well, it depends. Managed Area A Fabric lakehouse defines two areas: managed and unmanaged. The managed area (Tables folder) is exclusively for Delta/Parquet tables. If you have your own data lake with Delta/Parquet files, such as Databricks delta lake, you can create shortcuts to these files or folders located in ADLS Gen 2 or Amazon S3. Consequently, the Fabric lakehouse would automatically register these shortcuts as tables. Life is good in the managed area. Shortcuts to Delta/Parquet tables open interesting possibilities for data virtualization, such as: Your users can use the Lakehouse SQL Analytics endpoint to join...
-
Make a Pledge and Trouble is at Hand: Microsoft AI and Fabric Copilots
March 11, 2024 / No Comments »

Rounding up the wisdom from the inscriptions of the Apollo Temple (see the Nothing in Excess and Know Thyself posts), the last known famous inscription was "Make a pledge and trouble is at hand." Although the original intention was lost in time, it's believed that this inscription instructs us to understand our limits so we don't overpromise. Fast forward to modern data analytics, I remember how Microsoft Power BI started less than 10 years ago with the grand promise to democratize BI to the masses. One would believe that AI would be an essential ingredient to fulfill that promise. To its credit, Power BI includes various built-in and useful ML features, such as Analyze Increase/Decrease (my favorite), Decomposition Tree, Key Influencers, Get Insights, and Q&A. It's surprising to me though that Fabric copilots are an ultra premium feature as they require at least P1 or its Fabric equivalent of F64...
-
A First Look at DAX Visual Calculations: the Good, the Bad, and the Ugly
February 28, 2024 / No Comments »
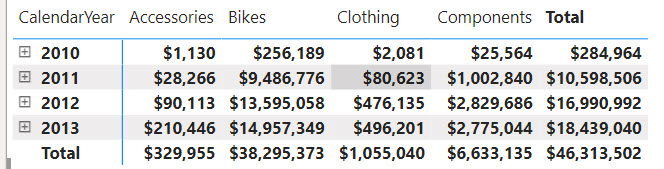
The February 2024 release of Power BI Desktop includes a preview of visual calculations. As its name suggests, a visual calculation is a visual-scoped DAX measure that works at the aggregate (visual) level. The Good Visual calculations make previously difficult tasks much easier. Consider the following matrix: Suppose you need a measure that calculates the difference between the product categories in the order they were sorted in the visual. Implementing this as a regular DAX measure is a challenge. Yet, if we had a way to work with the cells in the visual, we can easily find a way to get this to work. Ideally, this would work similar in Excel, but DAX doesn’t know about relative references. However, visual calculations do (kind of). Let’s right-click on the visual and select “New calculation”. In the visual-level DAX formula bar, enter the following formula: Category Diff = [Sum of SalesAmount] -...
-
Atlanta Microsoft BI Group Meeting on March 4th (Navigating Microsoft Fabric – Choosing the Right Workload for Your Needs)
February 27, 2024 / No Comments »
Atlanta BI fans, please join us in person for the next meeting on Monday, March 4th at 6:30 PM ET. The famous Patrick LeBlanc (Guy in the Cube) will take a deep dive into the Microsoft Fabric ecosystem, from Lakehouse to Warehouses and Power BI, ensuring you can make informed decisions about your data processing needs. Your humble correspondent will help you catch up on Microsoft BI latest. CloudStaff.ai will sponsor the event. For more details and sign up, visit our group page. Presentation: Navigating Microsoft Fabric - Choosing the Right Workload for Your Needs Delivery: In-person Date: March 4 Time: 18:30 – 20:30 ET Level: Beginner/Intermediate Food: Pizza and drinks Agenda: 18:15-18:30 Registration and networking 18:30-19:00 Organizer and sponsor time (events, Microsoft BI latest, sponsor marketing) 19:00-20:15 Main presentation 20:15-20:30 Q&A Overview: As businesses transition to the cloud and leverage advanced analytics, understanding the nuances of data infrastructure...
-
Nothing in Excess: Deciphering Data Architectures by James Serra
February 9, 2024 / No Comments »
In my last post, I talked about the lessons learned from the ancient Greeks. The second inscription on the temple of Apollo in Delphi was "Nothing in Excess." Yet, inspired to be modern and embracing vendor's propaganda, it's my experience that companies tend to overdo their data architectures. I talked about this in this newsletter. Another excellent resource that could help you strike a balance is the James Serra's latest book "Deciphering Data Architectures." I was privileged to know James Serra for a while, have him multiple times present to our Atlanta BI Group, and be an early reviewer of this book. Besides consolidating the wealth of information from his excellent blog, James took a vendor-neutral approach to various patterns. Each pattern describes the architecture followed by pros and cons analysis. After all, the right architecture and "best practice" is what works for you given your specific circumstances and restrictions....
-
Know Thyself: Power BI Source Control
February 8, 2024 / No Comments »

Last year my wife and I did a tour of Greece, and we had a blast. Greece, of course, is the place to go if you are interested in ancient history and the origin of democracy. One of the places we visited was Delphi. The ancient Greeks believed it to be the center of the universe. Now not much was left of it except lots of ruins and imagination. But back then it was magnificent. People from all over the world would come to consult with the Oracle of Delphi. She delivered her prophecies from the temple of Apollo, which had three inscriptions, with one of them being "Know thyself". The practical benefit for the oracle was that if you believed her cryptic prophecy wasn't fulfilled then your interpretation was wrong. Therefore, the problem was in you because you didn't know yourself. How does this translate into BI? I see...
-
Atlanta Microsoft BI Group Meeting on February 5th (Power BI – Time to Git CI/CD)
January 29, 2024 / No Comments »
Atlanta BI fans, please join us for the next meeting on Monday, February 5th at 6:30 PM ET. Note that this will be an online meeting via MS Teams and non-Atlanta BI fans are also welcome. Kristyna Hughes (Senior Consultant with 3Cloud) will show us how to implement source control for Power BI reports. Your humble correspondent will help you catch up on Microsoft BI latest. For more details and sign up, visit our group page. Presentation: Power BI - Time to Git CI/CD Delivery: Online Date: February 5 Time: 18:30 – 20:30 ET Level: Intermediate Food: NA Agenda: 18:15-18:30 Registration and networking 18:30-19:00 Organizer and sponsor time (events, Microsoft BI latest, sponsor marketing) 19:00-20:15 Main presentation 20:15-20:30 Q&A Overview: As report developers, requirements for reports are constantly evolving which leads the reports themselves to change. However, inevitably, there will be one party who uses that report and was...
-
SSRS Going on 20
January 24, 2024 / No Comments »

Last year around this time, I went to Antarctica on an expedition ship. Although I got my fair share of icebergs, whales, and penguins, I found it interesting to reproduce some of the experience of the first explorers. On our way back, we got it pretty rough crossing the Drake passage. 80% of the passengers succumbed to sea sickness. There was a huge swell during the night. The next day the captain told us that we faced some 10-meter waves. It felt like a bad roller coaster ride. Yet, the explorers did it. On wooden ships with no stabilizers and communication. Not knowing where they were going and with a high probability that they won’t survive! What does this have to do BI? The remote connection is that 20 years ago a small group from Microsoft was set up to create a new reporting tool that was code-named “Rosetta” and...
Training
 We offer onsite and online Business Intelligence classes! Contact us about in-person training for groups of five or more students.
For more information or to register click here!
Books
 Learn Power BI at your own pace with our latest book Applied Microsoft Power BI. Targeting information workers, data analysts, pros, and developers, It is designed as an easy-to-follow guide for learning how to implement BI solutions spanning the entire personal-team-organizational BI spectrum.


