-
Atlanta MS BI and Power BI Group Meeting on January 3rd
December 27, 2021 / No Comments »

Please join us online for the next Atlanta MS BI and Power BI Group meeting on Monday, January 3rd, at 6:30 PM ET. Paul Turley will show us how to integrate Power BI with paginated (SSRS) reports. And your humble correspondent will update you on the Power BI latest. For more details and sign up, visit our group page. Presentation: Power BI Paginated Reports: The New Old Operational Reporting Platform Date: January 3rd Time: 6:30 – 8:30 PM ET Place: Click here to join the meeting Overview: Power BI Paginated Reports (aka SQL Server Reporting Services) was old but now it's new again. Available on-premises or in the Power BI service with flexible licensing, you have multiple options to implement operational reports. This session will briefly cover the differences between analytic and operational reports; and help you understand the advantages and trade-offs using Power BI Paginated Reports, Power BI Report...
-
Power BI Hybrid Tables
December 17, 2021 / No Comments »
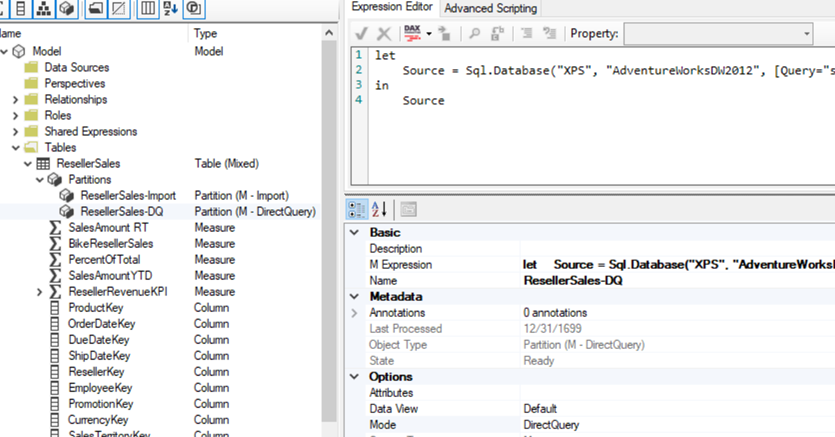
A while back a client wanted to avoid importing a large snapshot fact table with loan balances because its memory footprint would require them to upgrade to a higher Power BI premium plan. This of course required leaving the table in DirectQuery mode at the expense of query performance. Luckily, most users would be interested in the latest six months of data. To speed up performance, we opted for aggregations. However, to complicate things further, they had M2M relationships between dimensions and the fact table which Power BI aggregations don't support. So, we had to roll out our own "aggregation hits" by redirecting DAX measures either to the aggregated table if the as-of date was in the last six months or to the DirectQuery table otherwise. Seasoned BI pros might recall that Multidimensional supports measure groups with a mixed storage by creating MOLAP and ROLAP partitions within the same table....
-
Atlanta MS BI and Power BI Group Meeting on December 6th
November 29, 2021 / No Comments »
Please join us online for the next Atlanta MS BI and Power BI Group meeting on Monday, December 6th, at 6:30 PM ET. To finish the year at a high note, the famous Guys in the Cube (Patrick and Adam) will tell us how keep the data fresh in Power BI. And your humble correspondent will update you on the Power BI latest. For more details and sign up, visit our group page. Presentation: Keeping your Data Fresh in Power BI Date: December 6th Time: 6:30 – 8:30 PM ET Place: Click here to join the meeting Overview: We all want our data refresh to happen quickly so the most current data is available for our reports. In this session we will walk you through options to configure refreshing your data but more importantly we will help with performance. We’ll look at how to identify bottlenecks and then how to...
-
Power BI Bookmark Navigator – A Better Hack
November 17, 2021 / No Comments »
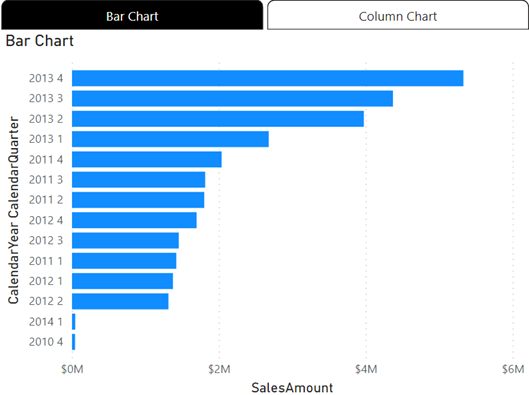
As a report author, you are constantly pressed to fit more visuals into a single page. The November release of Power BI Desktop introduced the Power BI Bookmark Navigator, which simplifies the process of creating a tabbed interface, such as this one. Since Power BI doesn't support visual containers or a "menu" visual, you must resort to the awful hack of hiding and showing UX elements by bookmarking them. This reminds me of the beginning of my career as a developer where we didn't have widgets and we had to hack our way through implementing a custom navigation "experience" by toggling visibility. Alas, this continues in the 21st century but at least the hack got simplified. To implement the tabbed interface: Add two (or more) overlapping visuals. Add two bookmarks (Bar Chart and Column Chart) that show and hide the appropriate visual. Don't worry about hidden visuals impacting the report...
-
“Serverless” Lessons Learned
November 5, 2021 / No Comments »
I've architected and currently implementing a solution that uses Synapse (my last newsletter has the details, plus the architecture diagram). Synapse Serverless is the Microsoft answer to Amazon Athena but instead of using open-source tools like Presto, it's built on SQL Server. In this project we extract many tables from 1,500 on-prem SQL Server databases and stage them in ADLS. From there we use Synapse Serverless to virtualize these files as tables that we query with T-SQL to load the source "table" data into a data warehouse hosted in Synapse SQL Pool. I have to tell you that I'm becoming a "serverless" fan. Here are a few lessons learned from this project: Save the files in parquet format in ADLS. Parquet can be compressed. It's columnar based, it's much faster to query. Serverless automatically creates statistics for parquet files on the first query and each time it detects changes. Less...
-
Atlanta MS BI and Power BI Group Meeting on November 1st
October 30, 2021 / No Comments »
Please join us online for the next Atlanta MS BI and Power BI Group meeting today (Monday, October 4th), at 6:30 PM ET. Sandeep Pawar will explain how to use the Power BI AI visuals for predictive insights. And your humble correspondent will show you how to use the Power BI REST APIs. For more details and sign up, visit our group page. Presentation: Demystifying Power BI AI Visuals Date: November 1st Time: 6:30 – 8:30 PM ET Place: Click here to join the meeting Overview: Power BI has several powerful AI visuals that allow business analysts to create insightful reports that include predictive capabilities without writing any code. In this session, we will take a deeper look at these visuals, discuss how exactly they work, when & how you should use them effectively and importantly when not to use them. We will look at the algorithms driving them and...
-
PolyBase Adventures
October 12, 2021 / No Comments »
I'm setting SQL Server 2019 PolyBase for ODBC to JDBC access to a vendor data lake to virtualize entities as SQL tables. Overall, a smooth experience with a few gotchas: Data type mappings The vendor lake uses Oracle data types TIMESTAMP AT TIME ZONE and BOOLEAN that Java doesn't know how to map. The solution was to set up a view in the data lake (luckily the vendor supports that) to cast these data types to NVARCHAR and INTEGER. NullPointerException Once the table is finally set up what do we get when querying it? 105082;Generic ODBC error: java.lang.NullPointerException . How do we fix this horrible issue? Upgrade SQL Server and PolyBase to the latest cummulative update (CU). The final mystery that I haven't been able to crack yet is that for some obscure reason, PolyBase adds quite a bit of performance overhead to the query execution. So, if a query...
-
Atlanta MS BI and Power BI Group Meeting on October 4th
October 4, 2021 / No Comments »
Please join us online for the next Atlanta MS BI and Power BI Group meeting today (Monday, October 4th), at 6:30 PM ET. Reda Raz (RADACAD) will share best practices on semantic modelling with Power BI. And your humble correspondent will show two new features: Get Insights and Power BI Goals. For more details and sign up, visit our group page. Presentation: Power BI Modeling 101 Date: October 4th Time: 6:30 – 8:30 PM ET Place: Click here to join the meeting Overview: Getting started with a report in Power BI is easy. However, soon you will face challenges of having multiple tables, the relationship between tables, the direction of relationship, active or inactive relationship and so on. You also soon realize that you need a proper data model called star-schema which is combination of fact and dimension tables. But, wait a second, you never learned all these fundamentals. What...
-
Drillthrough Paginated Reports
September 25, 2021 / No Comments »
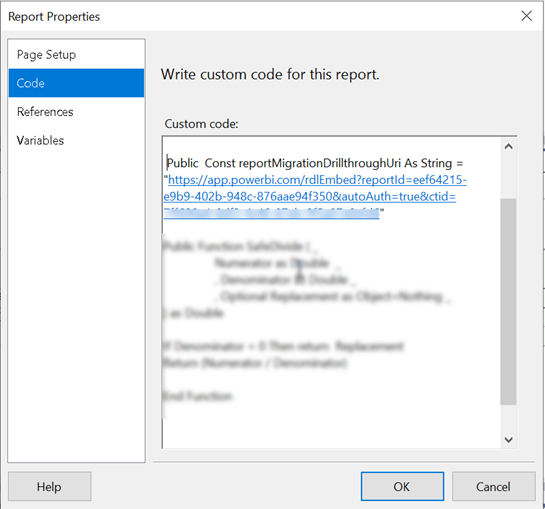
I'm helping a client convert a few SSRS reports from SharePoint to Power BI Premium Per User (PPU). SSRS is of course near and dear to my heart because of all the work I've done around it circa 2004-2010 (yep, it's been that long), books, MVP awards, etc. Since its humble beginnings, SSRS have had a solid architecture that excelled in extensibility. You'd be hardly pressed to face a requirement that couldn't meet with SSRS back then. Unfortunately, most of these extensibility features, such as custom assemblies, custom security, custom delivery extensions, custom renderers (essentially everything related to custom code) didn't make it to paginated reports in Power BI Premium. Not many companies are using these features, so they probably won't be a showstopper for your migration. To their credit, Microsoft is closing the gap between SSRS and paginated reports. As of now, the feature limits that you might run...
-
Chasing SSAS Connection Timeouts
August 23, 2021 / No Comments »

Suppose you have a Tabular model and you send a massive DAX query to it that could run for hours, such as to calculate many measures (in our case hundreds) for each customer overnight so that you can cache the results and delight the user with super-fast lookups. This issue could also apply to Multidimensional although in this case Tabular was used. The server times out sporadically the query after a random execution time. You have changed all possible connection timeout options (SSAS ServerTimeout, SSIS connection timeout, etc.) to no avail. In fact, if you have scheduled an Agent job that calls an SSIS package that executes the query, the package doesn't register the exception and continues executing indefinitely, but a Profiler trace (or XEvents session) shows that the server raises a Connection Timeout error. How to fix this horrible issue? Change the two undocumented settings in the MSMDSRV.INI file...
Training
 We offer onsite and online Business Intelligence classes! Contact us about in-person training for groups of five or more students.
For more information or to register click here!
Books
 Learn Power BI at your own pace with our latest book Applied Microsoft Power BI. Targeting information workers, data analysts, pros, and developers, It is designed as an easy-to-follow guide for learning how to implement BI solutions spanning the entire personal-team-organizational BI spectrum.

