-
Stop Using the Power BI Folder Connector
October 10, 2020 / No Comments »
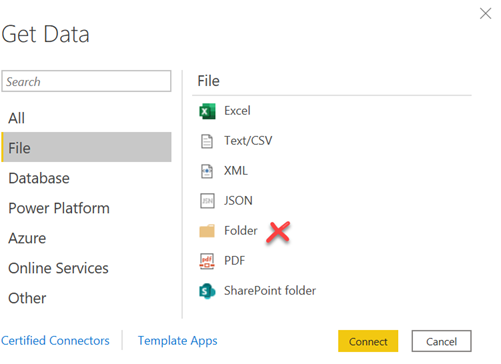
I know that it's tempting to use the Folder connector to combine multiple files with the same schema and load them in Power BI Desktop with a few clicks – an idea promoted by Microsoft's own Power BI Dashboard in a Day (DIAD) training. But what happens if you want to automate the dataset refresh after uploading your model to Power BI Service? Suddenly, things don't work so well anymore. The only option is to install a personal gateway on your laptop with all the issues surrounding it. Instead, I recommend you upload files to Azure Data Lake Storage and use the Power BI Azure Data Lake Storage Gen2 connector. Setting this up will require some assistance from your friendly IT department to set up ADLS and grant you access, but they shouldn't complain if they are serious about data governance. Like the Folder connector, you can combine multiple files...
-
Power Query Merging on GUID Columns
October 10, 2020 / No Comments »
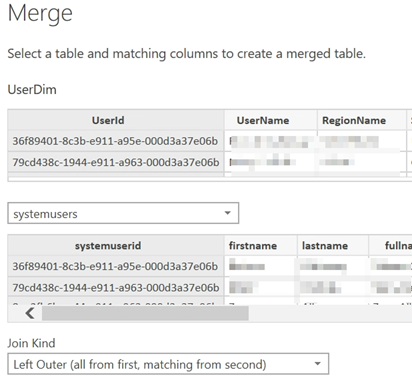
Scenario: You are merging two tables in Power Query on GUID columns with Text data type. In my case, the first table (UserDim) came from Azure SQL DB and the second (systemusers) from Dynamics CRM, but I believe the source is irrelevant. Then, you expand the second table in the next step after the merge, select the columns you need, and see expected results in the preview pane. However, when you apply the changes, the related columns are not populated (empty) in the Power BI data model. In other words, the join fails to find matches. Solution: I think there is some sort of a bug in Power Query. True, Power Query is case-sensitive so joining on the same text that differs in casing in the two columns would fail the match. However, in this case the guids were all lower case (or at least that's how they appear in...
-
Solving Configuration Errors with ADF Self-hosted IR
October 2, 2020 / No Comments »
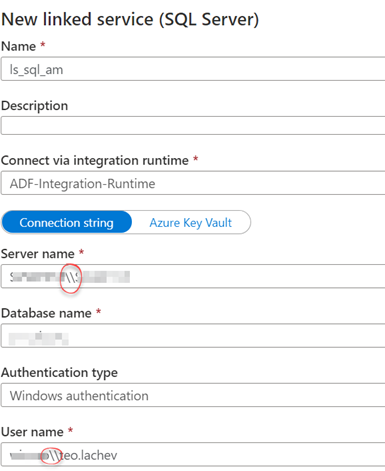
You've set up the Azure Data Factory self-hosted integration runtime to access on-prem data sources. You create a linked server, click Test Connection, and then get greeted with an error saying the security context can't be passed. On the on-prem VM, you use the Integration Runtime Configuration Manager and get a similar error or something to the extent that JSON can't be parsed. You spent a few hours in trying everything that comes to mind, such as checking firewalls, connectivity from SSMS, but nothing helps. How do we fix this horrible problem? We double the backslashes in the server name (if you use a named instance) and in the user name (after the domain) on the linked server properties. Apparently, Spark/Databricks has an issue with backslashes.
-
Atlanta MS BI and Power BI Group Meeting on October 5th
September 29, 2020 / No Comments »

Please join us online for the next Atlanta MS BI and Power BI Group meeting on Monday, October 5th, at 6:30 PM. Paco Gonzalez (CEO of SolidQ) will present and demonstrate the Power BI AI and ML capabilities. For more details, visit our group page and don't forget to RSVP (fill in the RSVP survey if you're planning to attend). Presentation: AI, ML and Power BI Date: October 5th, 2020 Time 6:30 – 8:30 PM ET Place: Join Microsoft Teams Meeting Learn more about Teams | Meeting options Overview: Perhaps some of the most powerful features of Power BI involve the Artificial Intelligence and Machine Learning functionality built into the platform. In this session, we will review the AI and ML capabilities built into Power BI Desktop and the Power BI Service. From Data Visualizations to Data Preparation and Data Modeling, we will discuss the various ways that AI and ML can...
-
Organizational Semantic Model
September 6, 2020 / No Comments »

I am delivering a data governance assessment for an enterprise client. As a part of the effort to migrate reporting from MicroStrategy to Power BI, the client wants to improve data analytics. The gap analysis interviews with the business leaders revealed common pitfalls: no single version of truth, data is hard to come by, business users don't know what data sources exist, business users spend more time in data wrangling than analytics, data quality is bad, IT is overwhelmed with report requests, report proliferation and duplication, and so on... Sounds familiar? As I mentioned many times in my blog, an enterprise data warehouse (EDW) plays a critical role in overcoming the above challenges, but it's not enough. A semantic model is needed and I extolled its virtues in my "Why Semantic Layer?" newsletter. In the Microsoft BI world, Analysis Services Tabular is commonly used to implement such models that are...
-
Section Hiked A.T. in Georgia
September 5, 2020 / No Comments »

My wife and I started section hiking the Appalachian Trail during weekends to escape the summer heat and the virus. A.T. runs for 2,200 miles from Georgia to Maine, with 78.6 miles in Georgia. Today we finished the Georgia part and entered North Carolina. We actually covered twice the distance (averaging 10-12 miles per section) because we had to come back each time to where we parked. We started hiking with the great Atlanta Outdoor Club back in February, 2020. But when the virus hit, group hikes were put on hold, so we were left to our own devices. Hiking somehow grew on me. Perhaps, because it as a metaphor for life. There are ups and downs. Some sections are hard and require a great deal of effort and perspiration, while others are easy. There are exhilarating views but there are also areas with overgrown vegetation. Perceived risks, such as...
-
Azure Synapse: The Good, The Bad, and The Ugly
August 23, 2020 / No Comments »
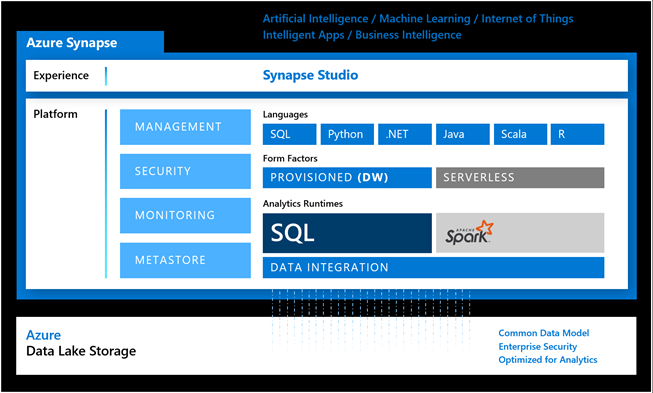
Cloud deployments are the norm nowadays for new software projects, including BI. And Azure Synapse shows a great potential for modern cloud-based data analytics. Here are some high-level pros and cons to keep in mind for implementing Azure Synapse-centered solutions that I harvested from my real-life projects and workshops. The Good There is plenty to like in Azure Synapse which is the evaluation of Azure SQL DW. If you're tasked to implement a cloud-based data warehouse, you have a choice among three Azure SQL Server-based PaaS offerings, including Azure SQL Database, Azure SQL Managed Instance, and Azure Synapse. In a nutshell, Azure SQL Database and Azure SQL MI are optimized for OLTP workloads. For example, they have full logging enabled and replicate each transaction across replicas. Full logging is usually a no-no for decent size DW workloads because of the massive ETL changes involved. In addition, to achieve good performance,...
-
Uploading Files to ADLS Gen2 with Python and Service Principal Authentication
August 13, 2020 / No Comments »

I had an integration challenge recently. I set up Azure Data Lake Storage for a client and one of their customers want to use Python to automate the file upload from MacOS (yep, it must be Mac). They found the command line azcopy not to be automatable enough. So, I whipped the following Python code out. I configured service principal authentication to restrict access to a specific blob container instead of using Shared Access Policies which require PowerShell configuration with Gen 2. The comments below should be sufficient to understand the code. ###install dependencies # install Azure CLI https://docs.microsoft.com/en-us/cli/azure/install-azure-cli?view=azure-cli-latest #pip install azure-identity #pip install azure-storage-blob # upgrade or install pywin32 to build 282 to avoid error "DLL load failed: %1 is not a valid Win32 application" while importing azure.identity # pip install pywin32 –upgrade # IMPORTANT! set the four environment (bash) variables as per https://docs.microsoft.com/en-us/azure/developer/python/configure-local-development-environment?tabs=cmd # Note that AZURE_SUBSCRIPTION_ID is enclosed with double quotes while...
-
Presenting Analytics in a Day Workshop on August 20th
August 11, 2020 / No Comments »
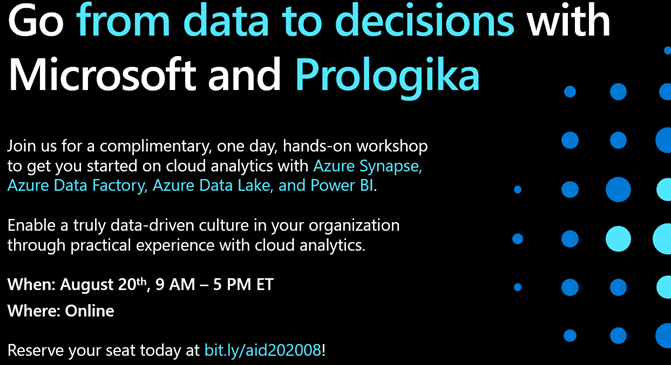
In partnership with Microsoft, I'm delivering a complimentary, one-day, Analytics in a Day virtual workshop on August 20th, 9 AM – 5 PM Eastern Time. Targeting BI developers, architects and technology decision makers interested in achieving a single version of truth with organizational BI, this workshop is designed to guide and accelerate your journey towards a modern data warehouse to power your business with Azure Synapse, Azure Data Factory, Azure Data Lake, and Power BI. The first half of the day from 9 am – 1 pm will help you better understand how to: Create an analytics solution that goes from data ingestion to insights using Azure Synapse Analytics and Power BI Empower self-service analytics Enable a truly data-driven culture in your business Part of the workshop will be dedicated to hands-on training to help you get started on your cloud analytics journey. The second half of the day from...
-
Discipline at the Core, Flexibility at the Edge
August 6, 2020 / No Comments »
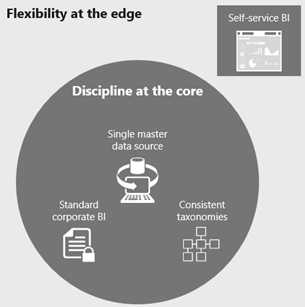
I'm preparing to teach the brand new Analytics in a Day course by Microsoft. This course emphasizes the business value and technical fundamentals for implementing a modern cloud DW using Azure Synapse, ADF, Data Lake, and Power BI. The second half of the class is focused on Power BI and its role for creating organizational semantic models and self-service models from Synapse. I liked the best practices that Microsoft shares based on how they've adopted BI over years and challenges they faced with self-service BI, including: Inconsistent data definitions, hierarchies, metrics, KPIs Analysts spending 75% of their time collection and compiling data 78% of reports being creating in "offline environments" Over 350 centralized finance tools and systems Approximately $30M annual spend on "shadow applications" Indeed, many vendors tout only self-service BI which can quickly lead to chaos. By contrast, I have found that most successful data-driven organizations have both organizational...
Training
 We offer onsite and online Business Intelligence classes! Contact us about in-person training for groups of five or more students.
For more information or to register click here!
Books
 Learn Power BI at your own pace with our latest book Applied Microsoft Power BI. Targeting information workers, data analysts, pros, and developers, It is designed as an easy-to-follow guide for learning how to implement BI solutions spanning the entire personal-team-organizational BI spectrum.

