-
Atlanta Microsoft BI Group Meeting on September 3rd (Create Code Copilots with Large Language Models)
August 12, 2024 / No Comments »

Atlanta BI fans, please join us in person for the next meeting on Monday, September 3th at 6:30 PM ET. Your humble correspondent will show you how to use Large Language Models, such as ChatGPT, to create your own copilots for Text2SQL and Text2DAX. I'll also help you catch up on Microsoft BI latest. I will sponsor the event which marks the 14th anniversary of the Atlanta Microsoft BI Group! For more details and sign up, visit our group page. Details Presentation: Create Code Copilots with Large Language Models Delivery: In-person Date: September 3rd, 2024 Time: 18:30 – 20:30 ET Level: Beginner to Intermediate Food: Pizza and drinks will be provided Agenda: 18:15-18:30 Registration and networking 18:30-19:00 Organizer and sponsor time (events, Power BI latest, sponsor marketing) 19:00-20:15 Main presentation 20:15-20:30 Q&A Venue Improving Office 11675 Rainwater Dr Suite #100 Alpharetta, GA 30009 Overview: Resistance is futile! Instead of fearing that AI...
-
Power BI and Fabric Capacities: Thinking Outside the Box
August 3, 2024 / No Comments »

I’m conducting an assessment for a client facing memory pressure in Power BI Premium. You know these pesky out of memory issues when refreshing a biggish dataset. They started with P1, moved to P2, and now are on P3 but still more memory is needed. The runtime memory footprint of the problematic semantic model with imported data is 45 GB and they’ve done their best to optimize it. Since its beginning, Power BI Pro per-user licensing (and later Premium Per User (PPU) licensing) has been very attractive. Many organizations with a limited number of report users flocked to Power BI to save cost. However, organizations with more BI consumers gravitated toward premium licensing where they could have unlimited number of report readers against a fixed monthly fee starting at listed price of $5,000/mo for P1. Sounds like a great deal, right? I must admit that I detest the premium licensing...
-
Atlanta Microsoft BI Group Meeting on August 5th (Elevate Program Management with Power BI & DevOps)
July 30, 2024 / No Comments »

Atlanta BI fans, please join us in person for the next meeting on Monday, August 5th at 6:30 PM ET. Elayne Jones and Matt Kim (Solutions Architects at Coca-Cola) will show us how to bring Azure DevOps data to life by creating data models and interactive reports in Power BI. Your humble correspondent will help you catch up on Microsoft BI latest. CloudStaff.ai will sponsor the event. For more details and sign up, visit our group page. Details Presentation: Elevate Program Management with Power BI & DevOps Delivery: In-person Date: August 5, 2024 Time: 18:30 – 20:30 ET Level: Intermediate Food: Pizza and drinks will be provided Agenda: 18:15-18:30 Registration and networking 18:30-19:00 Organizer and sponsor time (events, Power BI latest, sponsor marketing) 19:00-20:15 Main presentation 20:15-20:30 Q&A Venue Improving Office 11675 Rainwater Dr Suite #100 Alpharetta, GA 30009 Overview: Have you ever opened Azure DevOps and felt overwhelmed by the vast sea of program...
-
LLM Adventures: RAG Apps
July 19, 2024 / No Comments »
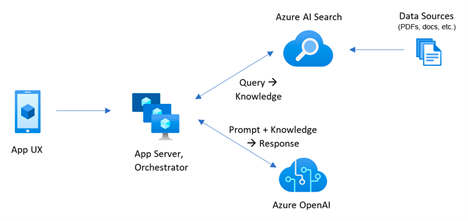
This post summarizes my research around the increasingly popular RAG apps, and it’s meant more as an internal memo to myself to summarize existing findings should one day a suitable project comes along. However, someone starting with RAG development might find this useful (we are all LLM rookies). RAG is a fascinating topic and presents another great case for generative AI in data analytics. RAG (retrieval-augmented generation) apps apply AI to let end users intelligently search data, such as PDF or Word documents, using natural questions. The most common scenario is for searching internal data because public LLM models don’t have access to your corporate data repositories and therefore know nothing about your data. Suppose your HR department has accumulated a large knowledge base of files detailing internal policies, such as health plans. Using a home-grown RAG app, the user can type natural questions, such as “Which plan supports vision?”...
-
LLM Adventures: Text2DAX
July 11, 2024 / No Comments »
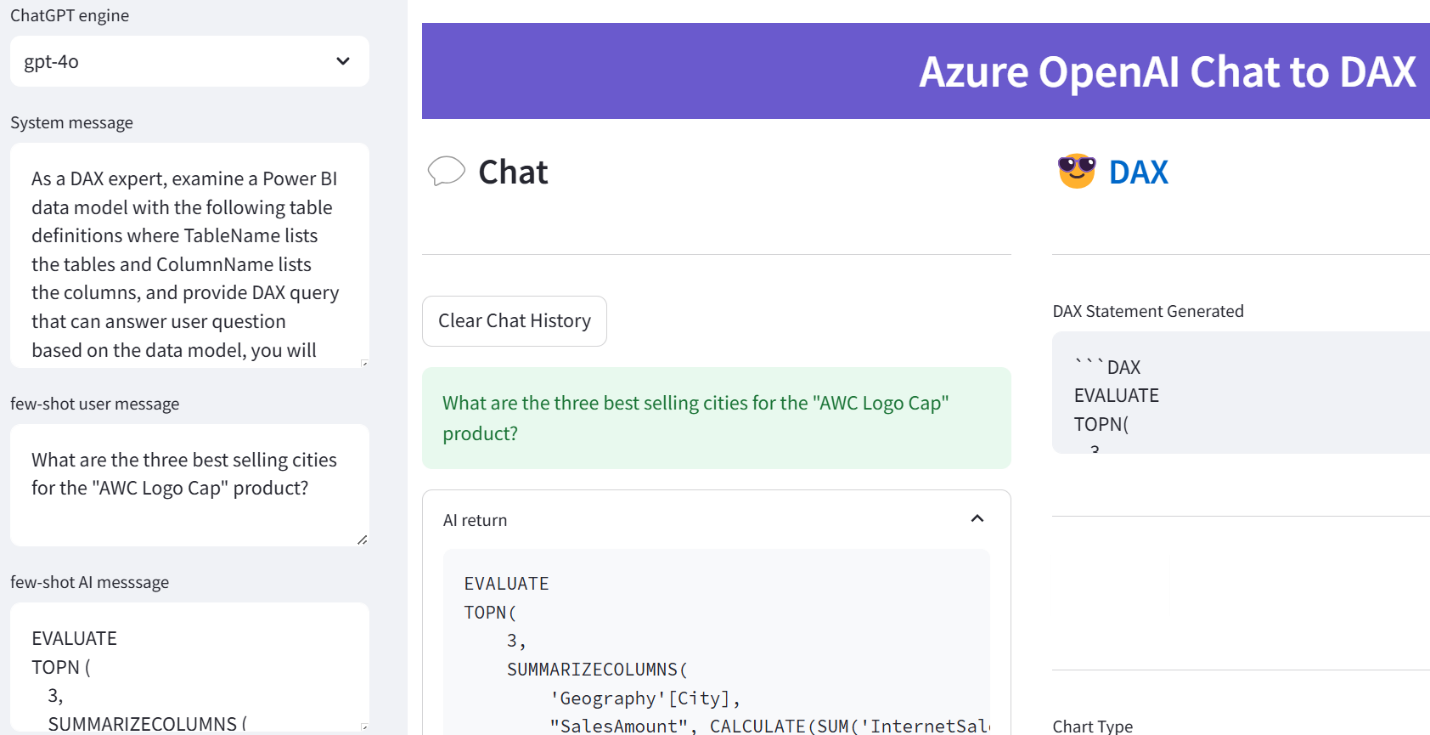
In my previous post, I covered how large language models, such as ChatGPT, can be used to convert natural queries to SQL. Let’s now see how Text2DAX fairs. But wait, we have a Microsoft Fabric copilot already for this, right? Yes, but what happens when you click the magic button in PBI Desktop? You are greeted that you need to purchase F64 or larger capacity. It’s a shame that Microsoft has decided that AI should be a super premium feature. Given this horrible predicament, what would a mortal developer strapped for cash do? Create their own copilot of course! Building upon the previous sample, this is remarkably simple. As I mentioned in the first blog, one great LLM feature is the loose input. To make the schema generation simple, I obtained the table and column names from the Adventure Works semantic model (a *.pbix file opened in PBI Desktop) by...
-
LLM Adventures: Text2SQL
July 7, 2024 / No Comments »
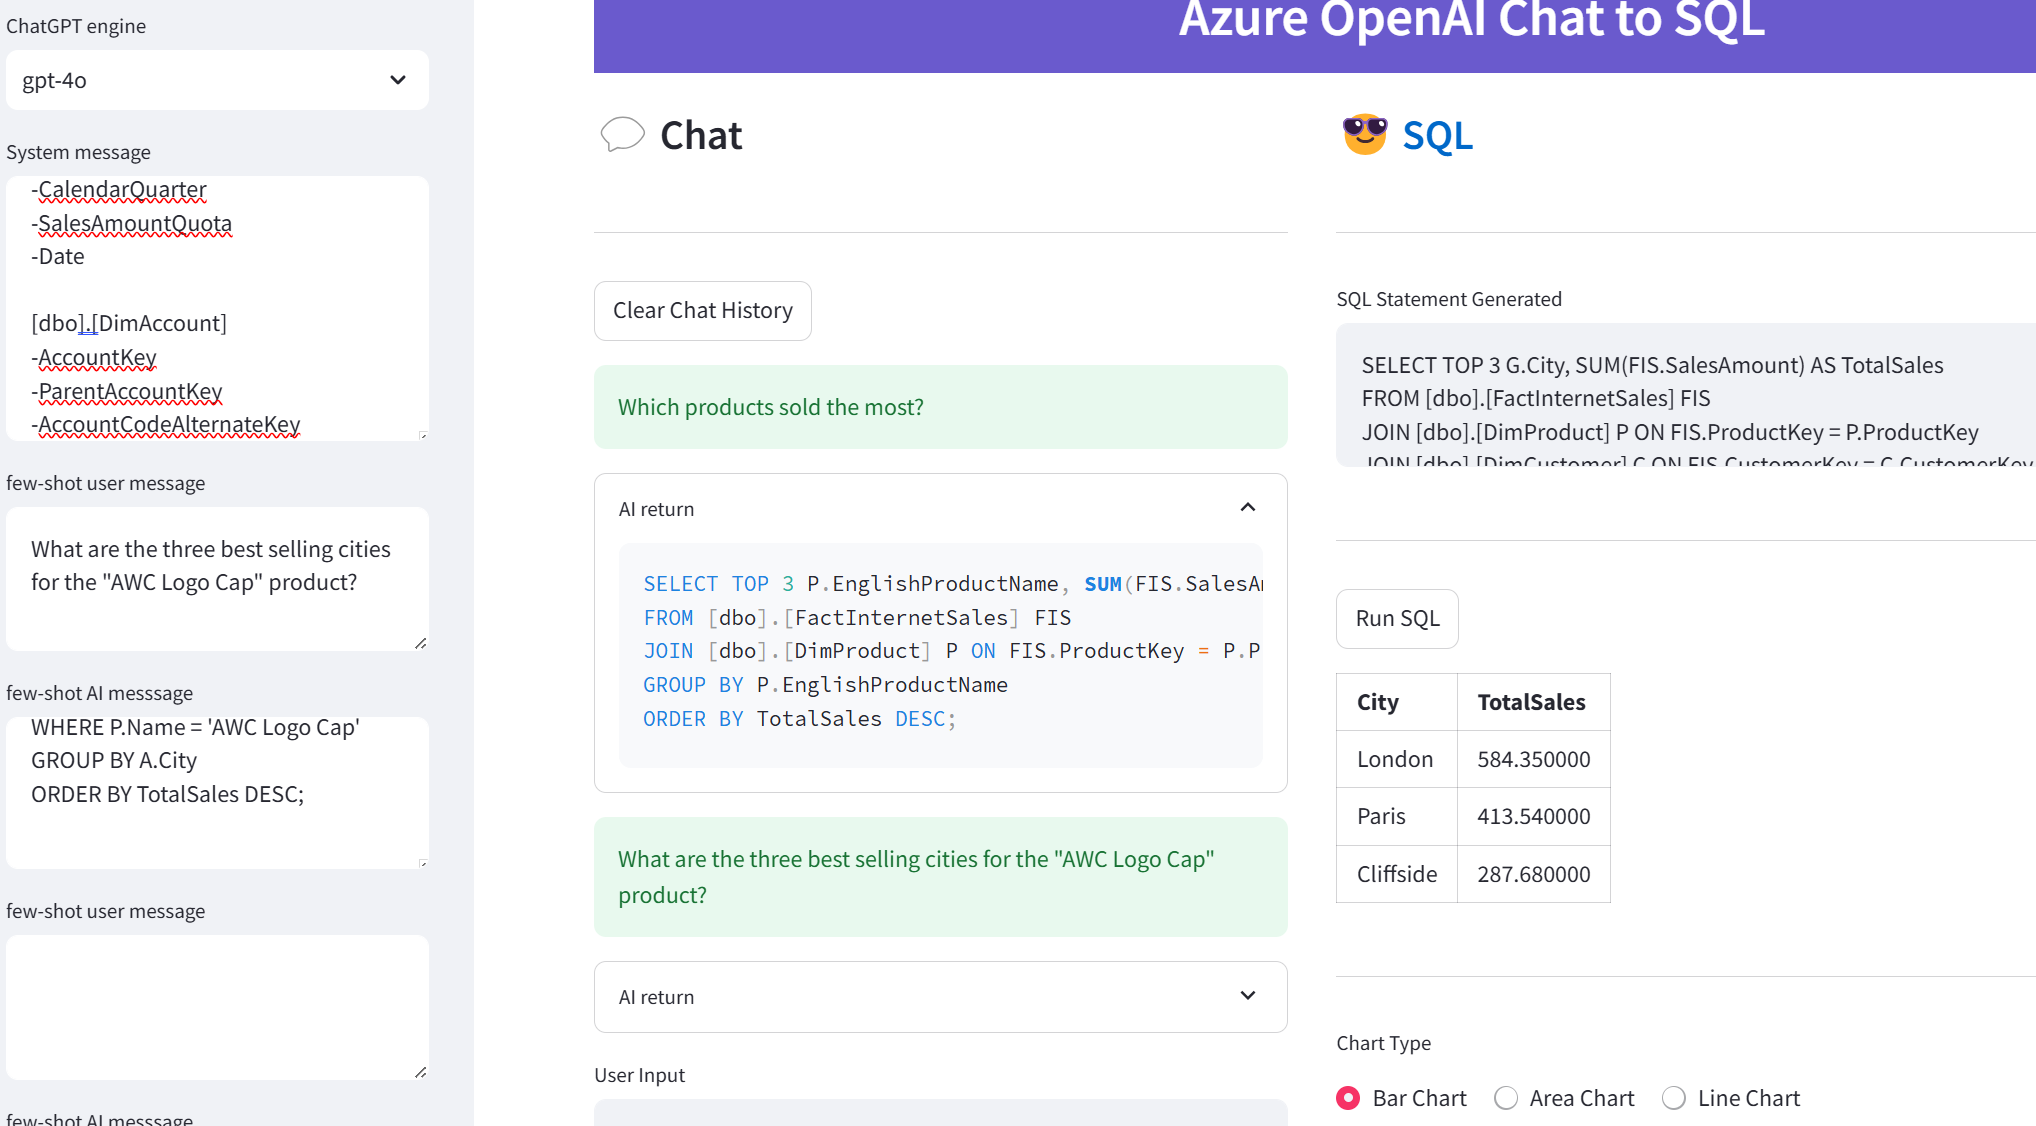
As inspired by Kevin Jordain, who clued me about the increased demand for using natural questions to analyze client’s data, John Kerski, who did a great presentation to our Atlanta BI Group on integrating Power Query with Azure OpenID, and Kyle Hale, who believes (wrongly 😊) that the Databricks Genie will make Power BI and semantic modeling obsolete, I set on a quest to find how effective Large Language Models (LLM) are in generating SQL from natural questions, also known as Text2SQL. What a better way to spend some free time around the 4th of July holiday, right? I have to say that I was impressed with LLM. I used the excellent Ric Zhou’s Text2SQL sample as a starting point inside Visual Studio Code. The sample uses the Python streamlit framework to create a web app that submits natural questions to Azure OpenAI. My humble contributions were: I switched to...
-
Atlanta Microsoft BI Group Meeting on July 1st (Commenting Power Query with Azure OpenAI)
June 25, 2024 / No Comments »

Atlanta BI fans, please join us in person for the next meeting on Monday, July 1st at 6:30 PM ET. John Kerski (Microsoft MVP) will shows us how to integrate ChatGPT with Power BI. Your humble correspondent will help you catch up on Microsoft BI latest. CloudStaff.ai will sponsor the event. For more details and sign up, visit our group page. Details Presentation: Commenting Power Query with Azure OpenAI Delivery: In-person Date: July 1, 2024 Time: 18:30 – 20:30 ET Level: Intermediate Food: Pizza and drinks will be provided Agenda: 18:15-18:30 Registration and networking 18:30-19:00 Organizer and sponsor time (events, Power BI latest, sponsor marketing) 19:00-20:15 Main presentation 20:15-20:30 Q&A Venue Improving Office 11675 Rainwater Dr Suite #100 Alpharetta, GA 30009 Overview: Large Language Models (such as ChatGPT) can greatly enhance the way you develop and deliver Power BI solutions. In this session I will show you how to integrate Azure Open AI into...
-
Fabric Analytics Engineer Certification Snagged
June 7, 2024 / No Comments »

Just passed DP-600 and therefore I'm officially a Fabric Analytics Engineer. Besides renewals, I intend this to be my last Microsoft certification. After more than 30 years of certifying (12 certifications and 30 exams) and helping other certify with training and books, I think it's time to close this chapter. Call me certifiable...
-
Modern Data Warehouse (MDM) Reloaded
June 1, 2024 / No Comments »
"Where are the prophets, where are the visionaries, where are the poets To breach the dawn of the sentimental mercenary" "Fugazi", Marillion I’ve written in the past about the dangers of blindly following “modern” data architectures (see my posts “Are you modern yet?” and “Data Lakehouse: The Good, the Bad, and the Ugly”) but here we go again. Once upon a time, a large company hired a large Microsoft partner to solve a common and pervasive challenge. Left on their own, departments have set up their own data servers, thus creating data silos leading to data duplication and inconsistent results. How did the large vendor attempt to solve these horrible issues? Modern Data Warehouse (MDM) architecture of course. Nothing wrong with it except that EDW and organizational semantic model(s) are missing and that most of the effort went into implementing the data lake medallion architecture where all the incoming data...
-
Atlanta Microsoft BI Group Meeting on June 3rd (Power BI Direct Lake storage mode)
May 28, 2024 / No Comments »

Atlanta BI fans, please join us in person for the next meeting on Monday, June 3rd at 6:30 PM ET. Shabnam Watson (Consultant and Owner of ABI Cube) will discuss the benefits of using the Direct Lake storage mode in Microsoft Fabric. Your humble correspondent will help you catch up on Microsoft BI latest. CloudStaff.ai will sponsor the event. For more details and sign up, visit our group page. Presentation: Power BI Direct Lake storage mode: How to achieve blazing fast performance without importing data Delivery: In-person Time: 18:30 – 20:30 ET Level: Beginner/Intermediate Food: Pizza and drinks will be provided Agenda: 18:15-18:30 Registration and networking 18:30-19:00 Organizer and sponsor time (events, Power BI latest, sponsor marketing) 19:00-20:15 Main presentation 20:15-20:30 Q&A Venue Improving Office 11675 Rainwater Dr Suite #100 Alpharetta, GA 30009 Overview: Power BI engine in Microsoft Fabric has been significantly revamped to work directly with Delta files in OneLake. This brand-new...

 We offer onsite and online Business Intelligence classes! Contact us about in-person training for groups of five or more students.