-
Top 5 Reasons to Switch to Power BI Gen2
June 17, 2021 / No Comments »

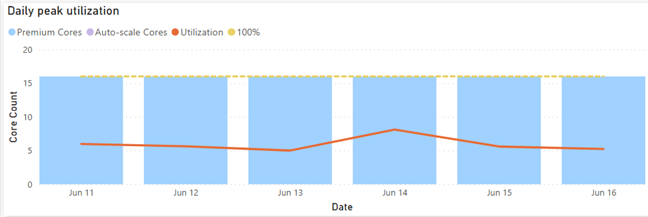
You should definitely switch your Power BI Premium capacities to Gen2 although you might wait until it goes GA because Gen2 is currently in preview if you're risk-averse. I switched an enterprise client P2 node to Gen 2 a few months ago and here are the top benefits we observed: Lower CPU utilization The Gen1 P2 node was under CPU pressure so the client was considering upgrading to P3. This went away after switching to Gen2 as the graph below shows. That's because each operation essentially has access to all the cores on the node (which is essentially a P3 node). This can give you a nice boost to performance as well. This doesn't mean that you get more cores for free. If Power BI detects that the CPU used by the capacity (across all its datasets/dataflows/etc.) is exceeding the CPU that you have purchased, then subsequent operations would be...
-
Power BI Aggregations: Limitations and Workarounds
June 9, 2021 / No Comments »

Power BI aggregations are meant to speed up queries to large DirectQuery tables, as a DBA would create summarized tables to speed up queries to large tables. The most appealing aspect of telling Power BI about these aggregations is that Power BI will automatically redirect the query to the aggregation cache if it determines that its dimensionality matches the dimensionality of the aggregated table, as explained in the documentation. However, there are a couple of limitations worth emphasizing that will prevent this from happening: Power BI requires regular relationships with 1:M cardinality and uni-directional filter between the dimension table and aggregation table. Many-to-many cardinality (aka "limited" relationships in the documentation) won't work. For example, you might have a Customer table related with 1:M to a CustomerFilter table. Queries involving the CustomerFilter table won't hit the aggregation cache. Dynamic relationship won't hit the cache either. For example, as a workaround for...
-
Atlanta MS BI and Power BI Group Meeting on June 7th
June 2, 2021 / No Comments »

Please join us online for the next Atlanta MS BI and Power BI Group meeting on Monday, June 7th, at 6:30 PM. Stacey Jones (Principal Data Solutions Architect with Microsoft) will introduce us to Azure Purview. And I'll cover the Power BI latest enhancements. For more details and sign up, visit our group page. Presentation: Data Governance with Azure Purview Date: June 7th Time: 6:30 – 8:30 PM ET Place: Click here to join the meeting Overview: Have auditors asked for a report detailing sensitive data in your Company? Are you having trouble finding out where all your data resides? Are Data Scientists and analysts wasting time finding the right data? What will be impacted if I change this column in a table? Where is personnel data stored? Are we in compliance with information security standards that apply to us? If you answered yes to any of these or related...
-
Tracing Anonymous Logons
May 27, 2021 / No Comments »

In a recent project, I had to execute an SSIS package deployed to the catalog from a stored procedure. The package uses Windows authentication to connect to the data sources. When executing the package from the catalog or from the stored procedure, the package immediately fails and the following two errors are logged: DTS_E_CANNOTACQUIRECONNECTIONFROMCONNECTIONMANAGER. The AcquireConnection method call to the connection manager "Source" failed with error code 0xC0202009. There may be error messages posted before this with more information on why the AcquireConnection method call failed. OLE DB error has occurred. Error code: 0x80040E4D. An OLE DB record is available. Source: "Microsoft SQL Server Native Client 11.0" Hresult: 0x80040E4D Description: "Login failed for user 'NT AUTHORITY\ANONYMOUS LOGON'.". The culprit of course is that this scenario requires Kerberos delegation because of the two-hop authentication required: From SSMS on my development machine to the server where the SSIS package is executed From...
-
A First Look at Power BI Goals
May 12, 2021 / No Comments »

A vital BI practice for every organization, performance management ensures that important metrics, such as Key Performance Indicators (KPIs), meet established goals. The typical artifact to do so is implementing a scorecard: a report that compares the current state with the desired state of these metrics. You might have also heard the term "balanced scorecard" which is an organization-wide scorecard that tracks several subject areas, such as Finance, Customer, and Operations. In the past you have probably used different tools, such as the now deprecated PerformancePoint (included in SharePoint Server) to implement scorecards. Realizing the importance of scorecards, Power BI introduced Goals that aim to simplify the process of implementing departmental and organizational scorecards. For more information on how Goals works, watch the "Goals in Power BI" presentation from the Microsoft Business Application Summit. The Good As with anything Power BI, Microsoft has democratized scorecards so business users with no...
-
Atlanta MS BI and Power BI Group Meeting on May 3rd
April 28, 2021 / No Comments »

Please join us online for the next Atlanta MS BI and Power BI Group meeting on Monday, May 3rd, at 6:30 PM. James Serra will overview Azure Synapse for implementing a data lakehouse. And I'll cover the Power BI latest enhancements. For more details and sign up, visit our group page. Presentation: Azure Synapse Analytics Overview: A Data Lakehouse Date: May 3rd Time: 6:30 – 8:30 PM ET Place: Click here to join the meeting Overview: Azure Synapse Analytics is Azure SQL Data Warehouse evolved: a limitless analytics service that brings together enterprise data warehousing and Big Data analytics into a single service. It gives you the freedom to query data on your terms, using either serverless on-demand or provisioned resources, at scale. Azure Synapse brings these two worlds together with a unified experience to ingest, prepare, manage, and serve data for immediate business intelligence and machine learning needs. In...
-
Use Edge Dev Profiles
April 26, 2021 / No Comments »

If you need a convincing reason to use Edge Dev, user profiles might be it. I need access to various Power BI tenants that I need to log in. Or, your organization might have multiple Power BI tenants, such as a byproduct of acquisitions. Previously, I had to either use multiple browsers, open an incognito session (the caveat is that you can't have two incognito sessions with different credentials), or install browser extensions to support simultaneous open sessions to Power BI. Now, all I have to do is to create a profile for each client. To do so: Open Edge Dev. Click the Profile icon in the top right and then click Add Profile. Follow the steps to log in using the needed credentials. Once the profile is created, click the profile icon and then click the desired profile. This will open a new normal (not incognito) session side by...
-
Top 5 Power BI UX Gaps
April 11, 2021 / No Comments »

Power BI has made tremendous strides in features solidifying its position as a BI leader and increasing the feature distance over the competition (see latest Gartner report here). And rightfully so, considering that it's much more than a visualization tool. However, you might find its advanced presentation capabilities still lagging. During a current BI assessment for a large mortgage company, the executive sponsor who have used before Tableau and Qlik told me that "some features that could be done in Qlik or Tableau in 10 minutes could take days with Power BI". So much about "five seconds to sign up, five minutes to wow!" It's hard to vow an audience that has seen better … Here are the top 5 Power BI UX gaps to watch for especially if you're migrating to Power BI from these two tools: No dynamic binding – A long time ago, Microsoft promised that most...
-
Awarded FastTrack Recognized Solution Architect
April 8, 2021 / No Comments »

Microsoft awarded me FastTrack Recognized Solution Architect - Power BI! This prestigious recognition is conferred by the Power Platform product engineering team for consistently exhibiting deep architecture expertise and creating high quality solutions for customers during project engagements. I'm one of the 33 individuals worldwide who must meet the following criteria: Must have a minimum of 2 years of experience with Power BI and a minimum of 5 years of experience with Enterprise BI solutions Must have a minimum of 2 years of experience as an Enterprise BI architect Must be working for a partner with Gold certification in Data Analytics MPN competency Must have been lead architect for at least 2 Power BI in-production implementations with at least 200 active users (Preferably for CAT managed customers) I might be also featured in a short video during the James Phillip's keynote on May 4th at the Microsoft Business Application Summit.
-
When Something Goes Wrong (Unable to Load the Model)
March 18, 2021 / No Comments »

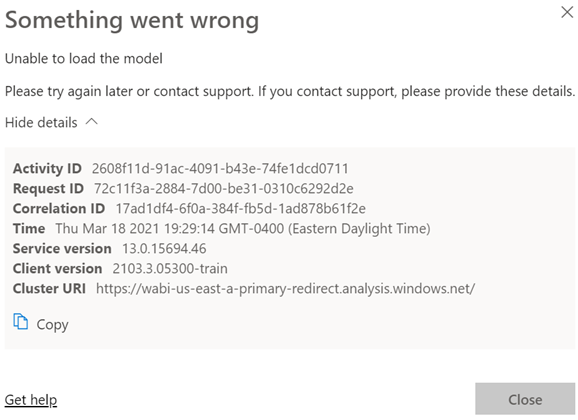
Scenario: You deploy a model to a Power BI workspace. You assign users to Members and Viewers roles. Everyone is happy. You later added a row-level security role and republish the model. Admins, Contributors and Members continue to view reports connected to the dataset as usual. However, Viewers report an error like the one shown below (didn't Microsoft do an outstanding job explaining what went wrong with all of these guids?): Analysis: Users with Administrator, Member, and Contributor permissions bypass any row-level security policies even if they assigned as role members. However, viewers are refused access unless they are added to a role that grants them the appropriate permissions. So, the likely culprit here is that there are some viewers that are not assigned to a role. If viewers should have unrestricted access to an RLS-enabled dataset, create an Open Access role and add them to the role. As a...

 We offer onsite and online Business Intelligence classes! Contact us about in-person training for groups of five or more students.


